TraderStart Structure Break Alerts
- 지표
- 버전: 1.4

TraderStart Structure Break Alerts
Track recent market structure breaks across multiple timeframes in one clean on-chart panel.
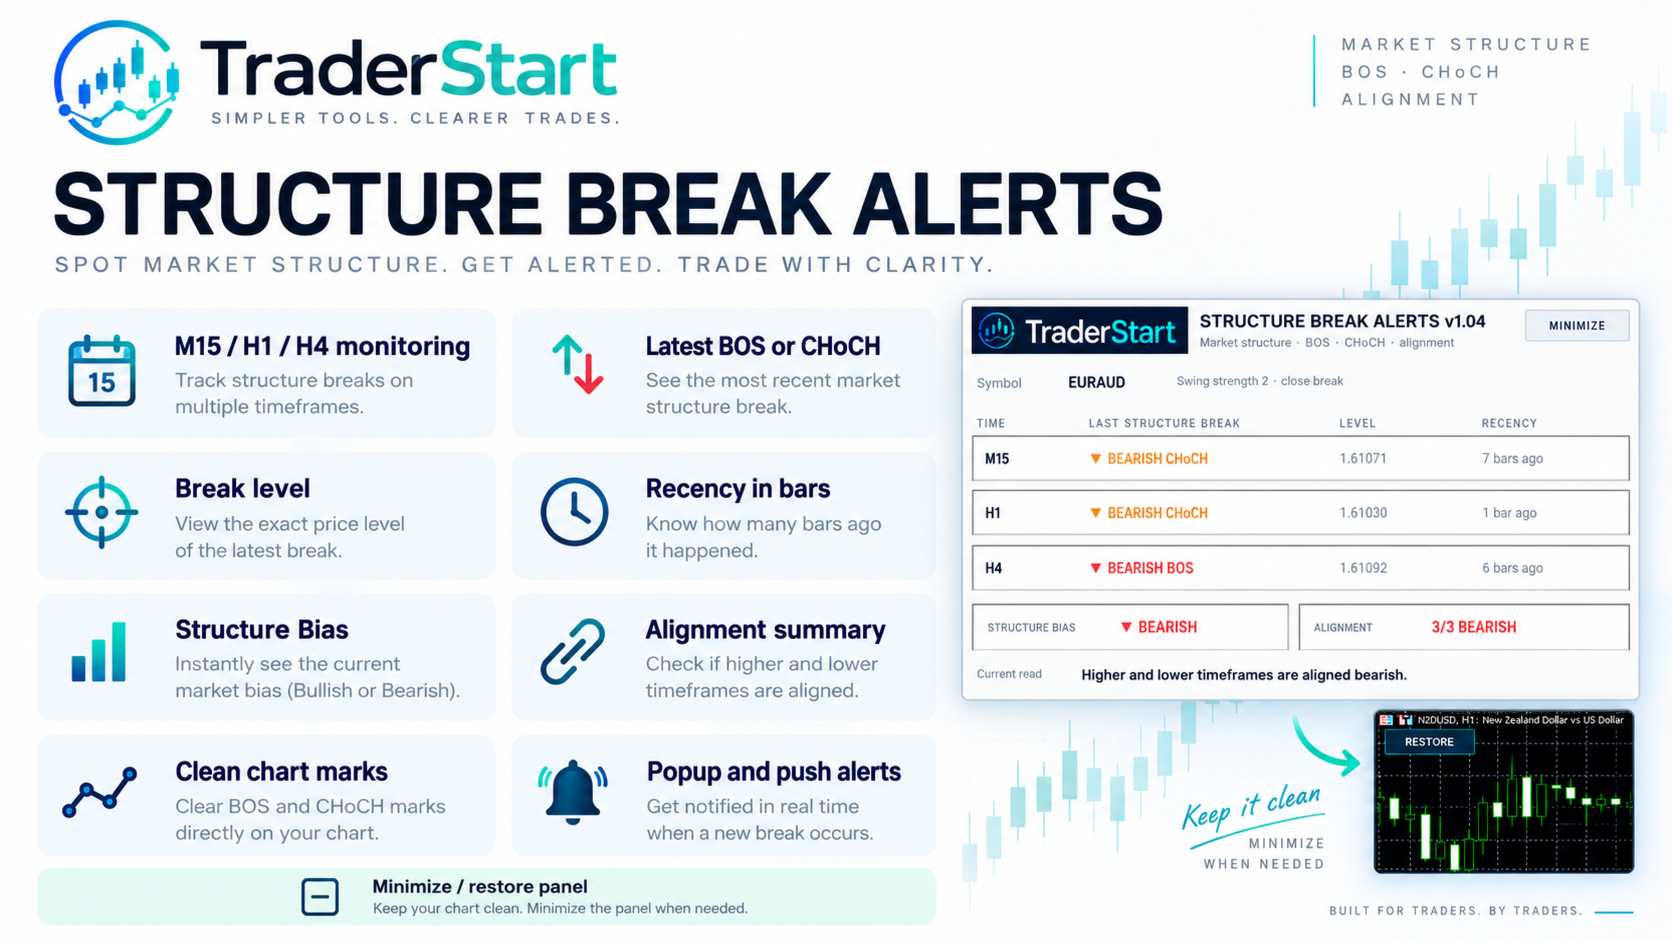
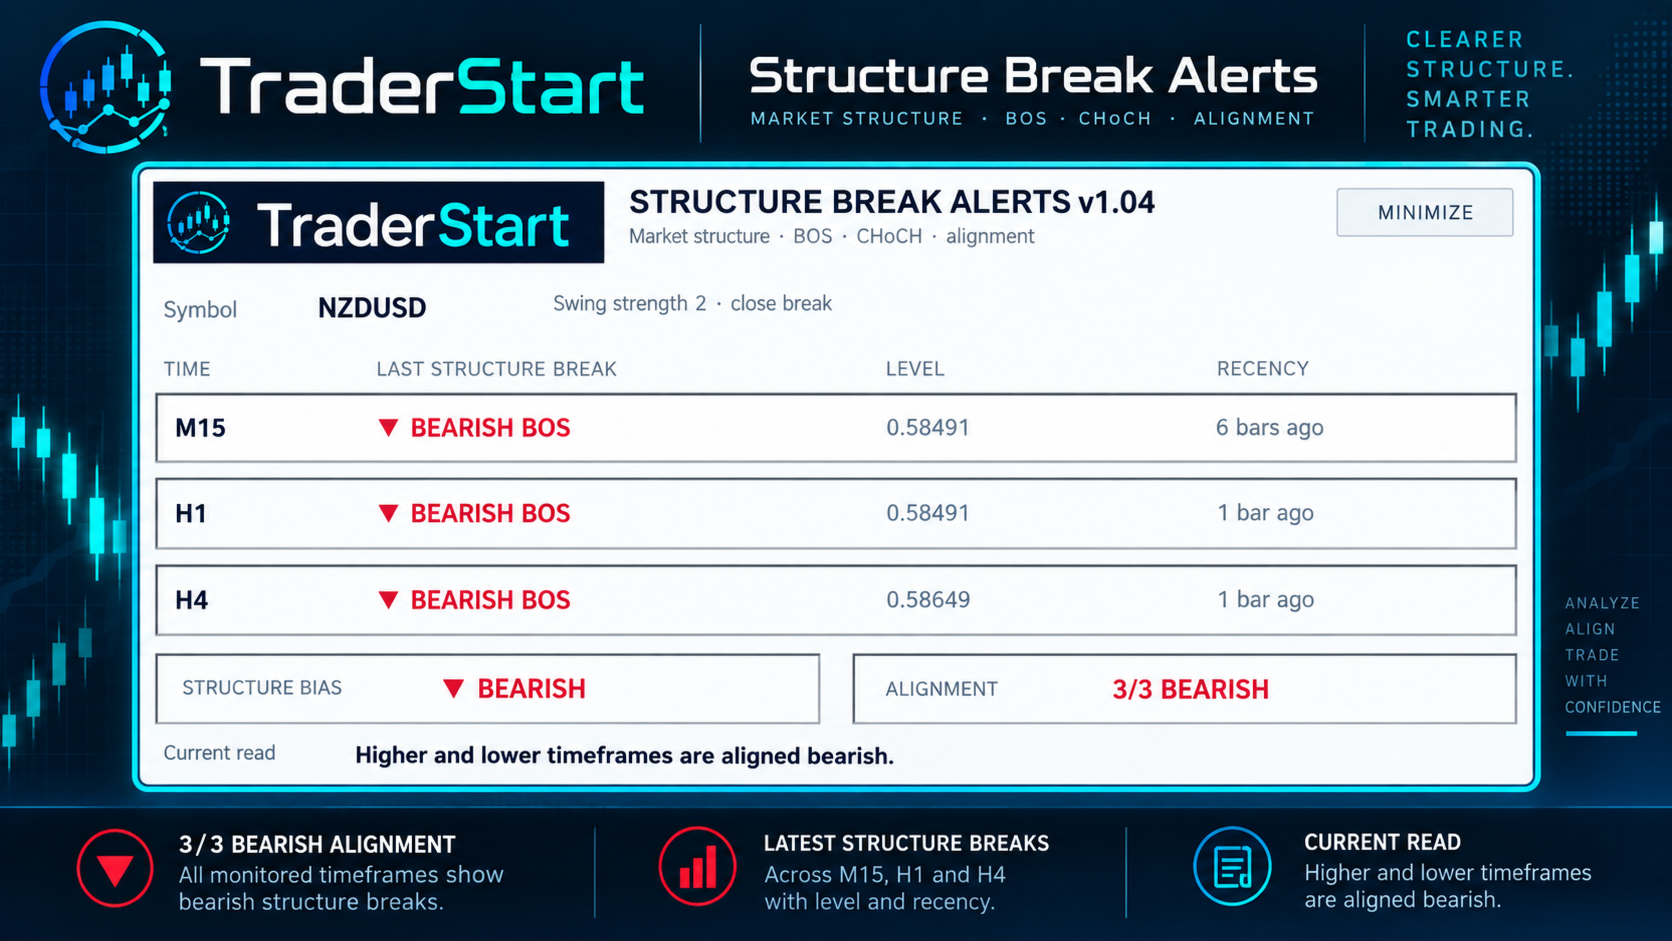
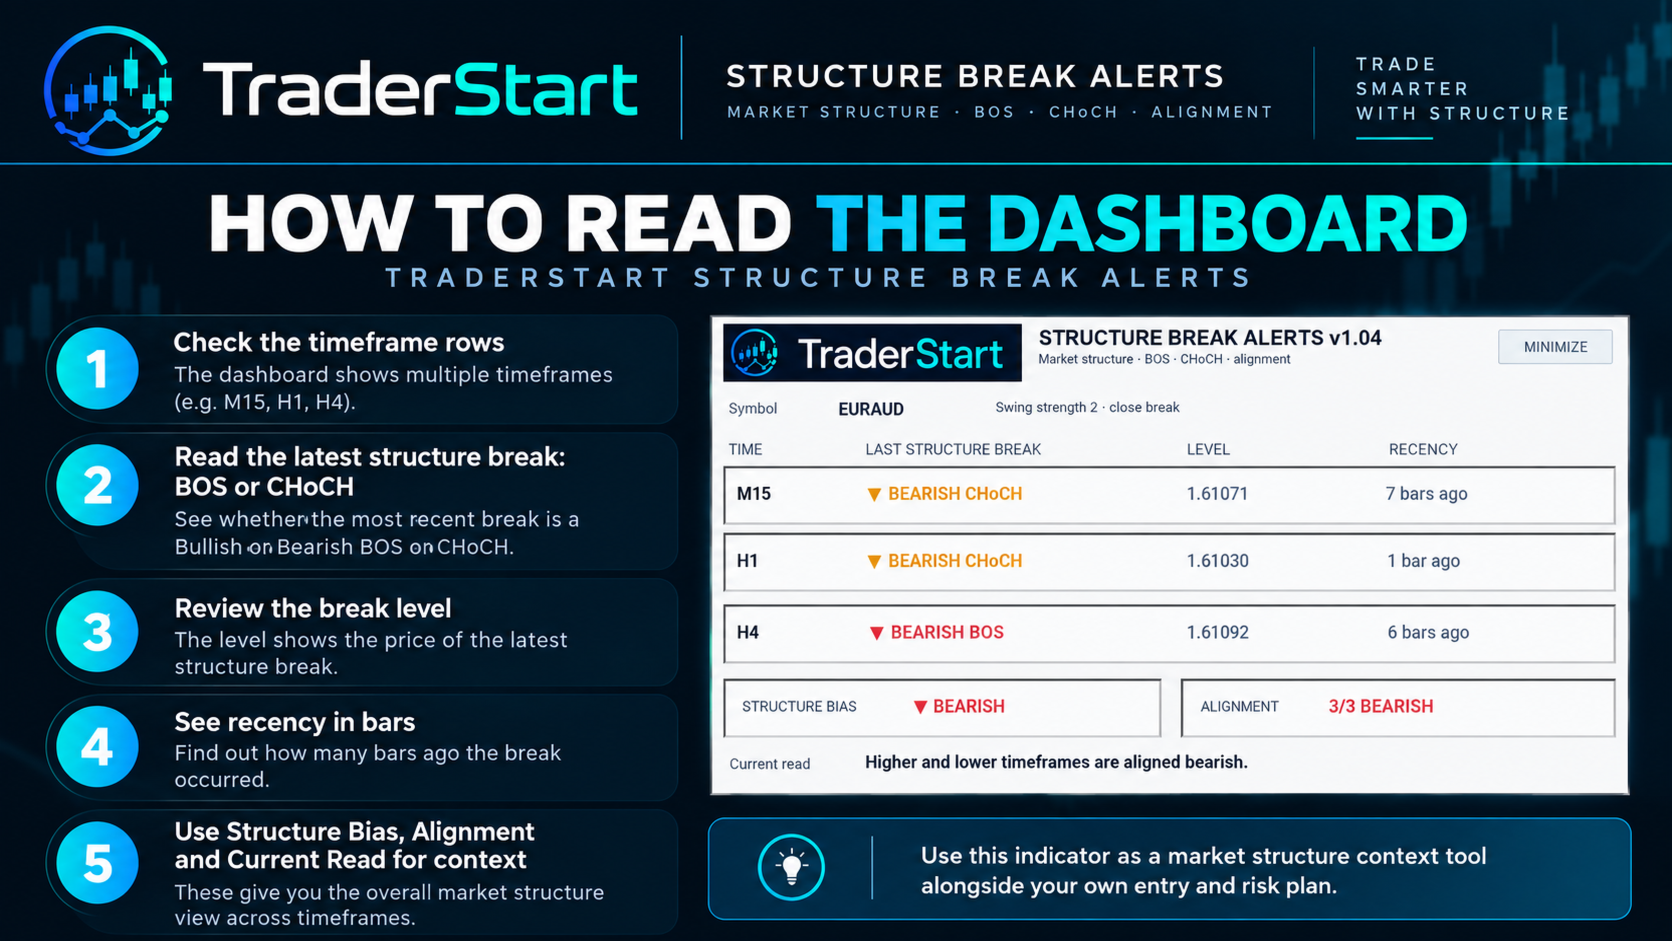
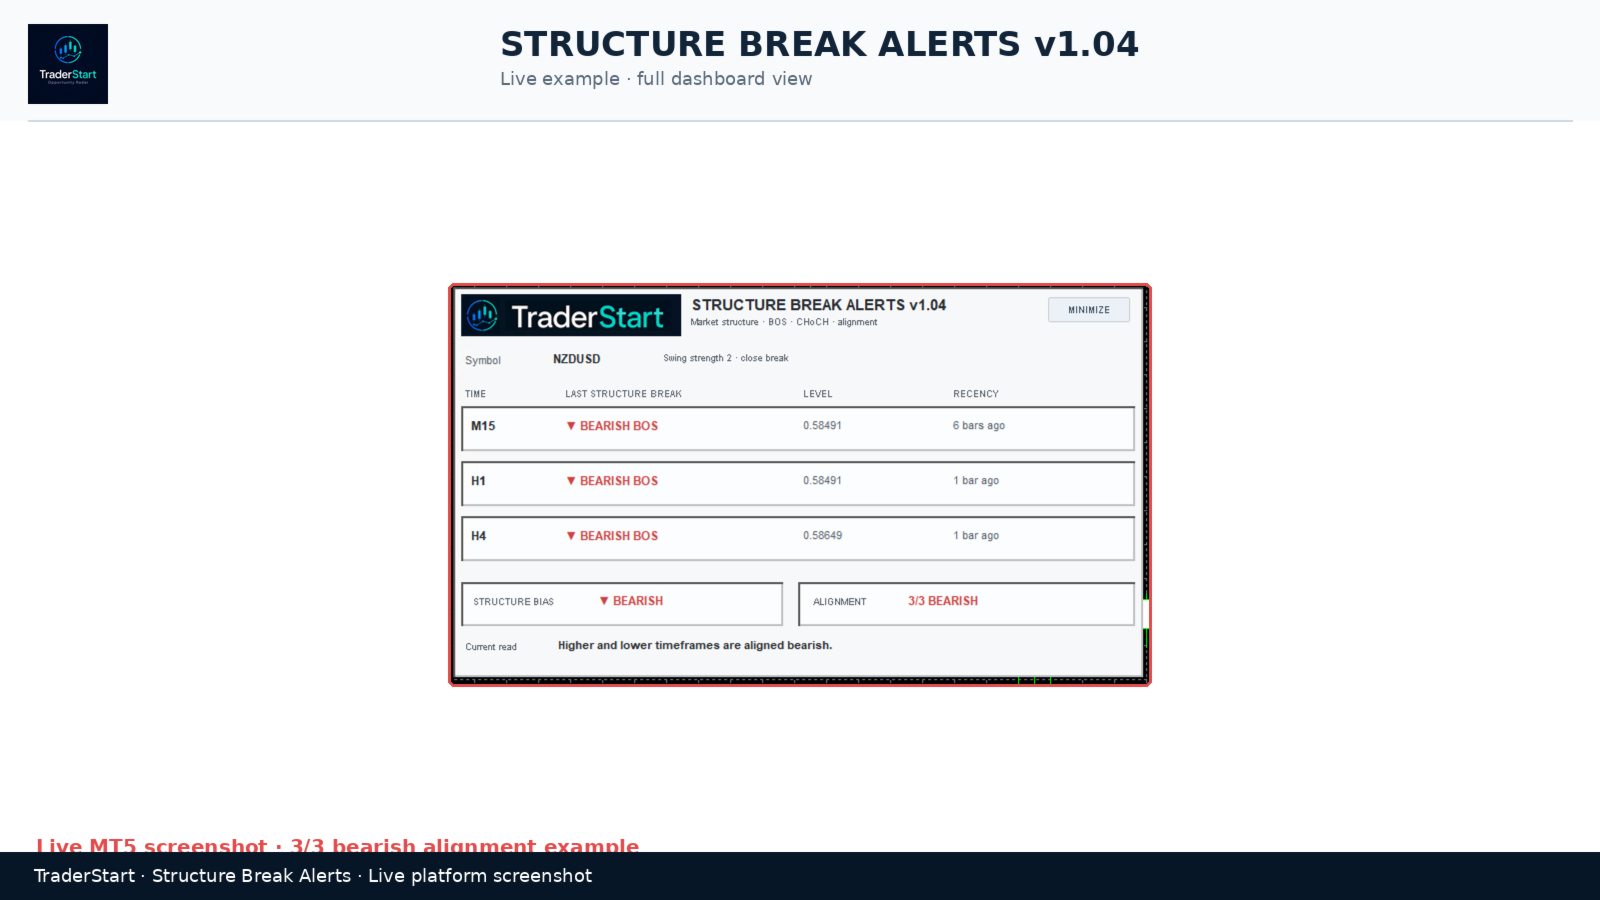
TraderStart Structure Break Alerts is a free MetaTrader 5 indicator that helps you monitor the latest market structure break on up to three configurable timeframes. It reports the most recent BOS (Break of Structure) or CHoCH (Change of Character), shows the break level, how many bars ago it occurred, and summarises the current structure bias and alignment.
The indicator is designed for traders who use market structure as part of their analysis and want a quicker way to answer practical questions such as:
- What was the latest structure break on M15, H1 and H4?
- Was the most recent break a BOS or a CHoCH?
- At what price level did that break occur?
- How recent was the break?
- Are higher and lower timeframes aligned or mixed?
- Can I keep the panel out of the way without disabling the indicator?
MAIN FEATURES
Multi-timeframe structure view
Monitor up to three configurable timeframes. The default set is M15, H1 and H4.
Latest BOS or CHoCH
For each monitored timeframe, the dashboard shows whether the latest confirmed structure event is a bullish or bearish BOS or CHoCH.
Break level
See the exact price level of the latest structure break.
Recency in bars
Know how many bars ago the latest break occurred.
Structure Bias
A simple at-a-glance structure bias summarises whether the current multi-timeframe picture is bullish, bearish or mixed.
Alignment summary
Quickly see whether the monitored timeframes are aligned in the same direction.
Current Read
A plain-English summary explains the current multi-timeframe structure state.
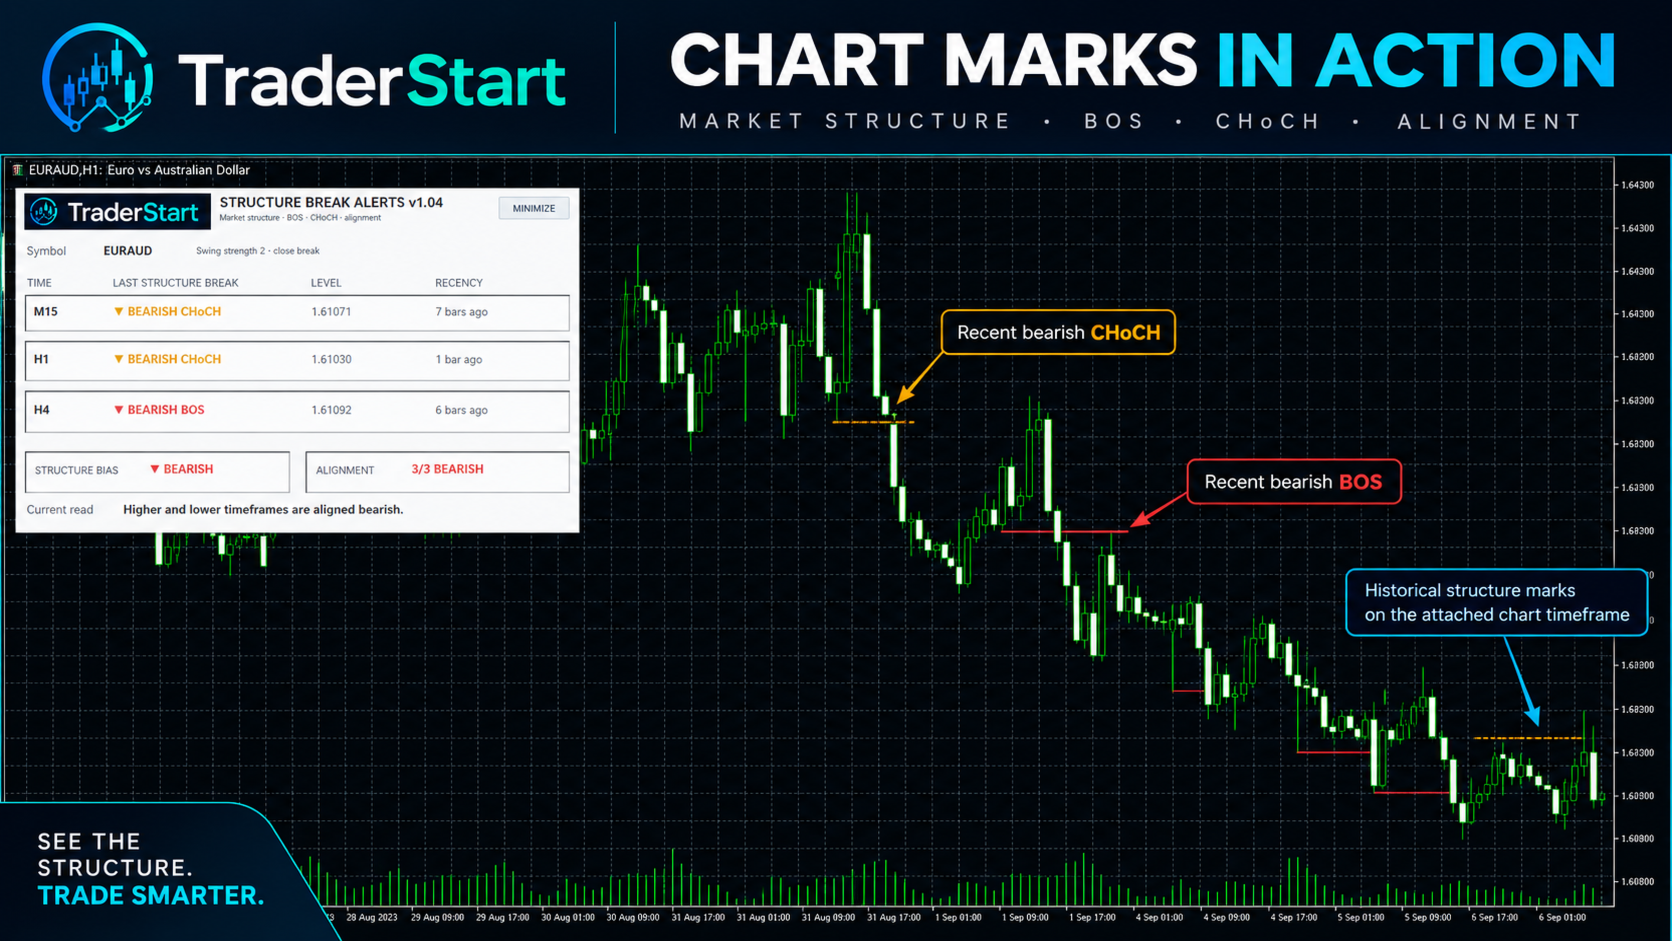
Clean chart marks
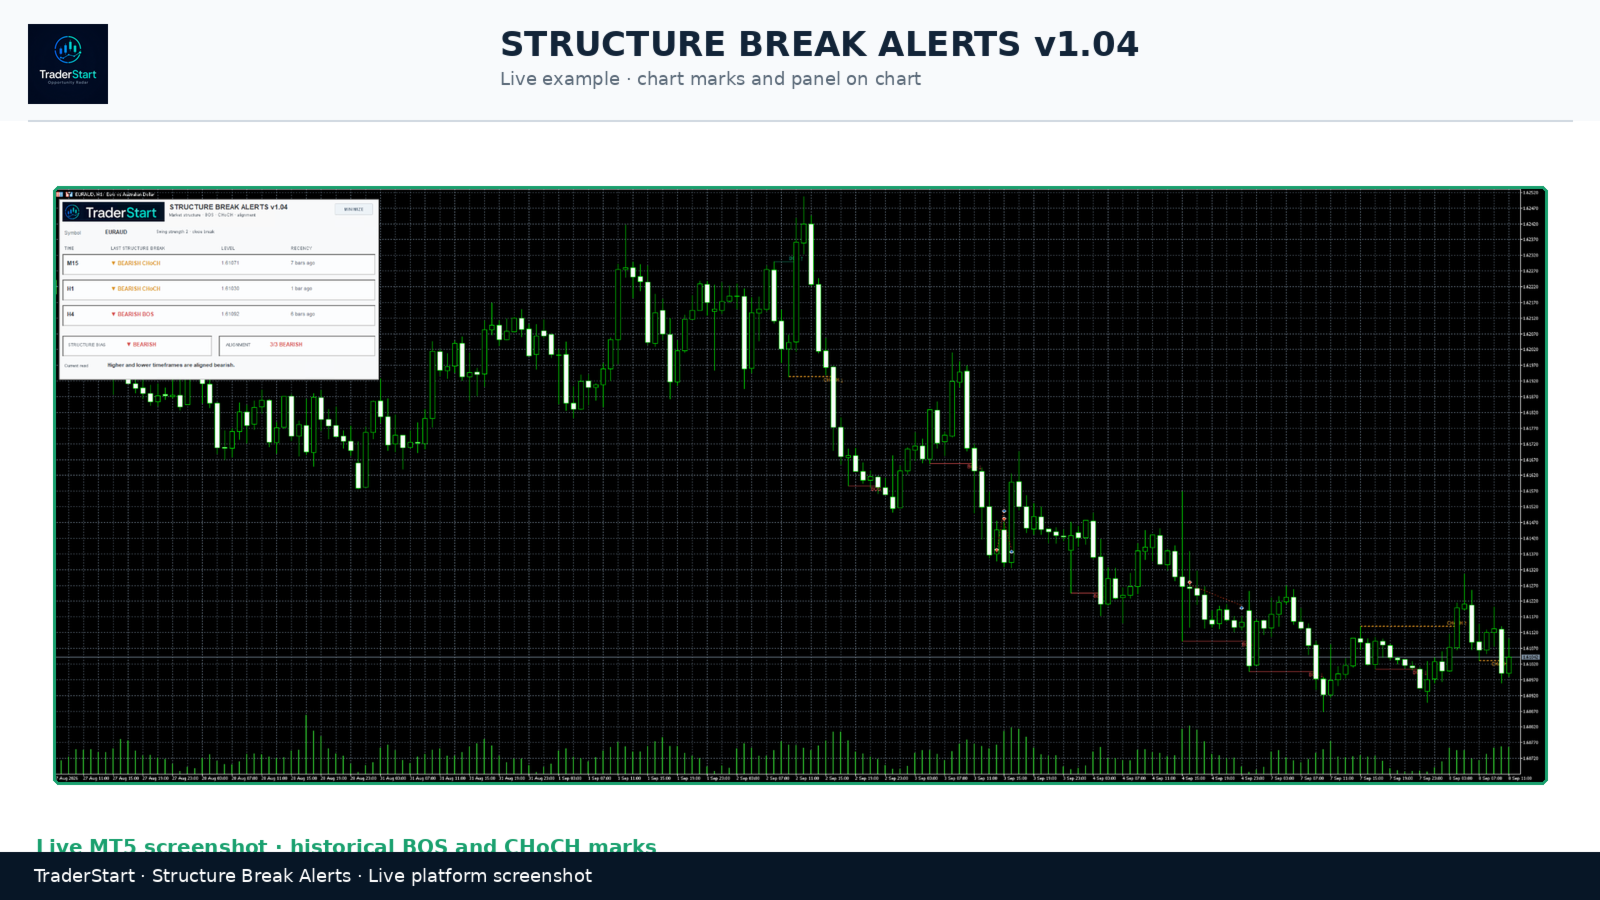
Optional historical BOS and CHoCH marks can be drawn on the attached chart timeframe.
Alerts
Optional alerts are available for:
- New BOS
- New CHoCH
- Timeframe alignment
- Popup notifications
- Push notifications
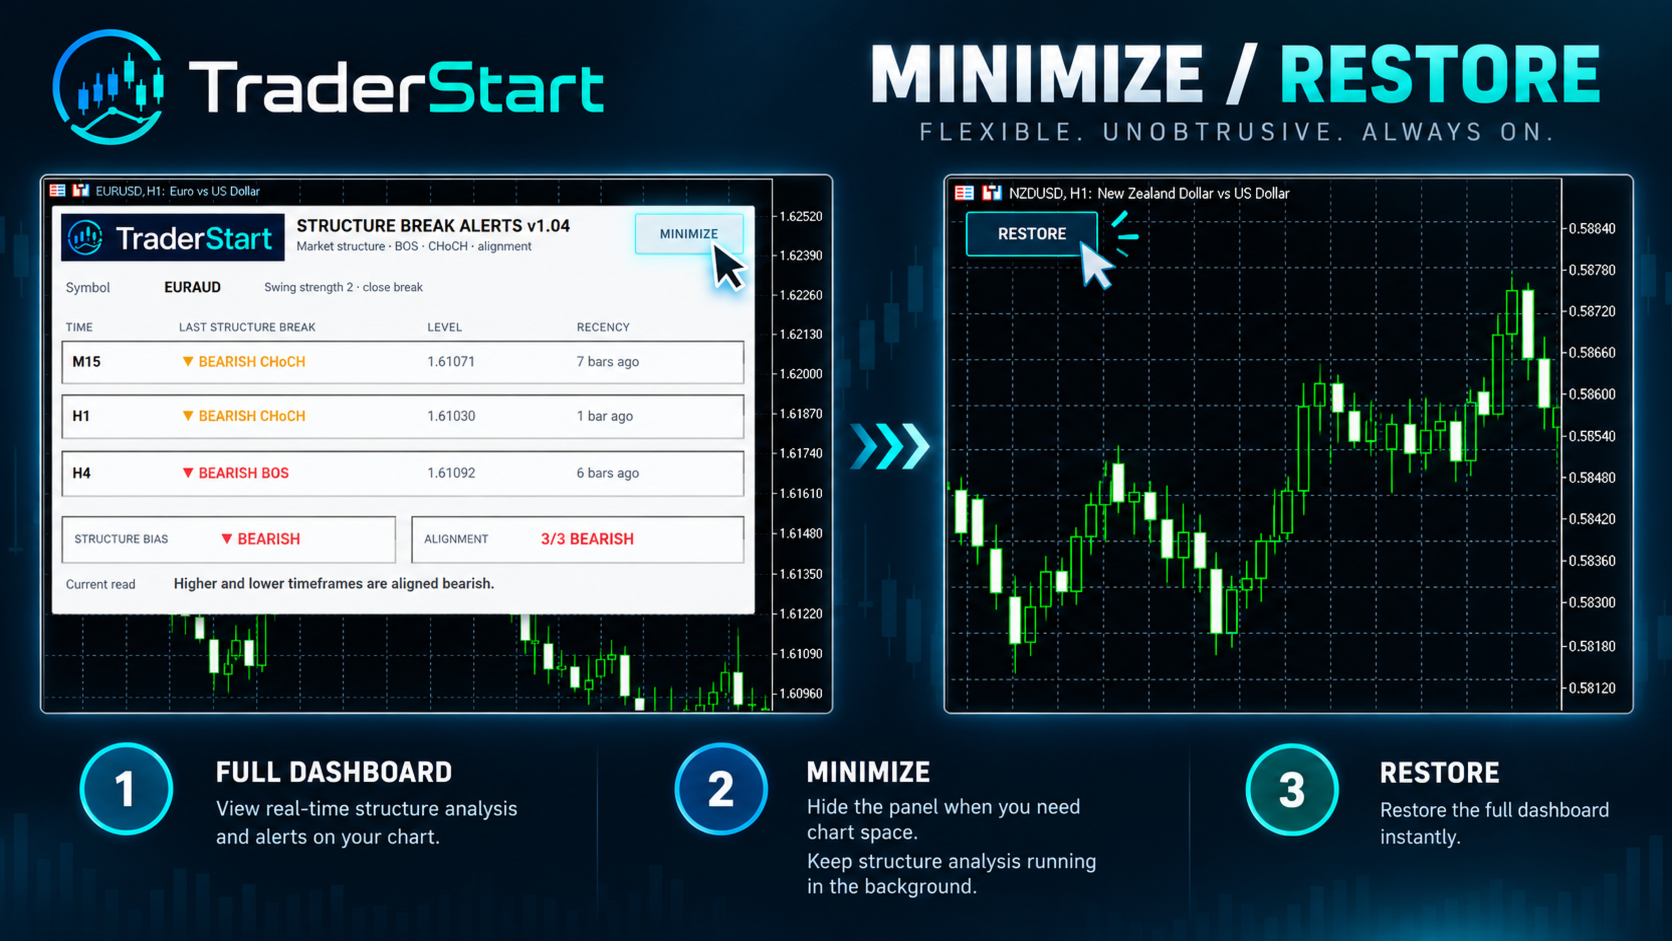
Minimize / Restore panel
Hide the dashboard when you want a cleaner chart. The indicator continues running in the background and can be restored instantly.
Start minimized option
Choose whether the panel should load in full view or minimized view.
HOW TO USE THE INDICATOR
1. Attach the indicator to a chart.
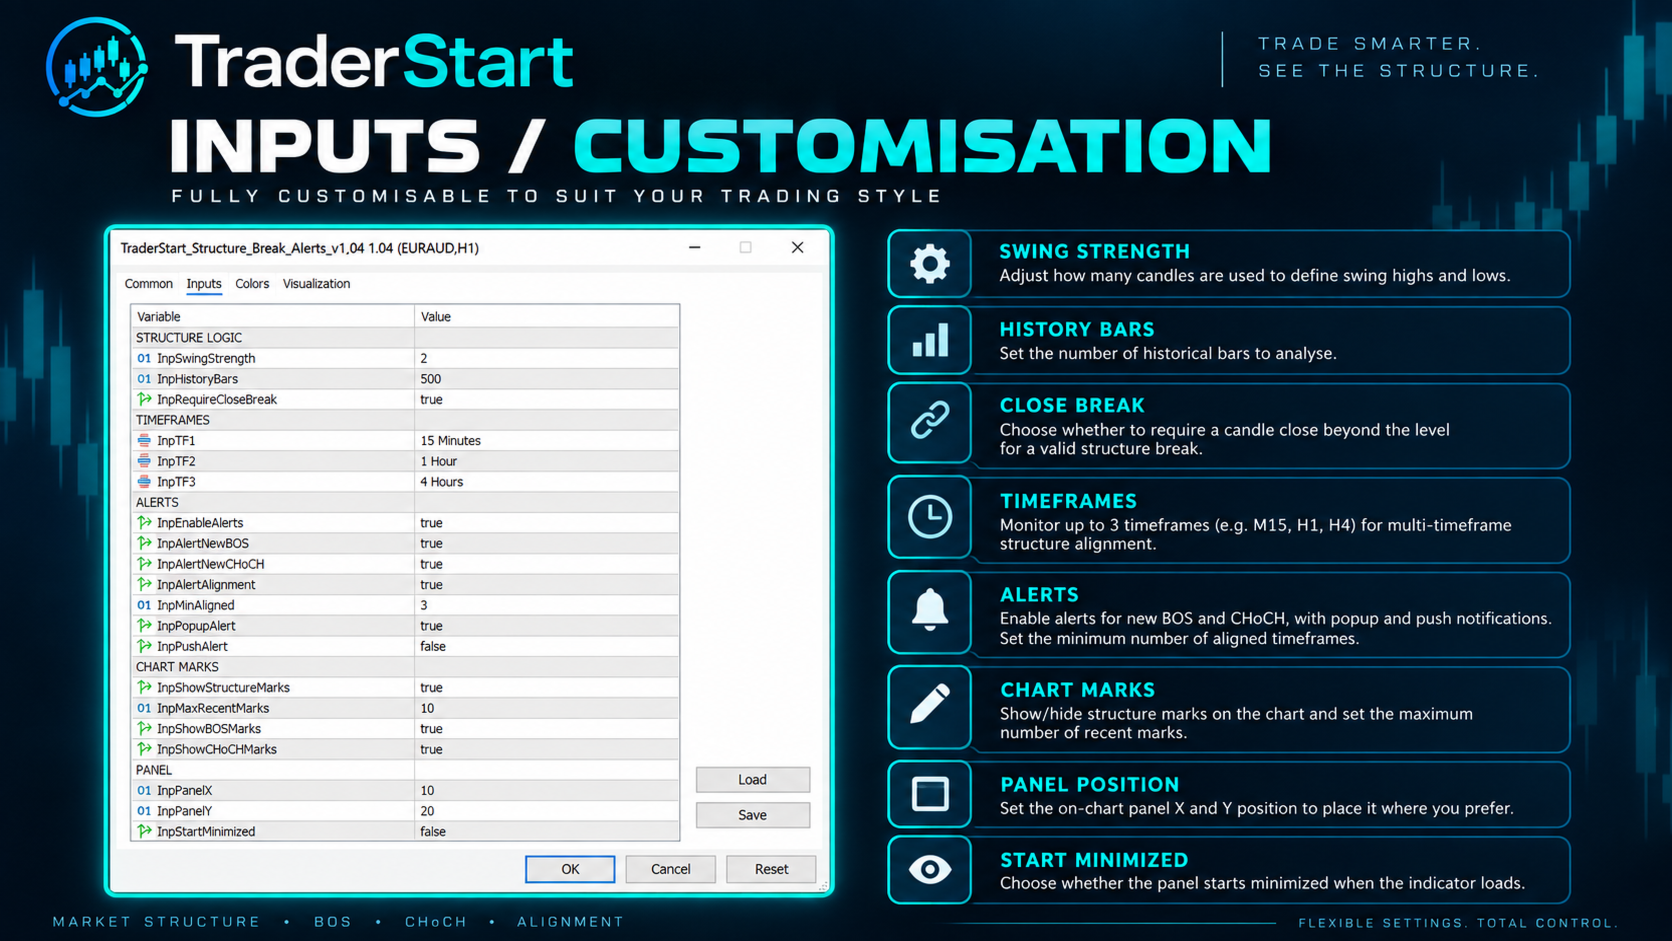
2. Choose the swing strength and other settings in Inputs.
3. Review the latest structure break on each monitored timeframe.
4. Check the break level and recency.
5. Review Structure Bias, Alignment and the Current Read summary.
6. Use the chart marks and alerts as part of your own market structure process.
IMPORTANT
TraderStart Structure Break Alerts is a market-analysis indicator. It does not place trades and it is not intended to provide automatic buy or sell instructions.
A BOS or CHoCH event does not guarantee a profitable trade. Market conditions can change, and users should apply their own analysis and risk management.
DEFAULT SETTINGS
Swing strength: 2
History bars: 500
Require close break: true
Timeframes: M15, H1, H4
Minimum aligned timeframes for alignment alert: 3
CUSTOMISATION
You can change:
- Swing strength
- Number of history bars to analyse
- Whether a candle close beyond the level is required
- All monitored timeframes
- Enable/disable alerts
- Minimum number of aligned timeframes
- Popup alerts
- Push alerts
- Show/hide structure marks
- Maximum recent chart marks
- Show/hide BOS marks
- Show/hide CHoCH marks
- Panel X and Y position
- Start minimized
WHO IT MAY SUIT
- Traders who use BOS and CHoCH in their analysis
- Traders using top-down structure review
- Trend and continuation traders
- Traders wanting a clear visual structure summary
- Traders who want structure alerts without a complicated interface
TraderStart Structure Break Alerts is designed to keep market-structure monitoring clear, practical and easy to read.
TraderStart Structure Break Alerts — FAQ
Does the indicator trade automatically?
No. It is an analysis indicator only and does not place or manage trades.
What do BOS and CHoCH mean?
BOS means Break of Structure. CHoCH means Change of Character.
How many timeframes can it monitor?
Up to three configurable timeframes are displayed in the dashboard.
What does Structure Bias mean?
Structure Bias is a summary of the current multi-timeframe structure direction.
What does Alignment mean?
Alignment shows whether the monitored timeframes are pointing in the same direction.
What does Recency mean?
Recency shows how many bars ago the most recent structure break occurred.
Can it show marks on the chart?
Yes. Optional recent BOS and CHoCH marks can be drawn on the attached chart timeframe.
Can I hide the panel?
Yes. The panel can be minimized and later restored. The indicator continues running while minimized.
Can it start minimized?
Yes. There is an input option to load the indicator in minimized mode.
Can it send alerts?
Yes. Popup and push alerts can be enabled, including alerts for new BOS, new CHoCH and alignment.
Is this a buy/sell signal indicator?
No. It is a market-structure context tool and should be combined with the user's own entry and risk-management process.