Footprint Chart Visualizer
- 지표
-
Antonello Belgrano
 MQL5 Programmer specialized in creating professional Expert Advisors and Indicators.
I develop high-quality strategies as well as custom solutions, optimizations, and personalized Expert Advisors tailored to your specific needs.
Feel free to contact me for any requests or custom projects. - 버전: 2.52
- 업데이트됨: 31 8월 2026
- 활성화: 5
Footprint Chart Visualizer
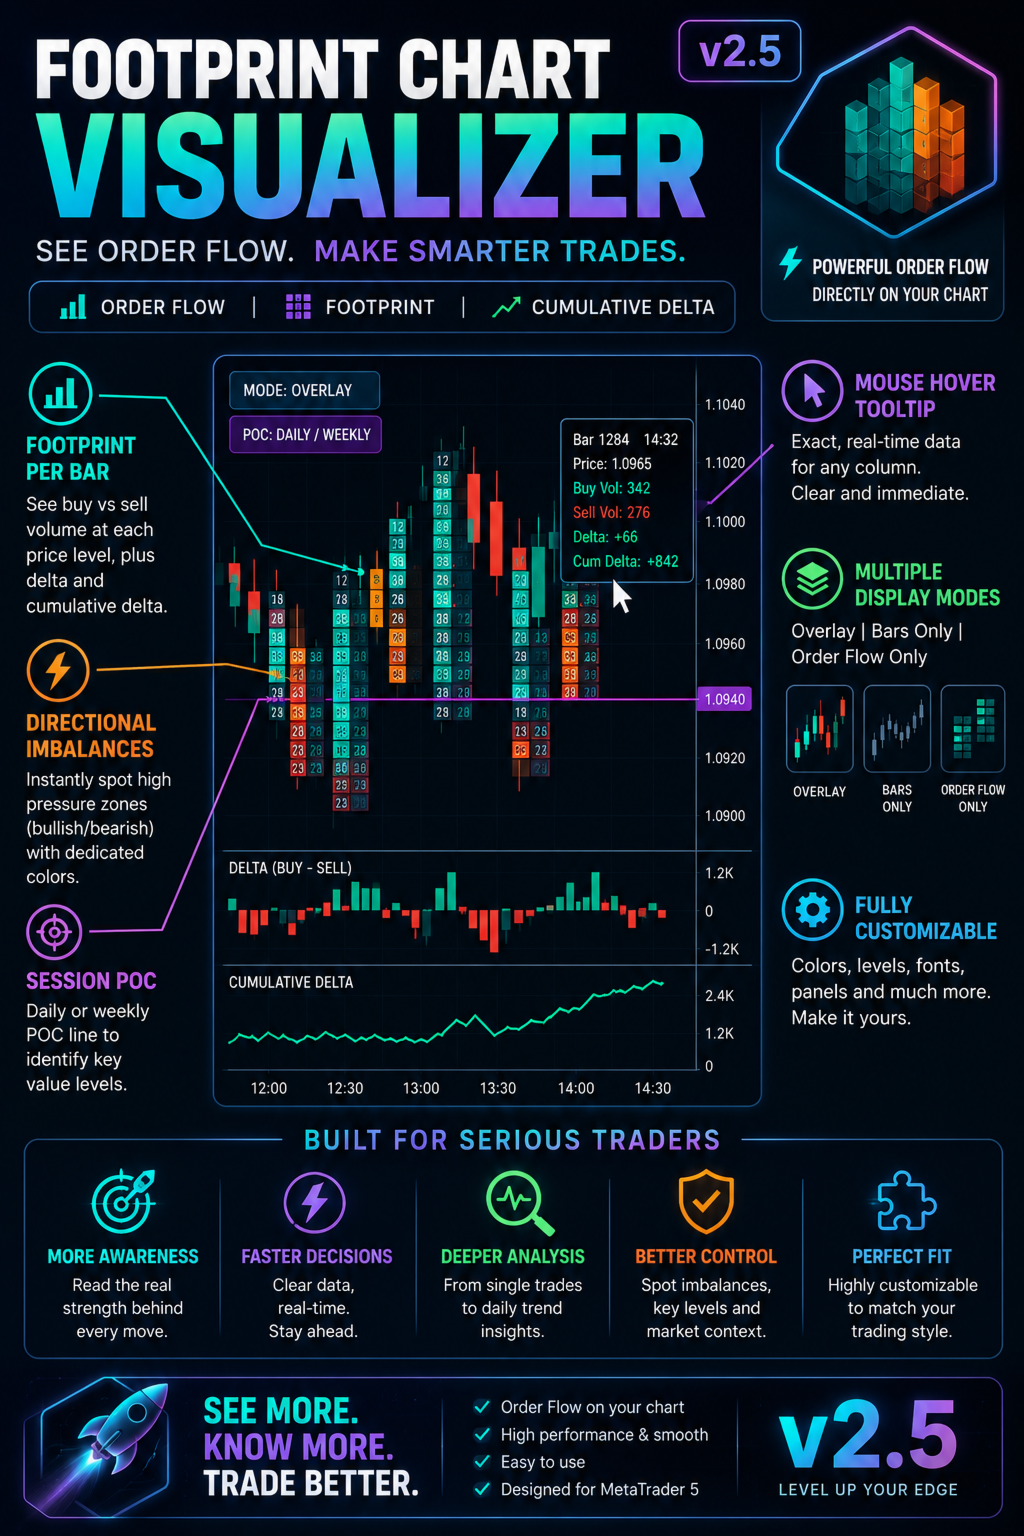
Footprint Chart Visualizer turns your main chart into a professional footprint chart, overlaying buy and sell volume at every price level directly on top of the candles, bar by bar.
Key features
- Price level footprint: each bar is split into horizontal cells showing buy and sell volume separately, with distinct colors for an instant read of order flow pressure.
- Delta panel: a delta bar (buy minus sell) for every candle, so you can spot directional imbalance at a glance.
- Cumulative delta: a running line tracking cumulative delta over time, useful for confirming or contradicting a price trend.
- Session POC (Point of Control): a horizontal line marking the price level with the highest traded volume in the current session, toggleable between Daily and Weekly with a dedicated one-click button — helps identify the "fair value" area the market keeps rotating around.
- Directional imbalance detection: automatically highlights aggressive buying (bullish imbalance, turquoise) and aggressive selling (bearish imbalance, orange) between diagonally adjacent price levels when the buy/sell ratio crosses a configurable threshold — giving an immediate, color-coded read of which side is in control at each level.
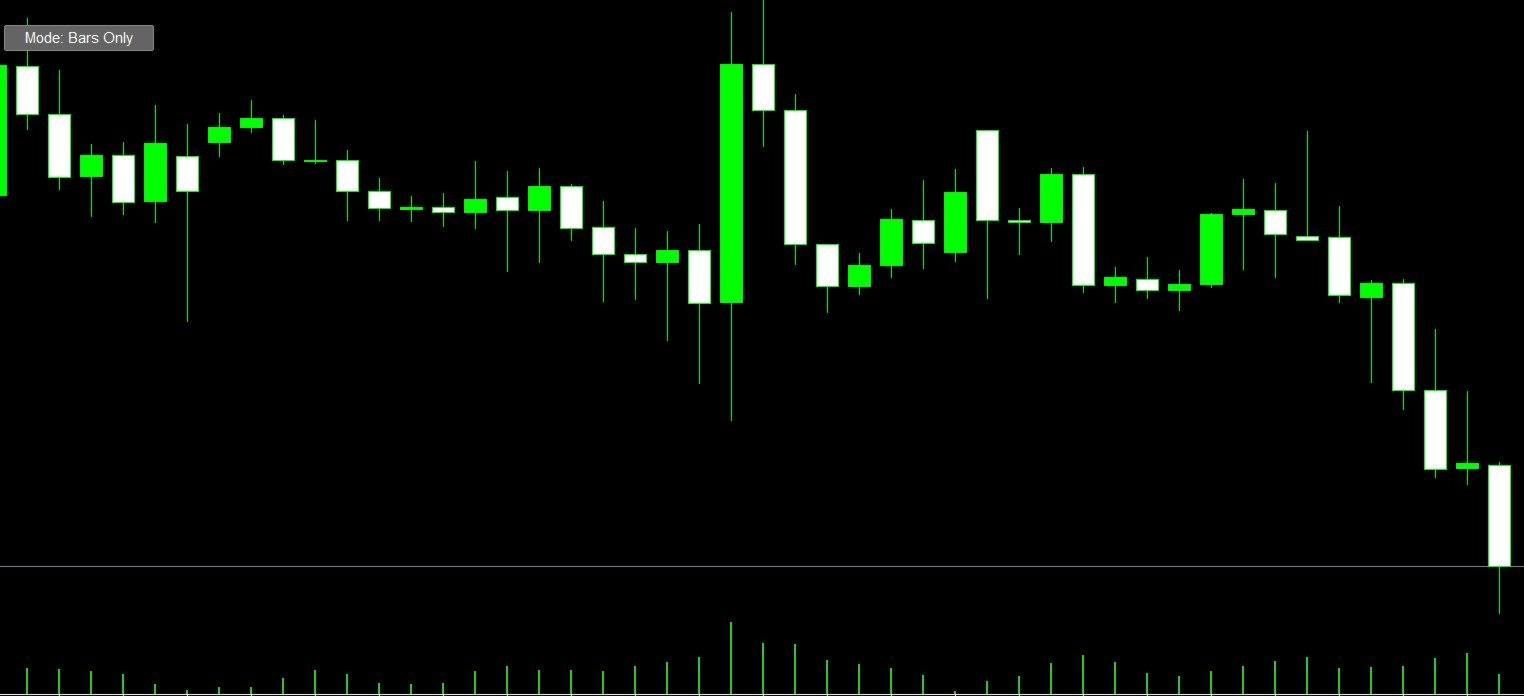
- Three display modes: Overlay (footprint under the candles), Bars Only (classic candles), and OF Only (footprint only, ideal for pure order flow analysis). Switch modes anytime with a single click on the button in the top left corner.
- Fully customizable: colors, number of price levels, font size, delta panel height, transparency, and imbalance threshold are all adjustable from the input settings.
- Lightweight and non-intrusive: updates smoothly on every tick without slowing down the chart.
Works on any symbol and any timeframe. No repaint, no external files required.
Operational tips
Some practical suggestions for real trading use:
- Use low timeframes for pure footprint reading: the footprint is most readable on M1-M15. On higher timeframes the cells get too compressed and lose meaning; OF Only on M1/M5 works best for scalping or microstructure reading.
- Delta and price should agree: if price rises but cumulative delta falls (or stays flat), that's a divergence signal, often a warning of a reversal or a weakening trend.
- Treat imbalance as confirmation, not a standalone signal: the bullish/bearish imbalance cells work best combined with a technical level (support/resistance, VWAP, order block). Used alone they generate too many false signals.
- Adjust InpImbalThresh per instrument: a 3.0 ratio is reasonable on major forex pairs, but on less liquid instruments or indices you may need to raise it (4-5) to avoid the indicator flagging imbalance on nearly every bar.
- Keep InpBarsToShow low for performance: values between 10 and 20 bars are ideal. With very large datasets, rendering can slow down the chart, especially on M1 with a high InpPriceLevels count.
- Overlay for context, OF Only for execution: a typical workflow is keeping Overlay mode for general context (candles + footprint), then switching to OF Only at key moments (level breakout, session open) to read order flow without distraction.
- Use POC as a dynamic reference level: price returning to the session POC often reacts (support/resistance behavior). Switching between Daily and Weekly POC helps you see whether the market is respecting a short-term or a longer-term value area — useful when Daily and Weekly POC diverge significantly.