Footprint Chart Visualizer

  • Indicatori
  • Antonello Belgrano
    Antonello Belgrano
    MQL5 Programmer specialized in creating professional Expert Advisors and Indicators.
    I develop high-quality strategies as well as custom solutions, optimizations, and personalized Expert Advisors tailored to your specific needs.
    Feel free to contact me for any requests or custom projects.
  • Versione: 2.52
  • Aggiornato: 31 agosto 2026
  • Attivazioni: 5

Footprint Chart Visualizer

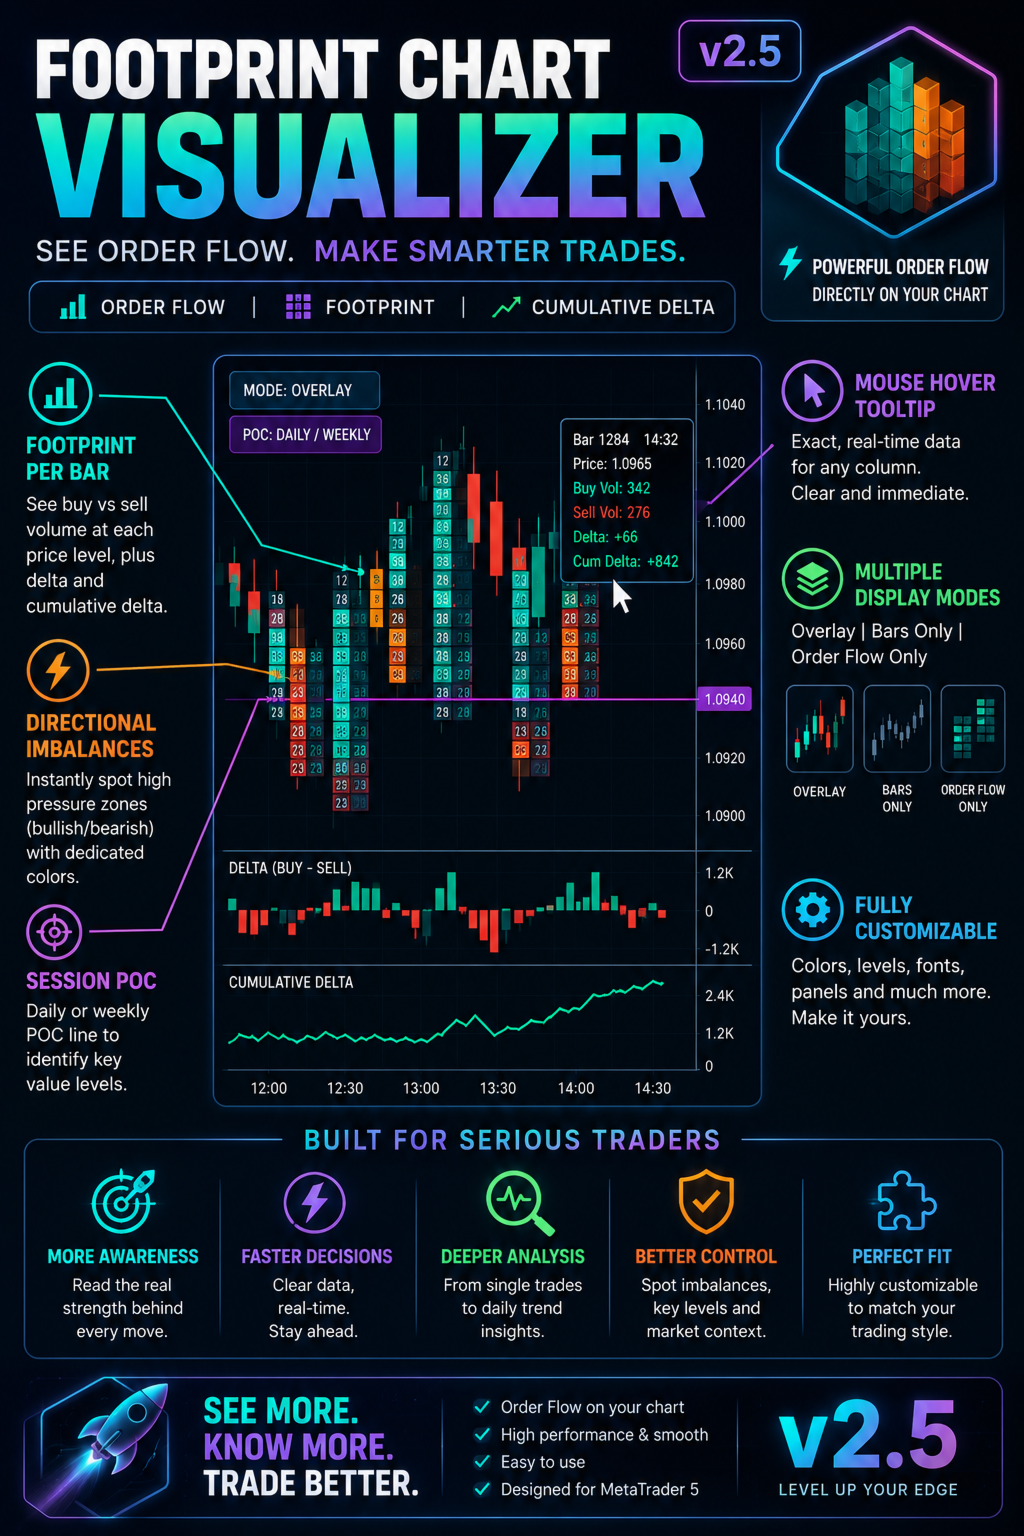
Footprint Chart Visualizer turns your main chart into a professional footprint chart, overlaying buy and sell volume at every price level directly on top of the candles, bar by bar.

Key features

  • Price level footprint: each bar is split into horizontal cells showing buy and sell volume separately, with distinct colors for an instant read of order flow pressure.
  • Delta panel: a delta bar (buy minus sell) for every candle, so you can spot directional imbalance at a glance.
  • Cumulative delta: a running line tracking cumulative delta over time, useful for confirming or contradicting a price trend.
  • Session POC (Point of Control): a horizontal line marking the price level with the highest traded volume in the current session, toggleable between Daily and Weekly with a dedicated one-click button — helps identify the "fair value" area the market keeps rotating around.
  • Directional imbalance detection: automatically highlights aggressive buying (bullish imbalance, turquoise) and aggressive selling (bearish imbalance, orange) between diagonally adjacent price levels when the buy/sell ratio crosses a configurable threshold — giving an immediate, color-coded read of which side is in control at each level.
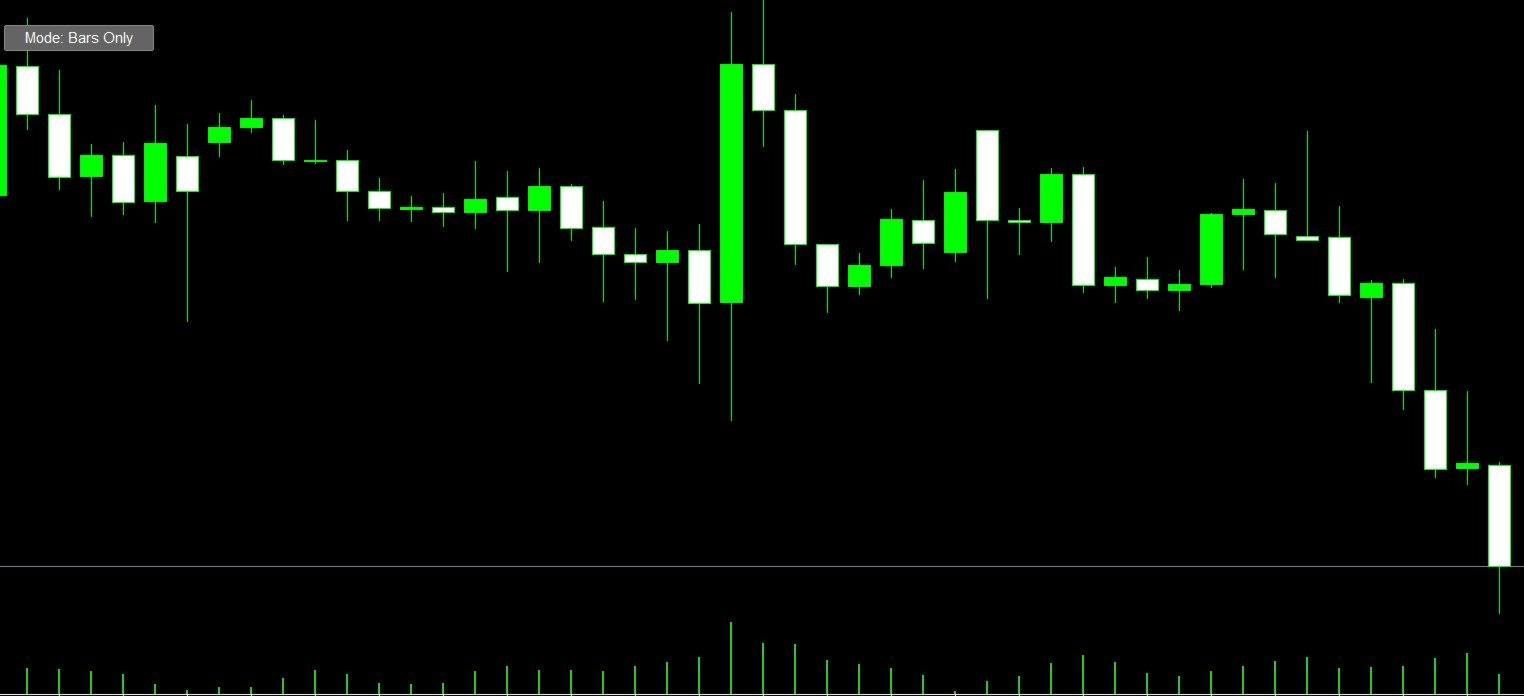
  • Three display modes: Overlay (footprint under the candles), Bars Only (classic candles), and OF Only (footprint only, ideal for pure order flow analysis). Switch modes anytime with a single click on the button in the top left corner.
  • Fully customizable: colors, number of price levels, font size, delta panel height, transparency, and imbalance threshold are all adjustable from the input settings.
  • Lightweight and non-intrusive: updates smoothly on every tick without slowing down the chart.

Works on any symbol and any timeframe. No repaint, no external files required.

Operational tips

Some practical suggestions for real trading use:

  1. Use low timeframes for pure footprint reading: the footprint is most readable on M1-M15. On higher timeframes the cells get too compressed and lose meaning; OF Only on M1/M5 works best for scalping or microstructure reading.
  2. Delta and price should agree: if price rises but cumulative delta falls (or stays flat), that's a divergence signal, often a warning of a reversal or a weakening trend.
  3. Treat imbalance as confirmation, not a standalone signal: the bullish/bearish imbalance cells work best combined with a technical level (support/resistance, VWAP, order block). Used alone they generate too many false signals.
  4. Adjust InpImbalThresh per instrument: a 3.0 ratio is reasonable on major forex pairs, but on less liquid instruments or indices you may need to raise it (4-5) to avoid the indicator flagging imbalance on nearly every bar.
  5. Keep InpBarsToShow low for performance: values between 10 and 20 bars are ideal. With very large datasets, rendering can slow down the chart, especially on M1 with a high InpPriceLevels count.
  6. Overlay for context, OF Only for execution: a typical workflow is keeping Overlay mode for general context (candles + footprint), then switching to OF Only at key moments (level breakout, session open) to read order flow without distraction.
  7. Use POC as a dynamic reference level: price returning to the session POC often reacts (support/resistance behavior). Switching between Daily and Weekly POC helps you see whether the market is respecting a short-term or a longer-term value area — useful when Daily and Weekly POC diverge significantly.
Altri dall’autore
Trend Meter – Your Tool for Identifying Strong and Reliable Trends Trend Meter is an advanced and highly customizable indicator designed to help traders identify the direction and strength of the current trend with greater accuracy, significantly reducing noise and the reliance on single signals. It's the ideal solution for those seeking reliable signals and wanting to trade with more confidence. Key Features: Three Independent Trend Meters : Choose from various trend logic options, such as MACD
Wavetrend for MT5
Antonello Belgrano
5 (1)
Here is a version for MetaTrader 5 of the famous Wave Trend indicator. Introducing the Wave Trend Oscillator Indicator for MT5 We are excited to present our Wave Trend Oscillator Indicator, exclusively designed for MetaTrader 5. This advanced tool is a must-have for traders who seek precision and efficiency in their trading journey. Our oscillator is built on the principles of wave trend analysis, capturing the ebb and flow of market trends with unparalleled accuracy. It helps traders identify p
Self-Learning SBF - Structure Break Forecaster Every time the market breaks a key structural level, Self-Learning SBF asks a simple question: "What happened last time price did this?" Instead of relying on fixed rules, the indicator keeps a live archive of every structure break it observes and how it played out — and it never stops learning. Every new signal is compared against the most similar cases in that archive, turning market history into a probability score and clear, tiered price targets
DiDi and QQE
Antonello Belgrano
DiDi + QQE – Clean Momentum Filter What You See on Chart Gray line → Media (zero reference – normally at 0) Dodger Blue → Curta (fast 3-period offset) OrangeRed → Longa (slow 20-period offset) Lime dotted → QQE bullish zone (QQE > 0) Orange dotted → QQE bearish zone (QQE ≤ 0) Core Idea Didi Index shows momentum bursts when fast line (Curta) rapidly diverges from the medium MA and crosses the slow one → classic “Agulhada / Needle”. QQE trailing line (smoothed + ATR bands) acts as dynamic tre
Traderscope is a powerful and completely free advanced monitoring dashboard for MetaTrader 5, designed to monitor your Expert Advisors' live performance directly on your trading account. It delivers clear, real-time insights into your live trading performance — directly on your chart, with no complexity and zero impact on execution. Key Features Multi Magic Number Aggregation (up to 3) Combine and analyze up to three different magic numbers (e.g., MagicA + MagicB + MagicC) in a single unified v
FREE
This utility allows for fast and flexible execution of market, stop, and limit orders, giving traders full control over their entries. It includes built-in support for setting stop loss, take profit, and trailing stop parameters at the time of order placement, streamlining trade management from the start. The interface also displays key trading data in real time, including spread, live profit/loss, and position metrics, helping traders make informed decisions quickly and efficiently
Risk and Position Size Calculator – Expert Advisor Utility A powerful and easy-to-use EA utility designed to help traders manage risk with precision. It automatically calculates the optimal position size based on your account balance, chosen risk percentage, and stop loss. In addition, it calculates potential profit and displays take profit levels directly on the chart. Fully customizable and compatible with all instruments and timeframes, it's the perfect tool for improving your risk management
Insync Index
Antonello Belgrano
Insync Index Oscillator A powerful and efficient tool for identifying market trends and momentum. The Insync Index Oscillator is designed to provide traders with clear, actionable insights by analyzing price movements and market conditions. With its intuitive design and fast, accurate signals, it helps traders make more informed decisions without the noise. Perfect for both short-term and long-term strategies, the Insync Index Oscillator delivers reliable results for any trading style. Get ahea
MACD with Classic Chart Style For those who want to use the MACD but aren’t a fan of the default indicator’s quirky and sometimes confusing graphic style. This version brings you all the powerful functionality of the MACD, but with a clean, straightforward design that matches the classic style of TradingView and other top platforms. The histogram bars, MACD line, and signal line are displayed clearly and simply, giving you an intuitive and distraction-free view. Perfect for anyone who values ef
Advanced ARFIMA Predictor Advanced ARFIMA Predictor is a predictive trading indicator built on the ARFIMA (AutoRegressive Fractionally Integrated Moving Average) model, designed to capture the structural memory embedded in financial markets and translate it into actionable Buy and Sell signals. Unlike traditional short-memory models, ARFIMA incorporates fractional integration to detect long-memory dynamics and persistent price behavior. This enables the indicator to anticipate regime shifts and
PortfolioLab Pro
Antonello Belgrano
Gestire più Expert Advisor su un singolo account MT5 è più difficile di quanto sembri. Ogni EA funziona bene singolarmente — ma insieme possono concentrare il rischio in modo silenzioso, correlarsi durante i drawdown e comportarsi in modo molto diverso da quanto suggerito dai singoli backtest. PortfolioLab Pro ti offre una visione analitica completa del tuo portafoglio, direttamente all’interno di MetaTrader 5. Nessuno strumento esterno, nessuna esportazione, nessun calcolo manuale. Tutto si ag
Efficient Market Profile Professional Market Profile analysis directly on your MetaTrader 5 charts. Efficient Market Profile allows traders to visualize market structure, fair value zones, and institutional price levels using the powerful Market Profile methodology . The indicator automatically builds TPO-based profiles for each trading session , helping you quickly identify where the market spent the most time and where important price levels are forming. All elements adjust dynamically to your
Professional VWAP
Antonello Belgrano
Professional VWAP + Deviation Bands Professional VWAP is a high-precision Volume Weighted Average Price indicator built for serious traders on MetaTrader 5. It delivers clean, reliable VWAP calculation with flexible session resets and professional deviation bands to highlight value areas, momentum shifts, and high-probability mean-reversion zones. Key Features: Accurate VWAP calculation based on typical price (HLC/3) weighted by volume Three reset options: Daily (intraday standard), Weekly , or
Lunar Phase Suite
Antonello Belgrano
Lunar Phase Suite – Moon Cycles & Moon Phases for MetaTrader 5 Lunar Phase Suite brings astronomy and astrology into MetaTrader 5 through a detailed visual panel and a dedicated sub-window. The current moon phase, illumination percentage and moon cycle age are updated every minute. All 8 moon phases are displayed with individual mini-moons, with the active phase highlighted automatically. ILLUM — Illumination curve with New Moon, Full Moon and Quarter markers plotted on the sub-window. DECL — No
RSI Currency Strength Meter is a powerful and elegant multi-currency indicator that measures the real-time relative strength of the 8 major currencies using RSI logic. By calculating the smoothed performance of each currency across its major pairs and applying the RSI formula, it delivers clean and responsive strength lines that make it easy to spot which currencies are truly strong or weak at any moment. This indicator is particularly useful for visualizing currency correlations and divergence
TrendScore – Chande Trend Score TrendScore is a faithful and enhanced implementation of the classic indicator originally developed by Tushar Chande, one of the pioneers of quantitative technical analysis. Preserving the core mathematical logic of Chande’s original concept, this version introduces several practical improvements that significantly increase usability and visual clarity without altering the indicator’s integrity. At its heart, TrendScore measures directional persistence by comparing
Planetary Declination Panel for MetaTrader 5 Discover the most advanced and accurate astrological indicator for MetaTrader 5 — Planetary Declination Panel. Built on precise mathematical algorithms, it calculates real-time celestial declinations of the Sun, Moon, Mercury, Venus, Mars, Jupiter, Saturn, Chiron, and Ceres with professional-grade precision. In a clean dedicated sub-window, elegant and highly visible colored lines plot the declination movements across any timeframe, allowing you to vi
SMC Advanced Indicator A powerful and clean Smart Money Concepts (SMC) indicator for MetaTrader 5. What is Smart Money Concepts (SMC)? Smart Money Concepts is an institutional trading methodology that focuses on how large banks, hedge funds, and "Smart Money" move and manipulate the market. It analyzes market structure, liquidity zones, order flow imbalances, and key institutional price levels. Key Features Market Structure Analysis Internal Structure and Swing Structure with automatic BOS (Bre
Monte Carlo Forecast Ensemble The market doesn’t move in straight lines. It moves in distributions. Monte Carlo Forecast Ensemble brings an advanced probabilistic view to your chart. Instead of telling you where the price will go, it shows you where it is most likely to go, powered by thousands of Monte Carlo simulations running in real time. What It Shows At every update, the indicator runs thousands of Monte Carlo simulations projected forward for a customizable number of bars. The result is n
Harmonic Oracle – Advanced Harmonic Pattern Indicator Automatically detects and draws high-probability harmonic patterns: Gartley, Bat, Butterfly, Crab, Deep Crab, Shark, Cypher, and AB=CD. Features: Clear XABCD pattern visualization with labels Potential Reversal Zone (PRZ) displayed Suggested Entry, Stop Loss and Take Profit levels Real-time alerts on new patterns Clean and lightweight performance Perfect for traders who use harmonic patterns for precise reversal entries.
Advanced RSI – Regular & Hidden Divergences + Bollinger Bands + Adaptive Levels Powerful and clean RSI indicator that combines multiple advanced features in one window. Main Features: Automatic Regular and Hidden Divergences with 1-10 strength score Bollinger Bands calculated directly on the RSI Adaptive dynamic overbought/oversold levels (or fixed) Fully modular – enable/disable any feature independently Clear visualization with distinct arrows for regular and hidden divergences. No repainting
Backtest What-If Simulator Stop guessing, start testing. This offline What-If simulator lets you load one or multiple MT5 backtest HTML reports and instantly explore thousands of realistic "what if" scenarios, without running a single new backtest. Key Features Load & combine reports - import single backtests or merge multiple backtest HTML files into groups or full portfolios, and switch between them with one click Real-time What-If adjustments Lot Size Multiplier (0.1x – 5.0x) Extra Spread (in
Quant Multi Divergence Indicator A comprehensive multi-indicator divergence detection system that combines 7 indicators into a single consensus framework. The indicator identifies divergences across all selected components and calculates a Consensus Score ranging from -100 to +100, providing a clear and objective measure of signal strength. It also incorporates price swing analysis for enhanced accuracy. Main Features: Simultaneous divergence analysis across 9 components Consensus Score plotted
Dynamic Heatmap Bookmap Style An indicator for MetaTrader 5 that brings Bookmap-style heatmap visualization directly onto your chart, showing where the market has actually concentrated volume and price activity — not just where price has passed through. What it does The indicator overlays a real-time heatmap on the chart, highlighting the price zones with the highest activity for the current week using a dynamic color gradient — from cold blue for low-activity zones to hot red for the most activ
Advanced Indicators Manager Tired of manually removing and re-adding indicators every time you want to switch between setups or get a clean chart? With this tool you turn them on and off with a single click, no digging through menus, no lost time. Advanced Indicators Manager automatically scans your chart and detects every indicator currently applied (main window and sub-windows), creating a small button panel with one button per indicator. You can add as many indicators as you want to your cha
Momentum Alchemist
Antonello Belgrano
Momentum Alchemist — Dual-Engine Confluence Indicator Two independent detection systems. One confirmed signal. Momentum Alchemist fuses two complementary engines into a single, non-repainting confluence tool for MetaTrader 5: Force Trend System — a pressure/trend-state engine built on a volume-weighted moving structure and an ATR-based Supertrend filter. It reacts fast to shifts in buying and selling pressure. Pattern Recognition Engine — a historical pattern-matching module that scans thousands
Engulfing Confluence Scanner Engulfing Confluence Scanner was built to solve a simple problem: on its own, the Engulfing pattern throws off too many false signals. The indicator takes that pattern and puts it to the test by cross-checking it against the direction of a trend moving average (configurable across ten variants, from SMA to Hull) and against MACD direction. Only when these three readings line up does the Engulfing candle get highlighted and trigger an alert. On top of that sits the Re
Harmonic Hunter
Antonello Belgrano
Harmonic Hunter - Automatic Harmonic Pattern Scanner (Gartley, Bat, Butterfly, Crab, Shark, Cypher) Harmonic Hunter scans price action for X-A-B-C-D swing structures and automatically plots the six most-traded harmonic patterns the moment their Fibonacci ratios align. No manual pivot-hunting required. What it does: Detects swing pivots with a configurable ZigZag algorithm (adjustable depth) Validates each XABCD sequence against the precise ratio rules for Gartley, Bat, Butterfly, Crab, Shark, a
Supply Demand Liquidity Confluence (SDLC) A single lightweight overlay that combines two proven zone concepts into one engine: momentum-based Supply/Demand zones and pivot-based Liquidity (Support/Resistance) zones, with optional multi-timeframe confluence. What it does Supply/Demand zones : flags the origin candle of a strong directional move. A move only qualifies if N consecutive candles push the same direction with an ATR-normalized slope above your angle threshold, so slow grinding trends d
Filtro:
Nessuna recensione
Rispondi alla recensione