High Probability Breakout Trades
- 지표
- 버전: 3.0
- 업데이트됨: 28 8월 2026
- 활성화: 20

High Probability Breakout Trades Indicator - Overview
The Core Philosophy
This isn't just another breakout scanner - it's a multi-dimensional confluence engine that combines rare candle patterns with institutional-level volume profiles and statistical edge calculations. The holy grail here is waiting for EVERY signal to align before pulling the trigger.
---
The 4-Candle Harami Breakout Pattern - Your Primary Entry Trigger
Why This Pattern Matters
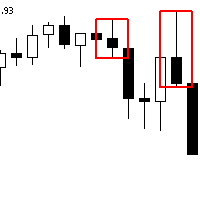
The strict 4-candle Harami breakout is a high-probability reversal/continuation pattern that captures exhaustion and breakout dynamics in a single setup. Candle 1 sets the battlefield with a strong directional move. Candles 2 and 3 show complete consolidation inside Candle 1's range - the market is coiling energy. Candle 4 delivers the explosive breakout, the release of all that pent-up energy.
The Edge
Unlike standard breakouts that often fake out, this pattern forces two full candles of consolidation within the initial range. This means whipsaws are filtered because the market had time to reverse but didn't. Real momentum exists because the break requires genuine conviction. And natural stop-loss levels exist at the opposite side of Candle 1, giving you built-in risk management.
---
The Semafor / ZigZag Confluence Filter - Your Confidence Multiplier
What It Does
The three-level ZigZag Semafor labels major and minor swing points as L1, L2, and L3. When your Harami breakout pattern's first candle coincides with a Semafor level, you've found something special. L1 represents minor pivots and immediate support/resistance. L2 marks intermediate pivots with stronger significance. L3 identifies major pivots at institutional-level support and resistance zones.
The Secret Sauce
ONLY take signals tagged with L2 or L3. These represent real institutional interest zones. L2 signals have a higher probability range of 60-70%, while L3 signals are your premium tier at 70-80%+ success rate. Never take a pattern that doesn't tag a Semafor level - those are just noise.
---
Daily Volume Profile - The Institutional Footprint
Understanding the Three Lines
The Point of Control represents the price level with the highest trading volume - the market's fair value. The Value Area High is the upper bound of the value area where 70% of trading occurred. The Value Area Low is the lower bound of that same value area.
How to Use This
When your breakout pattern appears, price location tells you everything. A break above VAH signals momentum pushing above fair value - that's your BUY opportunity. A break below VAL signals momentum pushing below fair value - that's your SELL opportunity. If the break occurs inside VAH and VAL, skip it entirely - you're still trading in fair value, it's too early. The ultimate setup is when the breakout fires FROM the POC level, breaking through VAH on the upside or VAL on the downside with Semafor L2 or L3 confluence. That's your grand slam.
---
Daily Bias Composite - Your Trade Direction Filter
How It Works
The Daily Bias aggregates four indicators on the D1 timeframe. The 20-period EMA tells you trend direction. The 14-period RSI reveals momentum bias. The MACD shows trend momentum. And the ADX plus DI components identify trend strength and direction.
Scoring System
When you have 2 or more bullish points, the bias says BUY ONLY. When you have 2 or more bearish points, the bias says SELL ONLY. When the signals are mixed, you have NO CLEAR BIAS and you stay flat.
The Rule
Never trade against the Daily Bias. If bias says BUY ONLY, only take BUY signals. If bias says SELL ONLY, only take SELL signals. If mixed, skip everything and wait for clarity. This one rule alone will double your win rate.
---
Breakout Probability - Your Edge Quantifier
What It's Calculating
This tracks historical breakout success rates for each percentage level above and below the previous candle. It answers the critical question: based on this candle's color and the last 500 bars, what's the probability price will reach X percent beyond this candle's range?
Practical Application
Levels with 0% hit rate automatically hide themselves - ignore them completely. Levels showing 40-60% hit rates become your standard profit targets. Levels showing 60-80% hit rates are where you secure partial profits. And levels showing 80%+ hit rates are where you hold for full target.
The Win/Loss Panel
This panel tracks your historical win rate from this exact pattern across every trade you've taken. If your cumulative win rate is above 60%, your system is validated and working. If it drops below 50%, it's time to tighten your filters. This is a self-learning system - you see REAL performance data, not backtested fantasy.
---
The Dashboard - Your Multi-Timeframe Command Center
What It Shows
The dashboard displays the symbol, timeframe, signal direction, exact entry price, stop-loss level, take-profit level, and the Semafor level tagged. One click scans every Market Watch symbol across all enabled timeframes from M5 through D1.
Scanning Power
This gives you complete market awareness, opportunity detection across multiple assets, and comparative strength analysis all in one place. Click any dashboard row to instantly open that pair's chart, auto-attach this indicator, and draw the exact pattern highlight with Entry, SL, and TP boxes already marked. This turns your dashboard into a trading execution cockpit.
---
A+ Trade Setup - The Complete Checklist
Pre-Scan Daily Conditions
Your Daily Bias must show clear direction - BUY ONLY or SELL ONLY. The Volume Profile must be visible with clear VAH and VAL levels. And the Semafor levels must be populated on the chart.
Entry Qualification From Scan Results
First, the 4-candle Harami breakout pattern must be found. Second, the Semafor tag must be L2 or L3 - never L1 alone. Third, the breakout direction must match the Daily Bias - always filter out counter-trend signals. Fourth, the breakout level must be at or beyond VAH for buys or at or below VAL for sells. Fifth, the Breakout Probability must show over 60% on Level 1.
Execution Rules
Enter exactly at C1's high plus one pip for buys or C1's low minus one pip for sells. Place your stop loss at the opposite side of C1's range minus one pip. Take profit one at 1.5 times risk where you close 50% of your position. Take profit two at 2.5 times risk where you close 30%. Hold the remaining 20% to the Breakout Probability targets.
Risk Management
Risk 1-2% of your account per trade. If you have multiple signals in the same direction, take the one with the strongest confluence. And when your profit reaches 2% of your account in a single day, stop trading completely.
---
Pro Trading Psychology
The 5-Minute Rule
After scanning and finding signals, wait 5 minutes before placing any orders. Check price action at the entry level. Ensure no major news events are scheduled in the next hour.
The 3-Strike Rule
If you have 3 consecutive losses, stop trading for the day. Review if you violated any of the rules above. Verify the market isn't in a news-driven environment.
The Validation Mindset
Profitable trades mean the system is working. Losing trades mean either the market environment changed or you filtered incorrectly.
---
The Final Edge
This indicator isn't just finding breakouts - it's finding the right breakouts. The 4-candle pattern removes over 80% of false breakouts. The Semafor L2 and L3 filters capture institutional levels. The Volume Profile confirms fair value breakout. The Daily Bias filters out counter-trend noise. And the Probability Metrics quantify your edge in real-time.
Each filter removes 60-80% of false signals. Multiplied together, you're trading only the top 1-3% of potential setups that pass every single test.
---
Recommended Daily Workflow
Morning Routine - 5 Minutes
Open the indicator on your primary chart, click SCAN MARKET, review the dashboard, and note any L2 or L3 signals matching the Daily Bias.
Pre-Trade Validation - 2 Minutes
Open each signal's chart, verify Volume Profile alignment, check the Breakout Probability panel, and validate the pattern visually.
Execution - 1 Minute
Place your limit order at the entry price, set your SL and TP as calculated, and set alerts for fill and SL and TP levels.
Management
Move your SL to breakeven when 1.5 times risk is hit. Trail your stop with the red Entry to SL box as your dynamic guide. Take profit according to the TP1, TP2, and TP3 plan.
---
This is your trading edge. Respect the confluence. Trade only A+ setups. The numbers will follow.