Gold MTF
- インディケータ
-
Paolo Ruffini
 私は、外国為替市場および商品市場において15年以上の実務経験を持つトレーダーです。特に、流動性のダイナミクス、出来高による市場圧力、そして価格の方向性構造の分析に重点を置いています。
長年にわたり、裁量的な分析と独自の定量的ツールを段階的に統合し、市場の実質的な参加度を測定することを目的とした指標を開発してきました。
現在は、LMPX – Liquidity Momentum Pulse シリーズの開発に注力しています。これは、正規化された出来高と価格の加速度との関係を分析するために設計された指標群です。
開発哲学 - バージョン: 1.10
- アップデート済み: 16 8月 2026
Gold MTF Market Dashboard
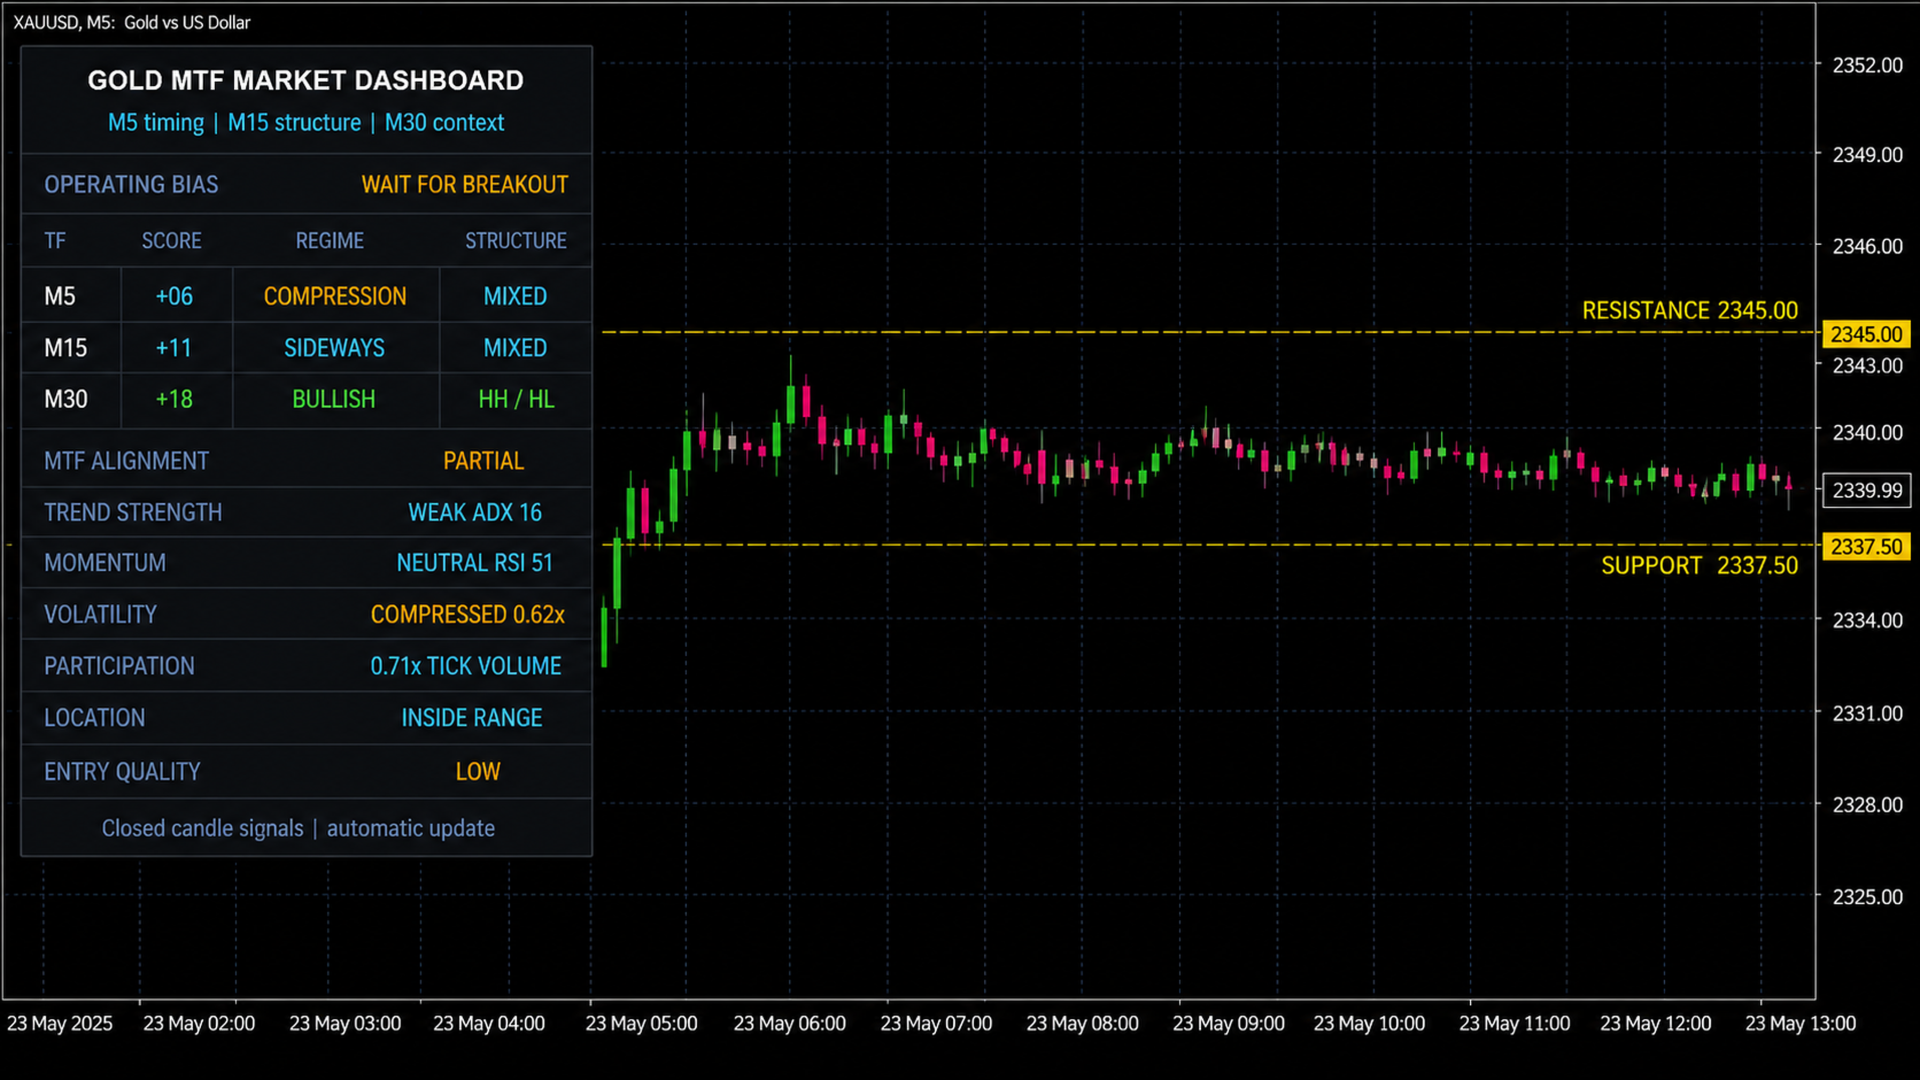
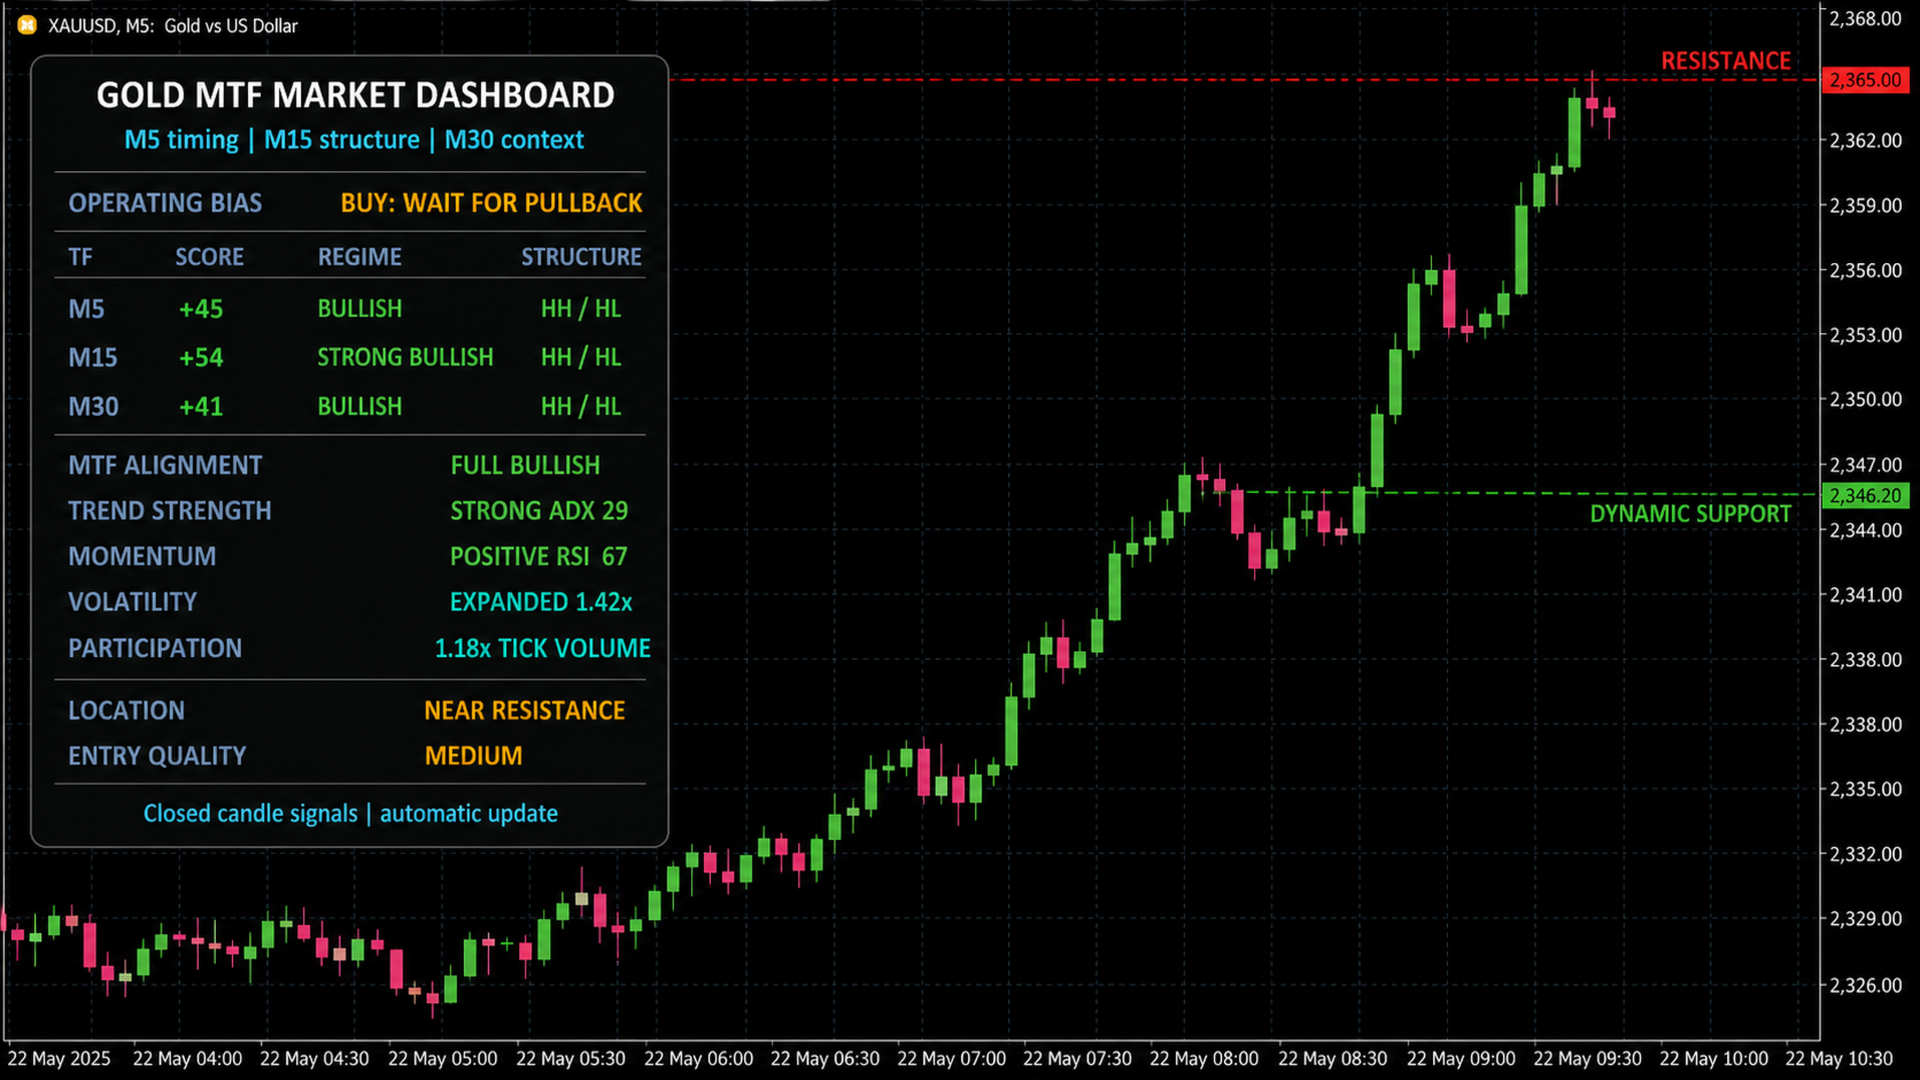
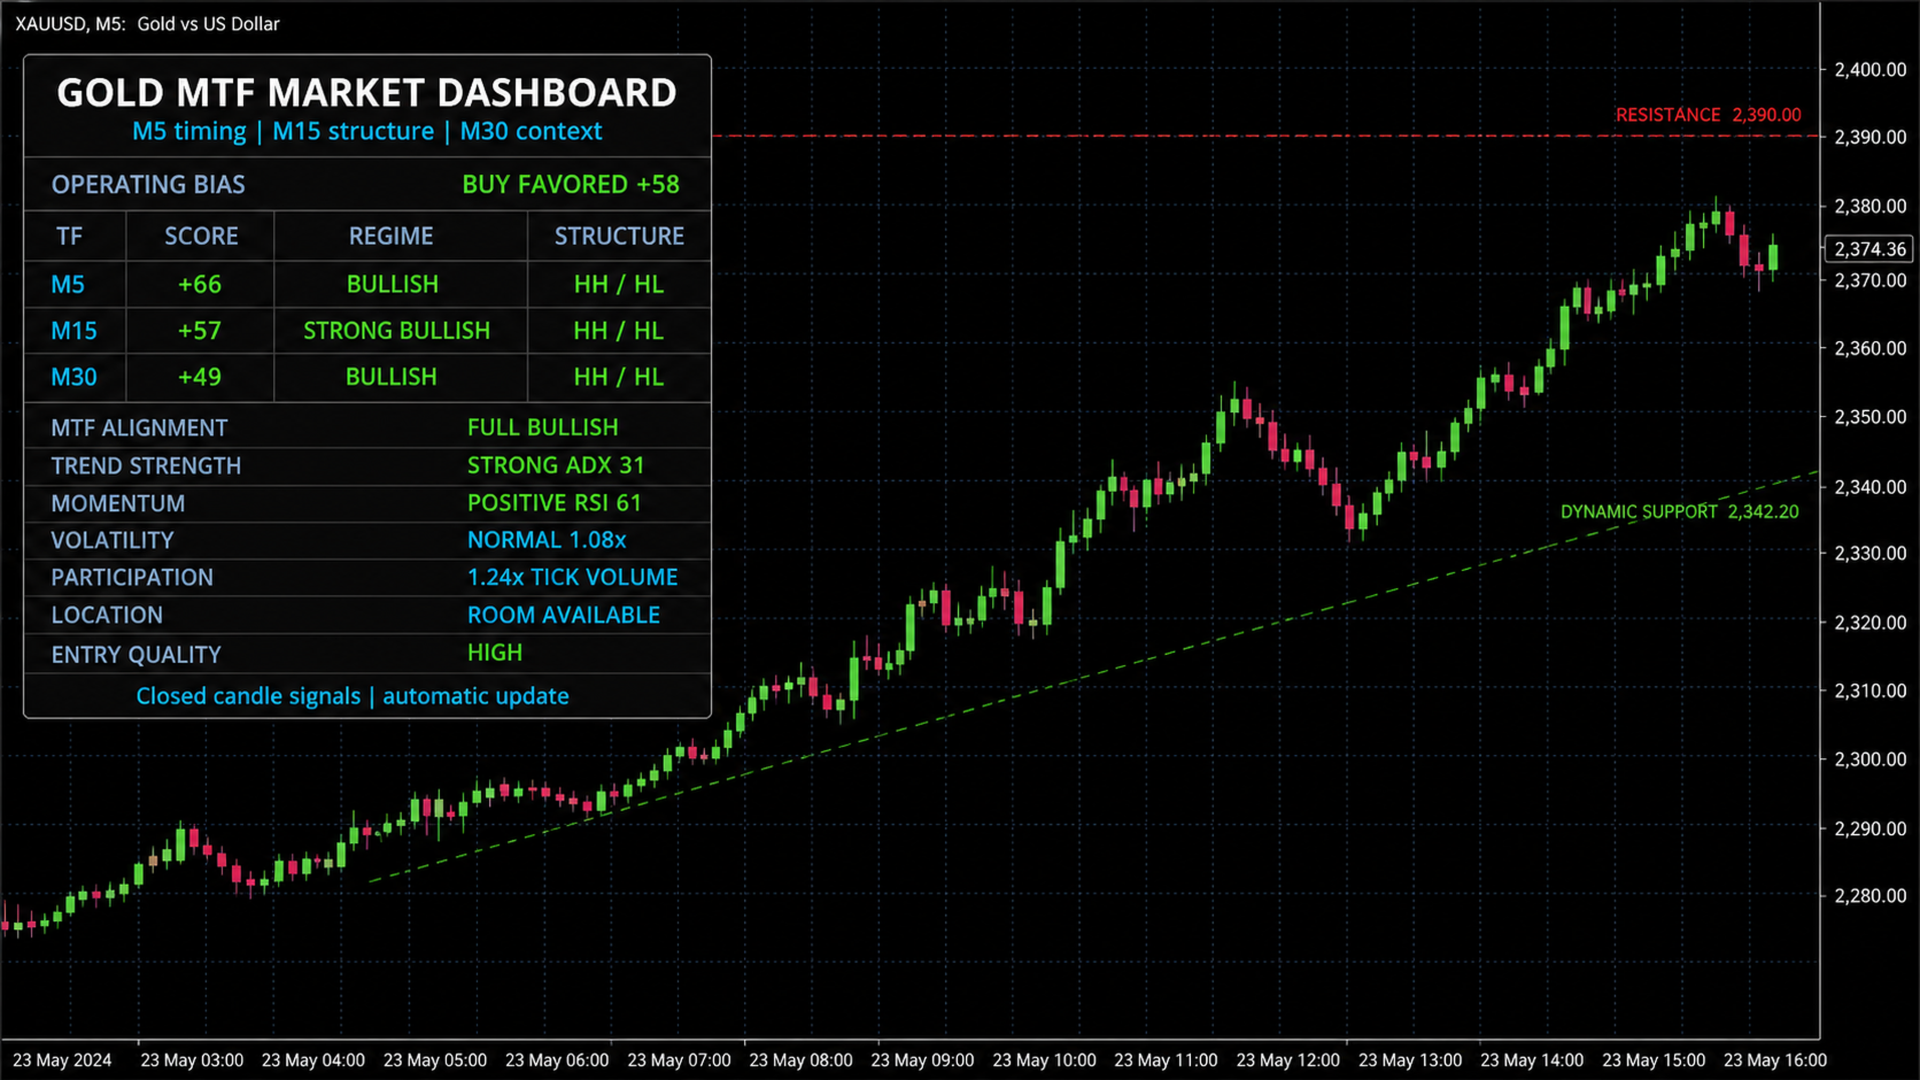
Gold MTF Market Dashboard is a multi-timeframe analytical indicator designed primarily for Gold trading on the M5 chart.
The indicator compares M5, M15 and M30 market conditions in a single compact dashboard:
-
M30 provides the broader market context.
-
M15 evaluates structure and direction.
-
M5 provides short-term timing information.
Main features
-
Multi-timeframe trend analysis
-
M5, M15 and M30 directional scores
-
Bullish HH/HL and bearish LH/LL market structure
-
EMA trend and slope analysis
-
ADX and directional movement analysis
-
RSI momentum evaluation
-
ATR and Bollinger Band volatility analysis
-
Compression and expansion detection
-
Tick volume participation
-
Dynamic M15 support and resistance levels
-
Distance evaluation from relevant price levels
-
Entry quality classification
-
Closed-candle calculation option
Dashboard states
The dashboard can display the following market conditions:
-
Buy Favored
-
Sell Favored
-
Moderate Buy
-
Moderate Sell
-
Wait for Pullback
-
Wait for Breakout
-
Multi-Timeframe Conflict
-
Neutral
Color interpretation
-
Green: bullish condition
-
Red: bearish condition
-
Orange: consolidation, compression, conflict or waiting condition
-
Blue: neutral contextual information
Important information
The indicator does not open, modify or close trades. It is an analytical tool and does not guarantee future market direction or trading results.
The default settings use closed candles to reduce intrabar signal changes. Users should test the indicator on a demo account before using it as part of a trading process.