STA Market Compass

  • 지표
  • Tang Wai Ho
    Tang Wai Ho
    I am Michael Tang, a trader, trading educator, and founder of Secret Trader Asia.
    I have been involved in the financial markets since 2015, with a strong focus on price action, market structure, risk management, trading indicators, and automated trading systems.
  • 버전: 1.10
  • 활성화: 5

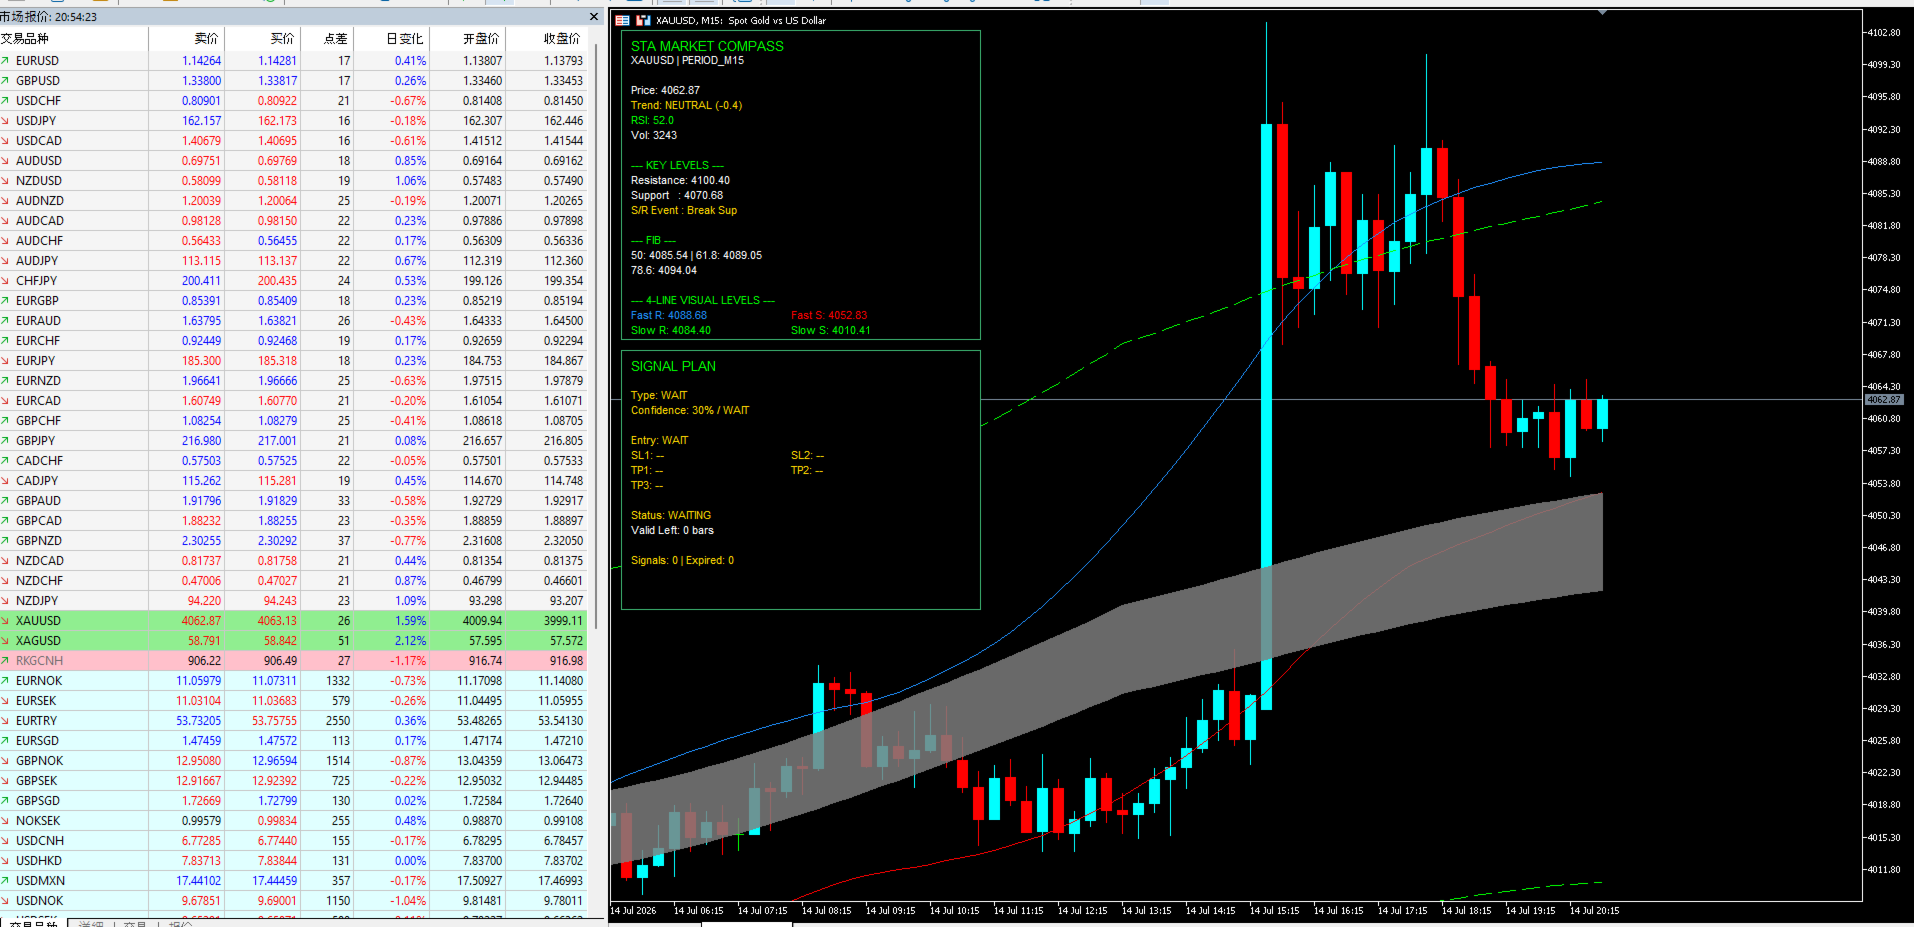
STA Market Compass is a hybrid MetaTrader 5 indicator that converts trend, market structure, momentum and key price levels into a clear manual trading plan.

OVERVIEW

STA Market Compass is designed for traders who want to understand the current market condition without using multiple indicators on the same chart.

The indicator combines:

• Trend direction
• Recent swing structure
• Support and resistance zones
• Fibonacci retracement levels
• RSI momentum
• Candlestick confirmation
• Optional tick-volume confirmation
• ATR-based entry and protection zones

The result is displayed through two responsive dashboards:

• Market Analysis Dashboard
• Signal Plan Dashboard

The indicator does not open, modify or close trades. All trading decisions and order execution remain under the user’s control.

KEY FEATURES

  1. Clear BUY, SELL or WAIT Decision

The indicator evaluates several market conditions and displays:

• BUY
• SELL
• WAIT

A signal is only generated when the calculated confidence reaches the selected minimum threshold.

When market conditions are unclear, the indicator remains in WAIT mode instead of forcing a trading signal.

  1. Confidence Score from 0% to 100%

Each potential signal receives a confidence score based on:

• Overall trend direction
• Price position near support or resistance
• Fibonacci retracement location
• RSI momentum
• Bullish or bearish candle confirmation
• Tick-volume activity

The dashboard classifies the result as:

• HIGH
• VALID
• WEAK
• WAIT

The minimum confidence level can be adjusted by the user.

  1. Complete Signal Plan

Every active signal includes:

• Entry price
• Stop Loss 1
• Stop Loss 2
• Take Profit 1
• Take Profit 2
• Take Profit 3
• Confidence percentage
• Signal status
• Remaining valid bars

The three profit targets are calculated from the selected risk-to-reward ratios.

  1. Hybrid Trend Analysis

The trend engine combines:

• Fast EMA
• Slow EMA
• RSI direction
• Current price position
• Recent swing high
• Recent swing low

The market is classified as:

• BULLISH
• BEARISH
• NEUTRAL

A BUY signal requires a bullish market condition. A SELL signal requires a bearish market condition.

  1. Automatic Support and Resistance Detection

The indicator detects recent swing highs and swing lows to calculate:

• Current resistance
• Current support
• Support zone
• Resistance zone
• Support or resistance break events

These levels are also used when calculating the signal plan.

  1. Fibonacci Retracement Analysis

The dashboard displays the main Fibonacci retracement levels calculated from the detected market structure:

• 0.0%
• 23.6%
• 38.2%
• 50.0%
• 61.8%
• 78.6%

Price reactions near the 50.0%, 61.8% and 78.6% levels can contribute to the confidence score.

  1. Dual Signal Modes

Realtime Mode

When ConfirmedMode is disabled, the indicator evaluates the current candle. This provides faster signals, but the signal conditions may change before the candle closes.

Confirmed Mode

When ConfirmedMode is enabled, the indicator evaluates the previous closed candle. This provides more stable confirmation but may produce signals later.

  1. Two Entry Methods

Close Price Entry

The entry price is based on the closing price of the evaluated candle.

Zone Price Entry

The entry price is placed near the calculated support zone for BUY signals or resistance zone for SELL signals.

  1. Two Stop Loss Levels

SL1 is the primary protection level calculated outside the current support or resistance zone.

SL2 is a wider secondary protection reference calculated from the main swing structure.

These levels are provided for planning purposes. The indicator does not automatically place orders.

  1. Three Adjustable Profit Targets

TP1, TP2 and TP3 are calculated using adjustable risk-to-reward ratios.

Default settings:

• TP1: 1.0R
• TP2: 1.5R
• TP3: 2.0R

Users can adjust each target independently.

  1. SecretTrader Four-Line Market Reference

The indicator includes a separate four-line visual system:

• Fast Lower Support
• Fast Upper Resistance
• Slow Upper Resistance
• Slow Lower Support
• Gray Balance Zone

The fast channel is designed to show shorter-term price boundaries.

The slow channel displays wider market boundaries.

The gray belt represents the central balance area between the smoothed slow high and low values.

Important: The four-line system is a visual market reference only. It is not used to generate BUY or SELL signals.

  1. Responsive Dashboard

The dashboard can automatically adapt to different chart sizes.

Available layouts:

• Automatic
• Two Panel
• Stacked
• Compact

Users can also manually adjust:

• Dashboard position
• Dashboard corner
• Panel width and height
• Font size
• Line spacing
• Column spacing
• Background color
• Border color
• Text color

  1. Market Analysis Dashboard

The Market Analysis Dashboard displays:

• Symbol and timeframe
• Current price
• Market trend
• Trend score
• RSI value
• Current tick volume
• Volume condition
• Resistance level
• Support level
• Support or resistance break event
• Fibonacci levels
• Fast channel values
• Slow channel values
• Gray balance-zone values

  1. Signal Plan Dashboard

The Signal Plan Dashboard displays:

• BUY, SELL or WAIT
• Confidence score
• Signal quality
• Entry price
• SL1
• SL2
• TP1
• TP2
• TP3
• Current signal status
• Remaining valid bars
• Total number of signals
• Number of expired signals

Possible signal statuses include:

• WAITING
• ACTIVE SIGNAL
• TP1 HIT
• TP2 HIT
• TP3 HIT
• SL1 HIT
• SL2 HIT
• EXPIRED

  1. Multiple Alert Options

The indicator supports:

• MetaTrader popup alerts
• Mobile push notifications
• Email alerts
• One alert per signal option

Each alert can include:

• Symbol
• Timeframe
• Signal direction
• Entry price
• SL1 and SL2
• TP1, TP2 and TP3
• Confidence score

Push notifications and email alerts must first be configured correctly in the MetaTrader 5 terminal.

  1. Clean Chart Design

The indicator does not use trade arrows.

Market information, signal levels and signal status are displayed inside the dashboards, while the optional four-line system provides a clean visual reference directly on the chart.

SUPPORTED MARKETS AND TIMEFRAMES

STA Market Compass operates on the symbol and timeframe of the current MetaTrader 5 chart.

It can be attached to Forex, metals, indices, cryptocurrencies and other instruments provided by the broker.

Market behaviour, volatility, tick volume and price structure differ between instruments. Users should test the settings on each preferred symbol and timeframe before using the indicator for live trading decisions.

BASIC SETUP

  1. Attach STA Market Compass to an MT5 chart.

  2. Select Realtime Mode or Confirmed Mode.

  3. Set the required minimum confidence level.

  4. Choose Close Price Entry or Zone Price Entry.

  5. Adjust the risk-to-reward ratios when required.

  6. Enable the preferred dashboard and visual channels.

  7. Configure popup, mobile or email alerts.

  8. Wait for the Signal Plan Dashboard to display an active BUY or SELL signal.

INPUT PARAMETERS

FOUR-LINE VISUAL SETTINGS

FastN — Default: 25

First smoothing period used to calculate the fast channel.

FastN1 — Default: 25

Second smoothing period applied to the fast channel.

SlowN — Default: 61

First smoothing period used to calculate the slow channel and gray balance zone.

SlowN1 — Default: 61

Second smoothing period applied to the slow channel.

SlowMultiplier — Default: 3.0

Controls how far the slow outer support and resistance lines are expanded from the gray balance zone.

ShowFastChannel — Default: true

Shows or hides the fast support and resistance lines.

ShowSlowChannel — Default: true

Shows or hides the slow support and resistance lines.

ShowGrayBelt — Default: true

Shows or hides the gray balance zone.

HistoryBars — Default: 250

Number of historical bars used to display the four-line visual system.

FastShift — Default: 0

Applies a data shift to the fast channel.

SlowShift — Default: 0

Applies a data shift to the slow channel.

GENERAL STRATEGY SETTINGS

LookbackBars — Default: 500

Number of recent bars loaded for market analysis and signal calculations.

ShowDashboard — Default: true

Shows or hides the Market Analysis and Signal Plan dashboards.

EnableAlerts — Default: true

Master control for all signal alerts.

SIGNAL SETTINGS

ConfirmedMode — Default: false

False evaluates the current candle for faster realtime signals.

True evaluates the previous closed candle for confirmed signals.

ValidBars — Default: 16

Number of chart bars for which a signal remains valid.

MinConfidence — Default: 60.0

Minimum confidence score required to generate a BUY or SELL signal. Accepted range is from 0 to 100.

TREND AND MOMENTUM SETTINGS

FastEMA — Default: 50

Period of the fast Exponential Moving Average used by the trend engine.

SlowEMA — Default: 200

Period of the slow Exponential Moving Average used by the trend engine.

RSIPeriod — Default: 14

Period of the Relative Strength Index used for momentum analysis.

MARKET STRUCTURE SETTINGS

SwingDepth — Default: 3

Number of bars required on each side when confirming a swing high or swing low.

A higher value identifies stronger but less frequent swing points.

SwingLookback — Default: 50

Number of recent bars searched when detecting support and resistance swing levels.

ATR AND PRICE-ZONE SETTINGS

ATRPeriod — Default: 14

Period of the Average True Range used to calculate price zones and protection levels.

ZoneATRMultiplier — Default: 0.30

Controls the width of support, resistance and Fibonacci tolerance zones.

SL_Buffer_ATR — Default: 0.20

Additional ATR buffer placed outside the support or resistance zone when calculating SL1.

SL2_ATR_Multiplier — Default: 1.00

ATR distance used to calculate the wider SL2 level from the main swing structure.

TAKE-PROFIT SETTINGS

TP1_RR — Default: 1.0

Risk-to-reward multiplier used to calculate Take Profit 1.

TP2_RR — Default: 1.5

Risk-to-reward multiplier used to calculate Take Profit 2.

TP3_RR — Default: 2.0

Risk-to-reward multiplier used to calculate Take Profit 3.

VOLUME SETTINGS

VolumeMAPeriod — Default: 20

Number of bars used to calculate average tick volume.

UseVolumeFilter — Default: true

When enabled, above-average tick volume can add to the confidence score.

When disabled, volume does not contribute additional confidence points.

ENTRY SETTINGS

EntryMode — Default: ENTRY_CLOSE_PRICE

ENTRY_CLOSE_PRICE uses the closing price of the evaluated candle.

ENTRY_ZONE_PRICE uses the calculated support-zone boundary for BUY signals or resistance-zone boundary for SELL signals.

COLOR SETTINGS

BuyColor — Default: Lime

Color used for bullish information and BUY signals.

SellColor — Default: Tomato

Color used for bearish information and SELL signals.

NeutralColor — Default: Gold

Color used for neutral information, waiting conditions and general references.

DashboardBgColor — Default: Black

Background color of both dashboards.

DashboardBorderColor — Default: Medium Sea Green

Border color of both dashboards.

DashboardTextColor — Default: White

Main text color used inside the dashboards.

RESPONSIVE DASHBOARD SETTINGS

DashboardLayout — Default: DASH_AUTO

DASH_AUTO automatically selects a layout based on chart width.

DASH_TWO_PANEL displays the Market and Signal dashboards as two separate panels.

DASH_STACKED places the Signal dashboard below the Market dashboard.

DASH_COMPACT uses a smaller layout for narrow chart windows.

AutoScaleDashboard — Default: true

Automatically adjusts dashboard font size according to chart width.

SmallScreenWidth — Default: 900

Chart-width threshold used to activate the Compact layout in Automatic mode.

MediumScreenWidth — Default: 1300

Chart-width threshold used to select between Stacked and Two Panel layouts in Automatic mode.

MinFontSize — Default: 7

Minimum font size used by automatic dashboard scaling.

MaxFontSize — Default: 10

Maximum font size used by automatic dashboard scaling.

MARKET DASHBOARD POSITION

MarketDashCorner — Default: 0

Chart corner used for the Market Analysis Dashboard.

Corner values:

• 0: Upper left
• 1: Upper right
• 2: Lower left
• 3: Lower right

MarketDashX — Default: 10

Horizontal distance of the Market Dashboard from the selected corner.

MarketDashY — Default: 20

Vertical distance of the Market Dashboard from the selected corner.

MarketDashWidth — Default: 360

Width of the Market Analysis Dashboard in pixels.

MarketDashHeight — Default: 330

Height of the Market Analysis Dashboard in pixels.

SIGNAL DASHBOARD POSITION

SignalDashCorner — Default: 1

Chart corner used for the Signal Plan Dashboard.

Corner values:

• 0: Upper left
• 1: Upper right
• 2: Lower left
• 3: Lower right

SignalDashX — Default: 10

Horizontal distance of the Signal Dashboard from the selected corner.

SignalDashY — Default: 20

Vertical distance of the Signal Dashboard from the selected corner.

SignalDashWidth — Default: 330

Width of the Signal Plan Dashboard in pixels.

SignalDashHeight — Default: 280

Height of the Signal Plan Dashboard in pixels.

DASHBOARD TEXT SETTINGS

DashboardFontSize — Default: 8

Base font size used by the dashboards.

DashboardLineGap — Default: 4

Vertical spacing between dashboard rows.

DashboardColumnGap — Default: 160

Horizontal spacing between dashboard columns.

ALERT SETTINGS

EnablePopupAlert — Default: true

Displays a popup alert inside MetaTrader 5 when a new signal is created.

EnablePushNotification — Default: false

Sends the signal to the MetaTrader mobile application.

MetaTrader notifications must be configured before this option can work.

EnableEmailAlert — Default: false

Sends the signal through the email system configured in MetaTrader 5.

Email settings must be configured before this option can work.

AlertOncePerSignal — Default: true

Prevents repeated alerts for the same active signal.

IMPORTANT INFORMATION

• STA Market Compass is an analytical indicator, not an Expert Advisor.

• The indicator does not automatically open, modify or close trading positions.

• Realtime signals are calculated from the current candle and may change before that candle closes.

• Confirmed Mode uses the previous closed candle but does not guarantee that every signal will be successful.

• The four-line support, resistance and balance system is for visual reference only and does not affect the signal calculation.

• Tick volume depends on the broker’s available market data.

• Entry, Stop Loss and Take Profit levels are analytical references and should be reviewed before placing any order.

• Users remain responsible for position sizing, risk management and trade execution.

RISK WARNING

Trading Forex, CFDs and other leveraged financial instruments involves substantial risk. Past market behaviour does not guarantee future results. Signals and price levels provided by this indicator are for analytical and educational purposes and should not be considered financial advice. Always test the indicator and apply appropriate risk management before using it in live trading.


추천 제품
-- 간단하지만 효과적입니다. 역전 지표 - 무엇인가요? 슈퍼트렌드(SuperTrend) 논리와 지수 곡선 기술을 결합한 추세 추종 오버레이 지표입니다. 추세 방향을 감지하고 차트에 동적 채널을 그리며, 추세가 반전될 때 실시간 알림을 보냅니다. 어떻게 작동하나요? 지표는 ATR과 슈퍼트렌드 계수를 사용해 지수형 기준선을 계산합니다. 가격이 이 기준선 위나 아래로 마감되면 추세 반전이 확인됩니다. 녹색 화살표는 매수 추세 시작을, 빨간색 화살표는 매도 추세 시작을 표시합니다. 주요 기능: ATR 기반 동적 채널을 적용한 지수 추세 기준선 녹색/적색으로 구분된 추세선 및 채워진 채널 추세 반전 시 매수/매도 화살표 신호 내장 알림: 팝업, 푸시 알림, 이메일, 소리 중복 알림 방지 (바당 하나의 알림) 완전 커스터마이징 가능: 색상, 선 두께, 화살표 크기, 채널 폭 지연 없는 깔끔한 차트 오버레이 입력값: 지수 추세율, 슈퍼트렌드 계수, ATR 기간, 채널 폭 토글 기능
FREE
Hunttern ZigZag MT5
Hassan Gh Fakhraei
5 (1)
Hunt markets with Hunttern ZigZag . Easy to use with one parameter    You can use it for the following:       -Classic patterns       -Heads and shoulders       -Harmonic patterns       -Elliott Wave       -Support and resistance       -Supply and Demand Single parameter:      -Period (1-120) Features:        -Candle time        -Single parameter        -Light mode template This is version 1 of Hunttern ZigZag. We are very happy to receive feedback from you.
FREE
Fibonacci Font Label
Rajesh Kumar Nait
이 표시기를 사용하면 큰 글꼴 크기로 피보나치 레벨 레이블을 표시할 수 있습니다. . 최대 25개의 피보나치 레벨을 지원합니다. - 피보나치를 그리자마자 선택한 색상과 글꼴로 큰 글꼴 크기의 입력 매개변수로 추가한 레벨이 표시됩니다. 맞춤형 옵션: 1. Fibo 텍스트 글꼴 2. Fibo 텍스트 크기 3. Fibo 텍스트 색상 3. 각 레벨에 설명 추가 4. 앵커 및 각도와 같은 기타 옵션 이 표시기를 사용하면 큰 글꼴 크기로 피보나치 레벨 레이블을 표시할 수 있습니다. . 최대 20개의 피보나치 레벨을 지원합니다. - 피보나치를 그리자마자 선택한 색상과 글꼴로 큰 글꼴 크기의 입력 매개변수로 추가한 레벨이 표시됩니다. 맞춤형 옵션: 1. Fibo 텍스트 글꼴 2. Fibo 텍스트 크기 3. Fibo 텍스트 색상 3. 각 레벨에 설명 추가 4. 앵커 및 각도와 같은 기타 옵션
Here I present you this awesome indicator I made. This is a nique combination witch puts you in the same level as MM's. So you can surf a lot of waves and identify the rally time, breakouts, and the perfect time to get in the market. ---- The SSL Channel is a great all-rounder based on 2 Simple Moving Averages, one of recent Highs, one of recent Lows. The calculation prints a   channel   on the chart consisting of 2 lines. This strategy gives a Long signal when price closes above the top of thes
Info:   marcobarbosabots Pivot lines are an easy way to see market trend. The indicator provides the pivot line and three first support and Resistance lines. Calculations used was: Resistance 3 = High + 2*(Pivot - Low) Resistance 2 = Pivot + (R1 - S1) Resistance 1 = 2 * Pivot - Low Pivot point = ( High + Close + Low )/3 Suport 1 = 2 * Pivot - High Suport 2 = Pivot - (R1 - S1) Suport 3 = Low - 2*(High - Pivot) You can use the calculated values ​​on an EA too, just make sure the indicator is a
FiboZoneLines
Ryoma Iwayama
FiboZoneLines Short Description Automatically draws multi-layered Fibonacci zone lines from your manually placed Fibonacci retracement. No repainting. Fully customizable. Overview FiboZoneLines is a powerful Fibonacci-based indicator for MetaTrader 5 that automatically generates a complete set of multi-layered support and resistance lines from a single manually drawn Fibonacci retracement object on your chart. Unlike standard Fibonacci tools, FiboZoneLines divides the entire retracement range in
This indicator automatically identifies liquidity levels using swing fractals and tracks when price sweeps through them. Works on any symbol and timeframe with full multi-timeframe support. Features: — Detects swing highs and lows via a fractal method (configurable bars left & right) on a selected timeframe. Active levels are displayed as rays extending to the right; swept levels turn into dashed lines ending at the sweep candle. — Plots Previous Day (PDhigh / PDlow), Previous Week (PWhigh / PWl
FREE
Trend Guardian Pro – 추세 조기 예측 인디케이터 Trend Guardian Pro 는 전문 수학자, 분석가 및 트레이더 팀의 협업으로 탄생한 결과물입니다. 수년간의 시장 데이터 분석을 토대로 제작되었으며, 고급 수학적 모델링 기법을 활용하여 추세의 잠재적 변화를 조기에 식별합니다. 주요 특징: 조기 예측   – 시장의 변화가 명확해지기 전, 다양한 시장 요인을 분석하여 추세 전환 신호를 포착합니다. 종합 분석   – 여러 시간대(Multi-Timeframe)를 동시에 분석하여 신호의 신뢰도를 높입니다. 적응형 알고리즘   – 현재 시장의 변동성에 맞춰 알고리즘이 자동으로 조정됩니다. 노이즈 필터링   – 고급 필터링 기술을 통해 시장 노이즈를 제거하고 가짜 신호(데드 캣 바운스 등)를 최소화합니다. 직관적인 인터페이스   – 필요한 모든 정보를 차트 위에 시각적으로 명확하게 표시합니다. 핵심 기능: 추세 강도 식별   (약함 / 중간 / 강함); 거래량 분석 을 통한
이전 버전의 인디케이터 개발 ZigZag WaveSize MT4 ZigZag WaveSize - 표준 ZigZag 인디케이터를 수정하여 포인트, 레벨 및 다양한 경고 로직에 대한 정보 추가 일반적인 개선 사항: MetaTrader 5 코드 적응 그래픽 객체 작업 최적화 새로운 기능: 극점에서의 수평 수준 수준 유형 선택: 수평/광선/세그먼트 유동성 수준 필터 (가격에 의해 돌파되지 않음) 돌파 버퍼: 거짓 돌파에 대한 민감도 설정 레이블 및 기능 설정: 수량, 외관, 오래된 레이블 삭제 구조 돌파 알림 (BoS) 움직임 성격 변경 알림 (ChoCH) 최적화: 극값 업데이트 로직 수정 새로운 객체의 동적 업데이트 바 출현 시 하중 감소 레이블의 중앙 집중 시스템 수정 사항: 배열 범위 초과 수정 레이블의 정확한 위치 지정 중복 파라미터 제거 ZigZag WaveSize 인디케이터를 귀하의 트레이딩 시스템의 보완재로 사용하세요   또한 시장에서의 나의 다른 제품도 시도해 보세요 
FREE
Easy Support and Resistance
Danny Giovanni Romero Lozano
EASY SUPPORT AND RESISTANCE Visualize support and resistance levels across multiple timeframes with dynamic color-coded lines Overview This powerful MT5 indicator automatically identifies and highlights key price levels by drawing rectangles on the last closed candle and its first opposite-colored candle across six different timeframes (M15, M30, H1, H2, H4, D1). The lines dynamically change color based on price action confirmation, transforming into support or resistance levels when validated
FREE
Free automatic Fibonacci is an indicator that automatically plots a Fibonacci retracement based on the number of bars you select on the BarsToScan setting in the indicator. The Fibonacci is automatically updated in real time as new highest and lowest values appears amongst the selected bars. You can select which level values to be displayed in the indicator settings. You can also select the color of the levels thus enabling the trader to be able to attach the indicator several times with differe
FREE
ADR Levels Plus
Dustin Ricardo Pierenz
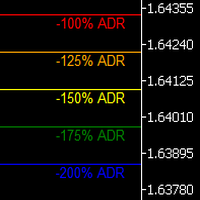
Uncover the market’s secret zones with the ADR Levels+ Indicator. This dynamic tool plots ADR extension levels at 100%, 125%, 150%, and 200% right on your chart. In most cases, price dances between these boundaries—but when it breaks out, it often signals a prime opportunity for a mean reversion trade or the start of an evolving trend. Plus, an integrated alarm system triggers as soon as these key levels are reached, ensuring you never miss a lucrative trading opportunity. Elevate your strategy
TrendDecoder Scanner MT5
Christophe Pa Trouillas
5 (1)
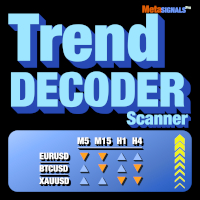
여러 자산 및 여러 시간 단위에 대한   TrendDECODER 신호 받기 | 입력하기에 가장 좋은 시간 단위 결정 | 수익 및 거래 승리 극대화 재도색되지 않는, 지연되지 않는 지표 및 스크리너 - 수동 및 자동 거래에 이상적 - 모든 자산 및 모든 시간 단위에 적합 49달러  첫 50부 - 그 이후에는 99달러 구매 후, 댓글을 남기거나 리뷰를 남겨주세요 . 그러면 99달러 상당의 추가 지표를 보내드립니다。 무엇에 관한 것인가요? 이 스크리너는 가장 높은 평가를 받은 TrendDECODER 의 보조 도구입니다。 이를 통해: 거래를 위한 모든 관련 시간 프레임에서 즐겨찾는 자산의 현재 TrendUP 및 TrendDOWN 신호를 받음 수익성 있는 추세 추종 또는 스윙 트레이드를 위한 가장 유리한 시간 프레임 구성을 즉시 확인 가장 유리한 시간 프레임 구성은 무엇인가요? 먼저, 하위 / 메인 / 상위 시간 단위로 멀티 타임 프레임 차트를 설정하세요 둘째, 메인 시간 프레
Volumatic VIDyA MT5
Duc Hoan Nguyen
5 (2)
Special offer : ALL TOOLS , just $35 each! New tools   will be   $30   for the   first week   or the   first 3 purchases !  Trading Tools Channel on MQL5 : Join my MQL5 channel to update the latest news from me Volumatic VIDYA (Variable Index Dynamic Average) 는 트렌드를 추적하고 각 트렌드 단계에서 매수 및 매도 압력을 분석하기 위해 설계된 고급 지표입니다. 가변 지수 동적 평균(Variable Index Dynamic Average)을 핵심 동적 평활화 기술로 활용하여 이 도구는 주요 시장 구조 수준에서 가격 및 거래량 역학에 대한 중요한 통찰력을 제공합니다. MT4 버전 보기:  Volumatic VIDyA MT4 다른 제품 보기:    모든 제품 To use iCustom
Apex Break PRO MT5
Kestutis Balciunas
Apex Break PRO는 MetaTrader 5용 비재도색 피봇 추세선 돌파 지표입니다. 피봇 고점과 피봇 저점을 감지하고, 연속 피봇 사이에 동적 경사 추세선을 그리며, 확정된 봉 마감 시 가격이 해당 추세선을 돌파할 때 매수 및 매도 신호를 생성합니다. 모든 신호는 최대 4개의 독립적인 컨플루언스 레이어——EMA 추세, RSI 경계값, 거래량 급증 감지, ADX 추세 강도——를 통해 필터링되며, 트레이더가 몇 가지 조건이 일치했는지 즉시 확인할 수 있도록 스타 평가 시스템으로 등급이 매겨집니다. ATR 기반 손절매와 3개의 이익실현 레벨이 각 신호에 대한 체계적인 리스크 관리를 제공하며, 실시간 대시보드는 방향, 필터 상태, 도달 체크 표시가 포함된 거래 레벨 추적을 표시합니다. MT4 버전 확인:  Apex Break PRO MT4 더 많은 제품 보기:   전체 제 품 목록 실시간 예제와 새로운 도구를 확인하려면 프로필을 방문하여 업데이트를 놓치지 않도록 친구 요청을 보내세
Caicai L&S Yield Histogram Important Notice: This indicator is an integral tool of the automated EA Caicai Long and Short Pair Trading . This indicator visually displays the percentage deviation (Yield %) of a pair's current spread relative to its own historical mean. It is an excellent tool for quickly visualizing the gross financial potential of a market distortion in Long & Short operations. Main Features: Percentage Visualization: Understand the size of the distortion in palpable percentage
Fibonacci Pips MT5 Instant Fibonacci Levels, Prices and Pip Distances Fibonacci Pips MT5 is a practical Fibonacci measurement tool for MetaTrader 5. It displays each Fibonacci level together with its exact price and pip distance, helping traders plan pullbacks, profit targets and stop-loss levels without manual calculations. Instead of seeing only percentages such as 38.2%, 50.0% or 61.8%, traders can immediately understand: The Fibonacci level The exact market price The pip distance from the re
Fibonacci Auto Levels — Smart, Automatic Fibonacci Mapping Introduction Fibonacci Auto Levels is an indicator that automatically detects key price zones and draws precise Fibonacci levels. It helps traders focus on strategy by removing the need for manual setup. Key Features - Automatic peak and trough detection based on customizable candle lookback - Classic and extended Fibonacci levels from 0.0% to 161.8%, drawn with geometric precision - Customizable visual design with adjustable colors,
FREE
Pare de seguir as "sardinhas" e comece a operar como big player, de forma automática. O robô Imbalance Autotrader é a mais recente tecnologia de trade que monitora os big players (grandes investidores) do mercado financeiro. Com estratégia de rompimento ( breakout ) ou pullback (Fair Value Gap FVG e Order Block) , você consegue configurar o robô para o ativo, conforme condições que você deseja operar. Além disso, o robô pode ter stops configuráveis, dinâmicos ou fixos. Na questão de gerenciamen
The   DailyWeeklyMarkers   indicator helps traders visualize trading weeks by clearly marking the start of each day and week on the chart. It draws vertical separator lines for each day (including weekends if enabled) and highlights the beginning of new trading weeks with double lines for better clarity. This makes it easier to analyze price action within daily and weekly contexts. Who Is This Indicator For? Swing Traders   – Helps identify weekly opening gaps and key levels. Day Traders   – Vis
FREE
BluePrint Adaptive Trader - Professional Trading System Advanced Channel Trading System based on our proprietary TrenderFlex PRO algorithm Learn more about TrenderFlex PRO KEY FEATURES • TrenderFlex PRO Channel Technology - Advanced channel calculation based on our proven algorithm • Adaptive Risk Management - Automatic TP/SL calculation based on channel width • Win Rate Statistics - Real-time tracking of TP1, TP2, TP3 success rates • Multi-Timeframe Analysis - Monitor 7 timeframes simultaneou
FREE
Displays trends in current chart. You can display trends of multiple timeframes in one chart by inserting this indicator as often as you want. Key features: displays trend line by finding highs and lows counts number of high/low of current trend in different color (long/short) allows you to display multiple timeframe trends in one chart Settings: Indicator Name: if you want to show M5 and H1 on one chart add TITrend twice to your current chart and rename M5 to "TITrendM5" and H1 to "TITrendH1" C
VibeFox ZigZag — 돌파 및 반전 진입 지점을 갖춘 스윙 피벗 VibeFox ZigZag는 MetaTrader 5를 위한 실시간 스윙 구조 인디케이터입니다. 의미 있는 고점과 저점을 연결하는 고전적인 ZigZag 라인을 그리고, 진입 신호가 나타나는 순간을 가격 차트 위에 직접 표시하며, 모든 조작을 하나의 현대적인 인터랙티브 패널에 모읍니다. 차트를 눈으로 살피며 천장과 바닥을 찾는 대신, 시장 구조와 진입 지점이 형성되는 바로 그 순간에 볼 수 있습니다. 인디케이터 작동 방식 ZigZag는 작은 가격 노이즈를 걸러내고 의미 있는 전환점 — 스윙 고점(피크)과 스윙 저점(트로프) — 만 남깁니다. 그런 다음 연속된 피벗을 직선 구간으로 연결하여 추세의 깔끔한 골격을 만듭니다. 이 구성은 세 가지 고전적인 파라미터로 제어됩니다. Depth 는 두 피벗 사이의 최소 봉 수를 설정하여, 라인이 작은 흔들림을 무시하고 충분히 오래 지속되는 움직임에만 반응하게 합니다. Devia
Pure Impulse Elastic Oscillator
Deynis Alejandro Puro Rodriguez
P U R E   I M P U L S E   E L A S T I C               See the market's hidden tension build, peak, and fade. Every strong move in the market is born from tension — and dies from exhaustion. PURE IMPULSE ELASTIC was built to make that hidden tension VISIBLE, in real time, on any chart you trade. It reads price like a weight pull
Auto Fib Retracements
Ross Adam Langlands Nelson
4.2 (5)
Automatic Fibonacci Retracement Line Indicator. This indicator takes the current trend and if possible draws Fibonacci retracement lines from the swing until the current price. The Fibonacci levels used are: 0%, 23.6%, 38.2%, 50%, 61.8%, 76.4%, 100%. This indicator works for all charts over all timeframes. The Fibonacci levels are also recorded in buffers for use by other trading bots. Any comments, concerns or additional feature requirements are welcome and will be addressed promptly. 
FREE
UZFX-알파 스트라이크 시그널 v2.0은 높은 확률의 거래 기회를 정밀하고 명확하게 식별하도록 설계된 전문가급 시장 분석 도구입니다. 이 고급 지표는 정교한 가격 움직임 인식과 동적 리스크 관리 시각화를 결합하여 차트에 직접 명확한 매수 및 매도 신호를 제공합니다. 참고: { LTL 164343 } 지표와 함께 사용하면 신호의 적중률을 높일 수 있습니다. LTL 신호를 통해 추세를 파악하고, 알파 신호를 진입 신호로 활용하십시오. 이러한 접근 방식은 승률을 극대화하고 오신호를 방지하는 데 도움이 됩니다. 작동 원리 이 지표는 잠재적인 추세 반전 또는 지속을 시사하는 특정 캔들 패턴을 식별하여 시장 구조를 분석합니다. 이러한 패턴이 당사의 독자적인 알고리즘 조건과 일치할 때 지표는 명확한 시각적 신호를 생성합니다: 매수 신호(파란색 화살표)는 강세 모멘텀이 감지될 때 시장 저점에서 나타납니다 매도 신호(빨간색 화살표)는 약세 압력이 확인될 때 시장 고점에서 나타납니다 트레이더를
LevelsFib DTZ
Vitaliy Davydov
The combined Levels Ib DTZ indicator helps to determine the trend direction when trading. Displaying signals on the chart about a possible upcoming trend change. The indicator is a combination of Fibonacci levels with overbought and oversold zones and a trend indicator based on ZigZag and ATR indicators. The Levels Ib DTZ indicator helps traders predict future price movements and adjust their strategy accordingly. It works on all timeframes.
FibExtender
Syed Oarasul Islam
This Indicator draws Fibonacci Extension levels in two different ways. You can select whether to draw Fibonacci Extension levels based on your favourite ZigZag settings or you can let the indicator to draw Fibonacci Extension  level based on given number of Bars or Candles.  You can also set Mobile and Email notification for your favourite Extension  levels individually. With this indicator you will not have to feel lonely as the it can generate Voice alerts, which will keep you focused on your
OA SnR Power MT5
Duc Hoan Nguyen
5 (3)
Special offer : ALL TOOLS , just $35 each! New tools   will be   $30   for the   first week   or the   first 3 purchases !  Trading Tools Channel on MQL5 : Join my MQL5 channel to update the latest news from me 개요 OA SnR Power는 트레이더가 지지와 저항 레벨의 강도를 식별하고 평가하도록 설계된 강력한 도구입니다. 거래량, 반등 빈도 및 재테스트 횟수와 같은 주요 요소를 통합하여 이 지표는 시장의 주요 가격 영역에 대한 종합적인 뷰를 제공합니다. 더 많은 제품 보기:   모든 제품 OA SnR Power의 작동 원리 고점과 저점 식별 이 지표는 지역 고점과 저점을 계산하기 위해 지능형 알고리즘을 사용합니다. 사용자는 영역 폭 설정을 조정하여 잠재적인 지지 및 저항 수준을 정확하게 탐지할 수 있습니다. 주요
FREE
This EA finds Fair Value Liquidity (FVL) on the chart, tracks when they get mitigated , and then looks for an inversion signal (price “fails” through the zone). When that inversion happens, it places a trade in the opposite direction of the original Liquidity gap (an Inverse FVG approach). It also lets you control when it trades using market sessions , and it can auto-close positions at New York open (all positions or profitable-only). Key advantages Clear, rule-based entries (no guessing): trad
FREE
이 제품의 구매자들이 또한 구매함
이 제품은 2026년 시장에 맞게 업데이트되었으며 최신 MT5 빌드에 최적화되었습니다. 가격 업데이트 안내: Smart Trend Trading System은 현재 $99 에 제공됩니다. 다음 30회 구매 후 가격은 $199 로 인상됩니다. 특별 혜택: Smart Trend Trading System 구매 후 저에게 개인 메시지를 보내시면 Smart Universal EA를 무료 로 받을 수 있으며, Smart Trend 신호를 자동 거래로 전환할 수 있습니다. Smart Trend Trading System은 리페인트 없음, 재그리기 없음, 지연 없음의 완전한 트레이딩 시스템으로, 더 깨끗한 신호, 더 나은 추세 방향, 그리고 더 체계적인 시장 거래 방식을 원하는 트레이더를 위해 제작되었습니다. Online course , manual and [download presets] . 이 시스템은 추세 감지, 반전 구간, Smart Cloud, 트레일링 스톱 로직, 지지와 저항, 캔들
SuperScalp Pro
Van Minh Nguyen
4.69 (29)
SuperScalp Pro – 전문 멀티 레이어 컨플루언스 스캘핑 시스템 SuperScalp Pro 는 다중 컨플루언스를 기반으로 한 전문 스캘핑 시스템으로, 트레이더가 더 높은 확률의 매매 기회를 식별할 수 있도록 설계되었습니다. 명확한 진입 신호 확인, ATR 기반 손절(Stop Loss) 및 목표가(Take Profit), 그리고 XAUUSD, BTCUSD 및 주요 외환 통화쌍에 대한 유연한 신호 필터링 기능을 제공합니다. 전체 문서는 제품 블로그에서 확인할 수 있습니다:   [User Guide] SuperScalp Pro Auto Trader EA를 통해 자동 매매를 지원합니다:   [Auto Trader] SuperScalp Pro의 거래 로직을 기반으로 개발된 골드 자동 스캘핑 EA:   [SuperScalp Gold] SuperScalp Pro 는 Supertrend, VWAP, EMA, RSI, ADX, 거래량 분석, 볼린저 밴드 및 MACD 다이버전스를 결합하여
M1 Quantum MT5
Hamed Dehgani
5 (8)
M1 Quantum을 이용한 실시간 트레이딩 신호 : 신호   ( Quantum Trade Assistant 에 의해 거래가 자동으로 실행되며, 이 제품에 무료 로 포함되어 있습니다.) 가격 계획: 현재 가격: $169 (얼리 어답터 혜택) 다음 예정 가격: $189 예정 소매 가격: $299 개발자 안내: 구매 후 저에게 연락하시면 최신 권장 설정 파일(Set File) , 사용 팁, 그리고 다른 M1 Quantum 사용자들과 소통할 수 있는 VIP 지원 그룹 초대장을 받으실 수 있습니다. M1 Quantum 은 M1 전용 전문 트레이딩 시스템으로, 손절(Stop Loss), 익절(Take Profit), 그리고 스마트 자금 관리 기능이 내장된 빠르고 정확한 거래 신호를 제공합니다. M1 Quantum 은 연속 수익 거래 에 집중하여 계좌를 빠르게 성장시키도록 설계된 전문 자금 관리 시스템을 포함하고 있습니다. M1 Quantum 인디케이터 의 주요 기능 M1 타임프레임 및 모든
Neuro Poseidon MT5
Daria Rezueva
4.8 (54)
Neuro Poseidon is a new indicator by Daria Rezueva. It combines precise trading signals with adaptive TP/SL levels - creating best possible trades as a result! Message me and get  Neuro Poseidon Assistant  as a gift to automize your trading process! What makes it stand out? 1. Proven profitability on all assets and timeframes 2. Only confirmed BUY and SELL signals present on the chart 3. Adaptive TP & SL levels generated by the software for each trade 4. Easy to understand - suitable for al
SMC Intraday Formula
Kareem Abbas
5 (19)
먼저 솔직하게 말하겠습니다. 어떤 인디케이터도 단독으로 당신을 수익성 있게 만들어주지 않습니다. 누군가 그렇게 말한다면, 그는 당신에게 꿈을 파는 것입니다. 완벽한 매수/매도 화살표를 보여주는 모든 인디케이터는 완벽하게 보이도록 만들 수 있습니다 — 단지 올바른 과거 구간을 확대하고 승리한 거래만 캡처하면 됩니다. 우리는 그렇게 하지 않습니다.  SMC Intraday Formula는 도구입니다. 시장 구조를 읽고, 가장 높은 확률의 가격 구간을 표시하며, 현재 스마트 머니의 흐름이 어떻게 보이는지 아주 단순한 언어로 보여줍니다. 최종 결정은 여전히 당신이 합니다. 실행도 당신이 합니다. 하지만 이제는 희망이 아니라 정확성으로 거래하게 됩니다. 우리는 이 인디케이터를 지난 약 3년 동안 골드(XAUUSD) 및 주요 외환 통화쌍의 데이 트레이딩 스캘핑에 사용해 왔습니다. M1, M5, M15, M30에서 우리의 핵심 도구입니다. 이 도구는 미래를 예측하려 하지 않습니다 — 지금 형성
Trend Sniper X
Sarvarbek Abduvoxobov
5 (6)
Trend Sniper X 는 MetaTrader 5용 멀티 타임프레임 추세 추종 지표로, 트레이더가 추세 방향과 잠재적 반전 지점을 명확하고 정확하게 식별하도록 돕습니다. 가격 정보: 현재 가격은 프로모션 가격이며, 향후 업데이트 및 새로운 기능 출시 시 변경될 수 있습니다. Code2Profit 채널 멀티 타임프레임 분석으로 시장을 마스터하세요! 기술 사양 플랫폼 MetaTrader 5 지표 유형 멀티 타임프레임 추세 지표 운용 타임프레임 모든 차트 타임프레임 지원, 독립적으로 선택 가능한 상위 타임프레임(M1–MN1) 주요 상품 외환, 금(XAUUSD) 및 기타 CFD 권장 계좌 모든 계좌 유형 시각화 색상별 추세 캔들(매수/매도/약세/변경) + 매수/매도 화살표 추가 모듈 세션 시장 박스(시드니, 도쿄, 런던, 뉴욕) 주요 기능 멀티 타임프레임 추세 분석: 상위 타임프레임의 추세 방향을 현재 차트에 직접 투영하여 명확한 매크로 관점을 제공합니다. 약세/불확실한 바 감지: 추세
Entry In The Zone and SMC Multi Timeframe is a real-time 2-in-1 market analysis tool that combines SMC market structure analysis and a No Repaint BUY / SELL signal system into a single indicator, built on Smart Money Concepts (SMC) — a widely adopted framework used by professional traders to understand market structure. This indicator helps you see the market more clearly, make decisions based on structure rather than guesswork, and focus on high-probability zones where price is more likely to r
Entry Points Pro for MT5
Yury Orlov
4.49 (143)
전설이 돌아왔습니다: Entry Points Pro 10. MQL5 마켓 Top-3 자리를 3년간 지켜온 전설적인 지표의 재출시입니다. 수백 개의 호평 리뷰(두 버전 합산 589개), 매일 이 지표로 거래하는 수천 명의 트레이더, 31,000회 이상의 데모 다운로드. 지난 5년간 여러분이 남긴 리뷰를 하나도 빠짐없이 읽었고, 약속 대신 그 답을 버전 10에 담았습니다. 1999년부터 시장에서 활동하며 정직함과 자신의 평판, 그리고 고객을 소중히 여기는 개발자가 만들었습니다. Entry Points Pro의 진입 시그널은 절대 리페인팅되지 않습니다. 그리고 이번에는 개발자의 말뿐이 아니라 검증 가능한 사실입니다: 확정 시그널은 캔들 종가에서만 표시되며, 자동화 테스트에서 리페인팅 0건 이 확인되었습니다(EURUSD, XAUUSD, BTCUSD에서 2,486,568회의 불변조건 검사 — 위반 0건). 검증 방법은 공개되어 있으니 전략 테스터에서 직접 재현해 보실 수 있습니다. 구매 직후
Power Candles MT5
Daniel Stein
5 (9)
Power Candles V3 - 자체 최적화 강도 지표 파워 캔들 V3는 적용된 모든 차트에서 통화 및 상품의 강세를 실행 가능한 거래 계획으로 전환합니다. 단순히 캔들에 색상을 입히는 대신, 백그라운드에서 실시간 자동 최적화를 수행하여 현재 보고 있는 종목에 대한 최적의 손절매, 익절 및 신호 임계값을 제공합니다. 한 번의 클릭으로 실시간 거래에 적용할 수 있으며, 진입점, 손절매 및 익절 선이 정확한 가격에 맞춰 차트에 표시되고, 방향과 함께 알림이 발령됩니다. 이 도구는 Stein Investments 에코시스템의 일부입니다. 18개 이상의 도구와 함께 당신의 1대1 AI 트레이딩 멘토 Max.  항상 대기 중, 모든 인디케이터를 깊이 있게 이해, 무언가를 차근차근 생각해보고 싶은 순간에 도움을 줍니다.  https://stein.investments 에서 만나보세요 매 종가 바마다 3,000회 이상의 트레이딩 시뮬레이션. 9가지 강도 상태. 2가지 전략을 병렬로 테스트.
M1 Sniper MT5
Oleg Rodin
5 (1)
M1 SNIPER 는 사용하기 쉬운 거래 지표 시스템입니다. M1 시간대에 맞춰 설계된 화살표 지표입니다. 이 지표는 M1 시간대 스캘핑을 위한 단독 시스템으로 사용할 수 있으며, 기존 거래 시스템의 일부로도 사용할 수 있습니다. 이 거래 시스템은 M1 시간대 거래용으로 특별히 설계되었지만, 다른 시간대에도 사용할 수 있습니다. 원래는 XAUUSD와 BTCUSD 거래를 위해 이 방법을 설계했지만, 다른 시장 거래에도 유용하다는 것을 알게 되었습니다. 이 지표의 신호는 추세 방향과 반대로 거래될 수 있습니다. 저는 지표의 신호를 활용하여 양방향으로 거래할 수 있도록 돕는 특별한 거래 기법을 알려드립니다. 이 방법은 특별한 동적 지지선과 저항선 가격 영역을 활용하는 것을 기반으로 합니다. 구매하시면 M1 SNIPER 화살표 지표를 바로 다운로드하실 수 있습니다. 또한, 아래 스크린샷에 표시된 Apollo Dynamic SR 지표는 M1 SNIPER 도구를 사용하는 모든 사용자에게 무료로
Gann Made Easy MT5
Oleg Rodin
5 (8)
Gann Made Easy 는 mr.의 이론을 사용하여 최고의 거래 원칙을 기반으로 하는 전문적이고 사용하기 쉬운 Forex 거래 시스템입니다. W.D. 간. 이 표시기는 Stop Loss 및 Take Profit Levels를 포함하여 정확한 BUY 및 SELL 신호를 제공합니다. PUSH 알림을 사용하여 이동 중에도 거래할 수 있습니다. 구매 후 거래 방법 안내 및 유용한 추가 지표를 무료로 받으시려면 저에게 연락주세요! 아마도 Gann 거래 방법에 대해 이미 여러 번 들었을 것입니다. 일반적으로 Gann의 이론은 초보자 거래자뿐만 아니라 이미 거래 경험이 있는 사람들에게도 매우 복잡한 것입니다. Gann의 거래 방식은 이론적으로 적용하기 쉽지 않기 때문입니다. 나는 그 지식을 연마하고 Forex 지표에 최고의 원칙을 적용하기 위해 몇 년을 보냈습니다. 표시기는 적용하기가 매우 쉽습니다. 차트에 첨부하고 간단한 거래 권장 사항을 따르기만 하면 됩니다. 지표는 지속적으로 시장 분석
Divergence Bomber
Ihor Otkydach
4.9 (92)
이 지표를 구매하신 분께는 다음과 같은 혜택이 무료로 제공됩니다: 각 거래를 자동으로 관리하고, 손절/익절 수준을 설정하며, 전략 규칙에 따라 거래를 종료하는 전용 도우미 툴 "Bomber Utility" 다양한 자산에 맞게 지표를 설정할 수 있는 셋업 파일(Set Files) "최소 위험", "균형 잡힌 위험", "관망 전략" 모드로 설정 가능한 Bomber Utility의 셋업 파일 이 전략을 빠르게 설치, 설정, 시작할 수 있도록 돕는 단계별 영상 매뉴얼 주의: 위의 모든 보너스를 받기 위해서는 MQL5 개인 메시지 시스템을 통해 판매자에게 연락해 주세요. 독창적인 커스텀 지표인 “Divergence Bomber(다이버전스 봄버)”를 소개합니다. 이 지표는 MACD 다이버전스(괴리) 전략을 기반으로 한 올인원(All-in-One) 거래 시스템입니다. 이 기술 지표의 주요 목적은 가격과 MACD 지표 간의 다이버전스를 감지하고, **향후 가격이 어느 방향으로 움직일지를 알려주는
GoldenX Entry MT5
Kareem Abbas
5 (14)
GoldenX Entry는 MT5용 인디케이터로, 적응형 Smart Entry Trend 알고리즘, 신호 스코어링 시스템, 시장 레짐 감지 기능, 그리고 변동성 필터를 포함합니다. 각 신호에는 계산된 진입 레벨, 3개의 익절(TP1, TP2, TP3) 레벨, 그리고 손절(Stop-Loss) 레벨이 포함됩니다. 이 인디케이터는 다양한 시장 환경에 적응하도록 설계된 다중 분석 레이어 구조 위에 구축되어 있으며, 내장 최적화기와 통계 추적 시스템을 결합합니다. 또한 Risk-to-Reward(RR) 지표와 과거 거래 행동 기반의 정량 분석을 제공합니다. 시작은 간단합니다 — 선택한 타임프레임에서 최적화기를 실행한 뒤 차트에서 바로 인디케이터를 사용하면 됩니다. 핵심 기능 GoldenX Entry는 하나의 차트에서 신호 엔진, 트레이드 관리 기능, 그리고 과거 통계 추적을 통합합니다: - 내장 최적화기: 최적화기는 차트에서 원클릭으로 실행됩니다. 200개의 파라미터 조합을 두 단계 탐색
Atomic Analyst MT5
Issam Kassas
4.33 (43)
이 제품은 2026년 시장에 맞게 업데이트되었으며 최신 MT5 빌드에 최적화되었습니다. 가격 업데이트 안내: Atomic Analyst는 현재 $99 에 제공됩니다. 다음 30회 구매 후 가격은 $199 로 인상됩니다. 특별 혜택: Atomic Analyst 구매 후 저에게 개인 메시지를 보내시면 Smart Universal EA를 무료 로 받을 수 있으며, Atomic Analyst 신호를 자동 거래로 전환할 수 있습니다. Atomic Analyst는 리페인트 없음, 재그리기 없음, 지연 없음의 Price Action 거래 인디케이터로, 수동 거래, 신호 명확성, EA 자동화를 위해 설계되었습니다. User manual: settings, inputs and strategy.   &   User Manual PDF . 가격 움직임, 강도, 모멘텀, 다중 시간대 방향 및 고급 필터를 분석하여 트레이더가 노이즈를 줄이고 약한 세팅을 피하며 더 체계적인 거래 결정을 내릴 수 있도록
Crystal Heikin Ashi Signals
Muhammad Jawad Shabir
5 (2)
Crystal Heikin Ashi Signals - Professional Trend & Signal Detection Indicator Advanced Heikin Ashi Visualization with Intelligent Signal System for Manual & Automated Trading Final Price: $149 ---------> Price goes up $10 after every 10 sales . Limited slots available — act fast . Overview Crystal Heikin Ashi Signals is a professional-grade MetaTrader 5 indicator that combines pure Heikin Ashi candle visualization with an advanced momentum-shift detection system. Designed for both manual traders
ARIPoint
Temirlan Kdyrkhan
1 (1)
ARIPoint is a powerful trading companion designed to generate high-probability entry signals with dynamic TP/SL/DP levels based on volatility. Built-in performance tracking shows win/loss stats, PP1/PP2 hits, and success rates all updated live. Key Features: Buy/Sell signals with adaptive volatility bands Real-time TP/SL/DP levels based on ATR Built-in MA Filter with optional ATR/StdDev volatility Performance stats panel (Success, Profit/Loss, PP1/PP2) Alerts via popup, sound, push, or email Cu
The Oracle Pro
Ottaviano De Cicco
5 (1)
The Oracle Pro: Synthetic Multi-Timeframe Bias Engine for MT5 ️ Summer Launch Offer — Get The Oracle Pro for USD 199 (early buyers). Price rises with traction; final price USD 399. The Oracle Pro is a premium multi-timeframe bias engine for MetaTrader 5, built for demanding and professional traders. It answers one question with discipline: what is the directional bias on each timeframe right now, how strong is it, and how much do the timeframes agree? Everything is computed on closed bars only
Super Hero Signals
Eugen-alexandru Zibileanu
5 (2)
SUPER HERO Signals 는 MeanFX가 개발한 새로운 트레이딩 지표입니다. 정밀한 매매 신호와 적응형 TP/SL(익절/손절) 레벨을 결합하여 통계적으로 우수한 거래 기회를 제공합니다. 가격은 5건의 구매가 이루어질 때마다 인상됩니다. 다음 가격은 50달러 입니다. 구매 전에 메시지를 보내주시면 실시간 차트 미리보기와 최신 거래 통계 자료를 제공해 드립니다. 이를 통해 보다 현명한 결정을 내리고 거래 성과를 향상시키는 데 도움이 될 것입니다. SUPER HERO Signals의 주요 특징 M15 골드(XAUUSD) 시장에서 검증된 통계적 성과. (여러 시장과 시간대를 동시에 공략하기보다 하나의 타임프레임을 완벽하게 마스터하는 데 집중합니다.) 하루 1~3회의 거래 기회 제공, 높은 승률과 통계적 우위를 확보. 차트에는 검증된 BUY(매수) 및 SELL(매도) 신호만 표시. 각 거래마다 시장 상황에 맞춰 TP(익절) 및 SL(손절) 레벨을 자동 생성. 평균 승률 75% 이상
MT5 Indicator See What the Market Is Really Doing, See the 3 Market Phases Live in front of you (Contraction, Expansion, Trend Phases) and have Better Entries at the Early Stage in the Trend Phase. Stop guessing . Start reading the market like the institutions, Smart Money do. Apex Market Structure Pro Indicator for MT5 is a precision smart-money analysis tool that strips away the noise and shows you the true structure beneath every candle, liquidity, structure shifts, accumulat
소개       Quantum Breakout PRO   , 브레이크아웃 존 거래 방식을 변화시키는 획기적인 MQL5 지표! 13년 이상의 거래 경험을 가진 숙련된 트레이더 팀이 개발한       퀀텀 브레이크아웃 PRO       혁신적이고 역동적인 브레이크아웃 존 전략으로 거래 여정을 새로운 차원으로 끌어올리도록 설계되었습니다. Quantum Breakout Indicator는 5개의 이익 목표 영역이 있는 브레이크아웃 영역의 신호 화살표와 브레이크아웃 상자를 기반으로 한 손절 제안을 제공합니다. 초보자 거래자와 전문 거래자 모두에게 적합합니다. Quantum EA 채널:       여기를 클릭하세요 중요한! 구매 후 설치 매뉴얼을 받으려면 개인 메시지를 보내주십시오. 추천: 기간: M15 통화쌍: GBPJPY, EURJPY, USDJPY,NZDUSD, XAUUSD 계정 유형: 스프레드가 매우 낮은 ECN, Raw 또는 Razor 브로커 시간: GMT +3 중개인 :
KAMA Confluence Engine 트렌드에 따라 거래하고, 시장이 반전되는 순간에 즉시 진입, 스톱, 목표가를 확인하세요. KAMA Confluence Engine은 Kaufman Adaptive Moving Average(KAMA)를 기반으로 한 올인원 트렌드 지표로, 틱 거래량 가중치, 멀티 타임프레임 확인, 자동 거래 레벨 기능이 강화되어 있습니다. 시장 상황에 따라 자동으로 적응하며, 트렌드 구간에서는 빠르고 민감하게, 횡보 구간에서는 안정적이고 노이즈를 필터링하여 항상 올바른 방향에서 거래할 수 있도록 돕습니다. 특징 거래량 가중 적응형 엔진 실제 틱 거래량이 증가하면 KAMA 라인이 빨라지고, 거래량이 줄어들면 느려집니다. 강한 움직임에는 머물고, 가짜 신호는 피할 수 있습니다. 눈에 띄는 네온 리본 밝고 부드러운 라인으로, 아래에는 짙은 그림자가 있습니다. 녹색 = 상승 추세, 빨간색 = 하락 추세, 회색 = 횡보/비거래. 멀리서도 한눈에 추세를 파악할 수 있습니
UZFX {SSS} 스캘핑 스마트 시그널 v4.0 MT5는 급변하는 시장에서 정확한 실시간 시그널을 필요로 하는 스캘퍼, 데이 트레이더, 스윙 트레이더를 위해 설계된 리페인팅이 없는 고성능 트레이딩 지표입니다. (UZFX-LABS)에서 개발한 이 지표는 가격 움직임 분석, 추세 확인 및 스마트 필터링을 결합하여 모든 통화 쌍과 시간대에서 높은 확률의 매수 및 매도 신호, 경고 신호, 추세 지속 기회를 생성합니다. 거래에 대한 의구심을 떨쳐버리고, 명확성, 정밀성, 그리고 규율 있는 시장 실행을 원하는 트레이더를 위해 설계된 체계적인 신호 시스템을 따르기 시작하세요. 제 추천* 최적의 시간대: 15분 이상. {H1}이 제가 가장 선호하는 시간대입니다. 그리고 그 결과는 정말 놀라울 정도입니다...!! 주요 기능 업데이트 • 자동 매수 및 매도 신호 감지 • 고급 반전 인식 로직 • 잠재적인 시장 반전 전 조기 경고 신호 • 추세 지속 확인 신호 • 진입, 손절, TP1, TP2,
이 제품은 2026년 시장에 맞게 업데이트되었으며 최신 MT5 빌드에 최적화되었습니다. 가격 업데이트 안내: Smart Price Action Concepts는 현재 $200 에 제공됩니다. 다음 30회 구매 후 가격은 $299 로 인상됩니다. 특별 혜택: 구매 후 저에게 개인 메시지를 보내시면 무료 보너스 + 선물 을 받을 수 있습니다. 먼저, 이 트레이딩 도구는 리페인트 없음, 재그리기 없음, 지연 없음의 인디케이터이므로 전문적인 트레이딩에 적합하다는 점을 강조하고 싶습니다. Online course , and manual Smart Price Action Concepts Indicator는 초보자와 경험 많은 트레이더 모두에게 매우 강력한 도구입니다. 20개 이상의 유용한 인디케이터를 하나로 결합하고, Inner Circle Trader Analysis와 Smart Money Concepts Trading Strategies 같은 고급 트레이딩 아이디어를 통합합니다. 이 인디
Axiom Matrix
Issam Kassas
5 (3)
AXIOM MATRIX MT5 출시 가격: $99 Axiom Matrix는 출시 가격 $99에 제공됩니다. 첫 30회 구매 이후 가격은 $199로 인상됩니다. 구매 후, 안내 사항을 받고 독점 선물 보너스를 받기 위해 저에게 직접 DM을 보내주세요. Axiom Matrix는 MetaTrader 5용 전문 멀티 심볼, 멀티 타임프레임 시장 스캐너이자 의사결정 대시보드입니다. Axiom Matrix는 사용자의 Market Watch를 스캔하고, 여러 타임프레임을 분석하며, 여러 근거 엔진을 읽고, 가장 강한 기회를 비교하여 하나의 깔끔한 매트릭스 대시보드 안에서 최적의 BUY, SELL, WAIT 또는 차단 상태를 보여줍니다. 저는 무거운 시장 스캔 작업을 대신 처리해 줄 수 있는 하나의 도구가 필요했기 때문에 Axiom Matrix를 만들었습니다. 저는 RSI만 따로 확인하고 싶지 않았습니다. 그다음 MACD만 따로 확인하고. 그다음 이동평균. 그다음 거래량. 그다음 변동성. 그다음
Transaction Speed MT5
Ivan Stefanov
5 (4)
이 지표는 시장에서 관심이 나타나는 영역 을 강조 표시한 후, 주문이 누적되는 영역 을 보여줍니다. 이는 **대규모 오더북(호가창)**처럼 작동합니다. 이것은 거대한 자금 을 위한 인디케이터입니다. 성능은 탁월하며, 시장에서 어떤 관심이 있든 반드시 포착할 수 있습니다 . (이것은 완전히 새로 작성되고 자동화된 버전 입니다 – 이제 수동 분석은 필요하지 않습니다.) **거래 속도(Transaction Speed)**는 새로운 개념의 인디케이터로, 시장에 대규모 주문이 언제, 어디에 쌓이는지를 보여주며 , 그 이점을 분석합니다. 매우 초기 단계에서 트렌드 전환 을 감지할 수 있습니다. FX 시장에서 흔히 사용하는 "거래량(volume)"은 오해입니다. 실제로는 시간당 가격 변화량 이므로, 올바른 용어는 거래 속도 입니다. 우리가 어떻게 사고하고, 행동하며, 분석하느냐 가 가장 중요합니다. 분석 패러다임의 전환 은 필수적입니다. 이 인디케이터는 외환 시장에서의 볼륨 개념을 논리적으로
FX Power MT5 NG
Daniel Stein
5 (33)
FX Power: 통화 강세 분석으로 더 스마트한 거래 결정을 개요 FX Power 는 어떤 시장 상황에서도 주요 통화와 금의 실제 강세를 이해하기 위한 필수 도구입니다. 강한 통화를 매수하고 약한 통화를 매도함으로써 FX Power 는 거래 결정을 단순화하고 높은 확률의 기회를 발견합니다. 트렌드를 따르거나 극단적인 델타 값을 사용해 반전을 예측하고자 한다면, 이 도구는 귀하의 거래 스타일에 완벽히 적응합니다. 단순히 거래하지 말고, FX Power 로 더 스마트하게 거래하세요. 1. FX Power가 거래자에게 매우 유용한 이유 통화와 금의 실시간 강세 분석 • FX Power 는 주요 통화와 금의 상대적 강세를 계산하고 표시하여 시장 역학에 대한 명확한 통찰력을 제공합니다. • 어떤 자산이 앞서고 있고 어떤 자산이 뒤처지는지 모니터링하여 보다 현명한 거래 결정을 내릴 수 있습니다. 포괄적인 멀티 타임프레임 뷰 • 단기, 중기 및 장기 타임프레임에서 통화와 금의 강세를
Reversion King Indicator
Eugen-alexandru Zibileanu
5 (5)
새로운 왕의 등장 - 인디케이터 + 주문 관리 표시(TP1 + TP2 + TP3) + 선택형 텔레그램 시그널 전송 기능 포함 (무료) (완전한 트레이딩 및 시그널 시스템) 골드를 위한 최고의 EA: Gold Slayer 이 인디케이터는 고급 전략, 사용자 지정 가능한 주문 관리 시스템, 그리고 엔벨로프 확장을 결합한 평균 회귀(mean reversion) 시스템을 포함하고 있습니다. 또한 RSI와 같은 여러 지능형 확인 필터를 통해 높은 확률의 반전 진입 구간을 포착하여 BUY 및 SELL 시그널을 제공합니다. 단순히 거래 방법만 배우는 것이 아니라, 여러 포지션을 효과적으로 관리하고 이전에 수익 중인 오픈 포지션으로 손실 거래를 커버하는 방법까지 익힐 수 있습니다. M5 전용으로 설계 및 최적화되었으며, 유동성이 풍부해 시그널이 더 깔끔하고 신뢰도 높은 BTCUSD와 XAUUSD에서 뛰어난 성능을 발휘합니다. 이 인디케이터는 ATR 기반으로 자동 계산된 진입가, 손절가, 익절가와
MTF Supply Demand Zones MT5
Georgios Kalomoiropoulos
5 (1)
자동화된 수요 및 공급 구역의 차세대. 모든 차트에서 작동하는 새롭고 혁신적인 알고리즘. 모든 구역은 시장의 가격 움직임에 따라 동적으로 생성됩니다. 두 가지 유형의 경고 --> 1)가격이 영역에 도달할 때 2)새로운 영역이 형성될 때 당신은 더 이상 쓸모없는 지표를 얻을 수 없습니다. 입증된 결과로 완벽한 거래 전략을 얻을 수 있습니다.     새로운 기능:     가격이 공급/수요 영역에 도달하면 경고     새로운 공급/수요 구역이 생성되면 알림     푸시 알림 알림     핍의 영역 너비 레이블     기동특무부대에 한 번 더 시간이 주어집니다. 따라서 현재보다 위의 2개의 시간 프레임 대신 현재보다 높은 3개의 시간 프레임을 볼 수 있습니다.     Alerts/Zones/MTF 기능을 활성화/비활성화하는 버튼 당신이 얻는 이점:     거래에서 감정을 제거하십시오.     거래 항목을 객관화하십시오.     높은 확률 설정을 사용하여 수익
Smc Pro ToolKit
Talal N Z Aljarusha
5 (2)
SMC Pro ToolKit  is a professional chart-based Smart Money Concepts indicator for MetaTrader 5. It helps traders read market structure, identify key liquidity areas, organize trade context, and plan setups directly from the chart. This is not a simple buy/sell arrow indicator. It is a complete visual trading toolkit that combines Smart Money Concepts, multi-timeframe analysis, session context, setup planning, risk assistance, and professional dashboard tools in one clean workspace. Watch setup
Market Structure Order Block Dashboard MT5는 시장 구조와 주요 가격 반응 구역을 차트에서 직접 읽고자 하는 트레이더를 위해 설계된 MT5 지표입니다. BOS, ChoCH, 오더 블록, Fair Value Gap (FVG), 유동성, Kill Zones, Volume Profile 그리고 빠른 분석을 위한 콤팩트한 대시보드를 결합합니다. 이 지표는 시장 구조, ICT 및 Smart Money 개념을 의사결정 프레임워크로 사용하는 트레이더를 대상으로 합니다. 추세 지속, 가능한 반전, 가격 불균형, 유동성 타겟 및 관심 구역을 보다 체계적으로 식별하는 데 도움을 줄 수 있습니다. 구매자를 위한 포함 리소스 구매 후 MQL5 개인 메시지로 요청하시면 완전한 PDF 사용 설명서와 파라미터 설정 팁을 제공해 드립니다. MQL5 개인 메시지를 통한 직접 기술 지원. 1.20 버전은 두 가지 주요 추가 기능을 제공합니다: Pending BOS / Pending
필터:
리뷰 없음
리뷰 답변