STA Market Compass

  • Indicatori
  • Tang Wai Ho
    Tang Wai Ho
    I am Michael Tang, a trader, trading educator, and founder of Secret Trader Asia.
    I have been involved in the financial markets since 2015, with a strong focus on price action, market structure, risk management, trading indicators, and automated trading systems.
  • Versione: 1.10
  • Attivazioni: 5

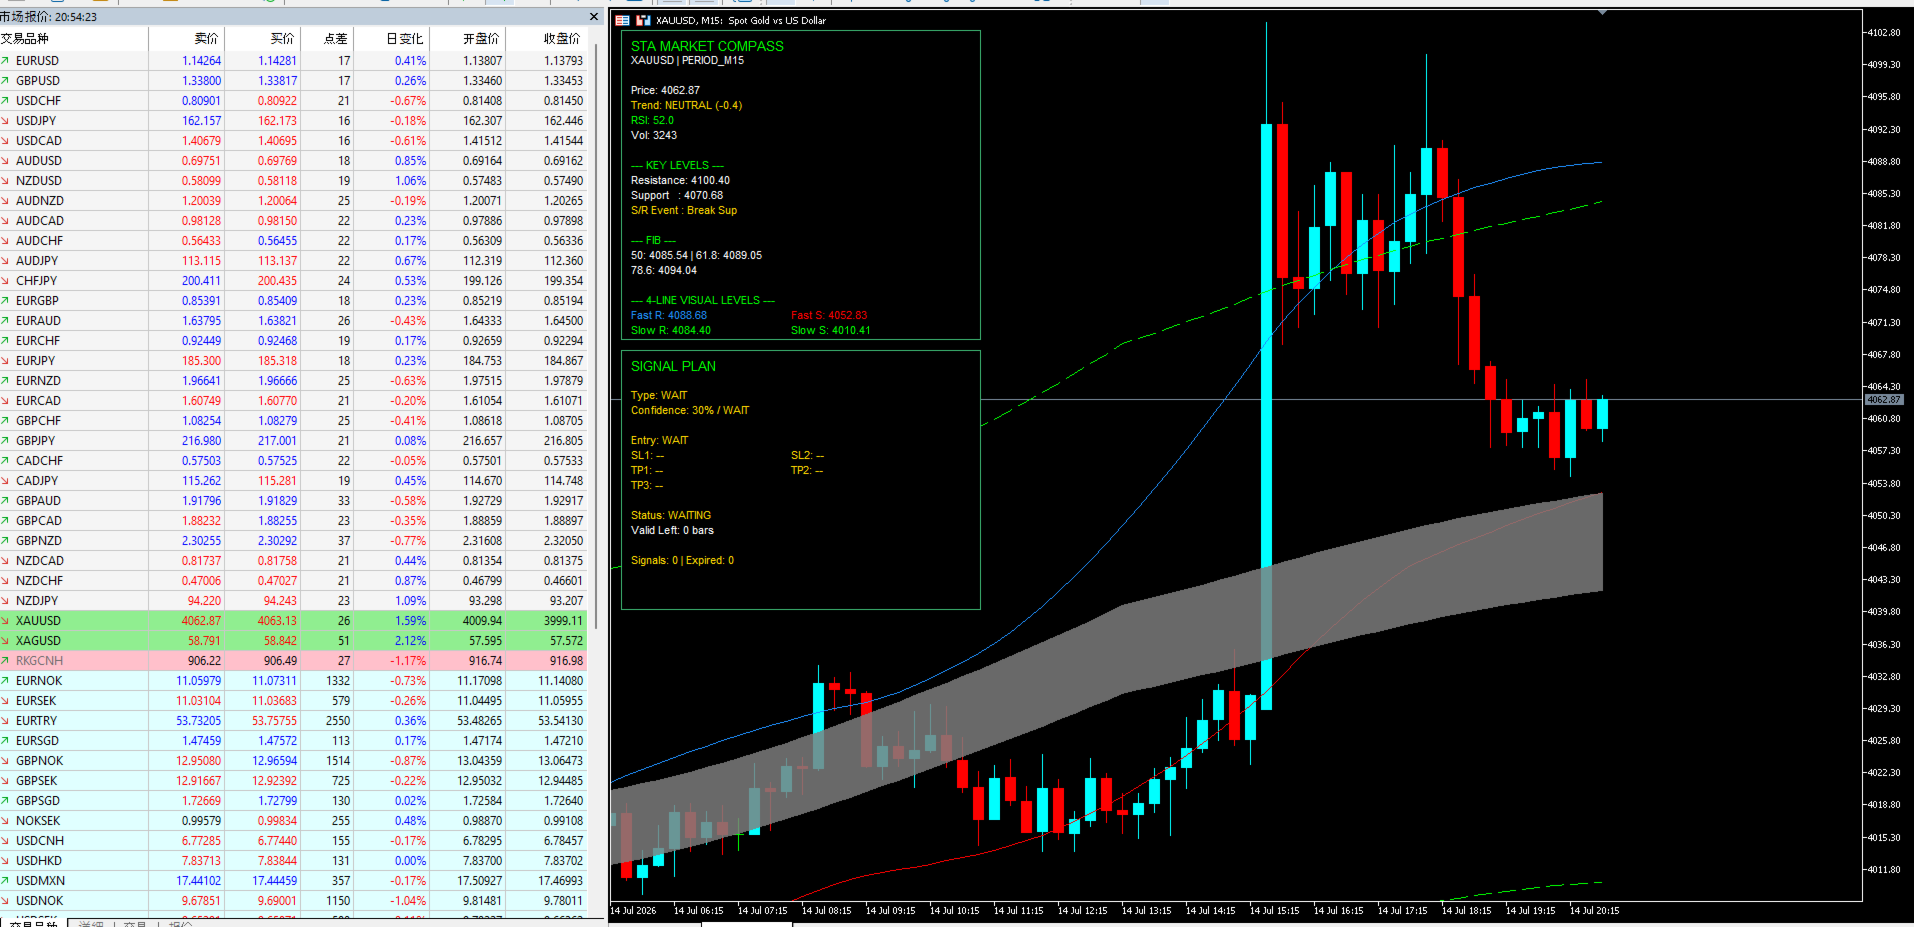
STA Market Compass is a hybrid MetaTrader 5 indicator that converts trend, market structure, momentum and key price levels into a clear manual trading plan.

OVERVIEW

STA Market Compass is designed for traders who want to understand the current market condition without using multiple indicators on the same chart.

The indicator combines:

• Trend direction
• Recent swing structure
• Support and resistance zones
• Fibonacci retracement levels
• RSI momentum
• Candlestick confirmation
• Optional tick-volume confirmation
• ATR-based entry and protection zones

The result is displayed through two responsive dashboards:

• Market Analysis Dashboard
• Signal Plan Dashboard

The indicator does not open, modify or close trades. All trading decisions and order execution remain under the user’s control.

KEY FEATURES

  1. Clear BUY, SELL or WAIT Decision

The indicator evaluates several market conditions and displays:

• BUY
• SELL
• WAIT

A signal is only generated when the calculated confidence reaches the selected minimum threshold.

When market conditions are unclear, the indicator remains in WAIT mode instead of forcing a trading signal.

  1. Confidence Score from 0% to 100%

Each potential signal receives a confidence score based on:

• Overall trend direction
• Price position near support or resistance
• Fibonacci retracement location
• RSI momentum
• Bullish or bearish candle confirmation
• Tick-volume activity

The dashboard classifies the result as:

• HIGH
• VALID
• WEAK
• WAIT

The minimum confidence level can be adjusted by the user.

  1. Complete Signal Plan

Every active signal includes:

• Entry price
• Stop Loss 1
• Stop Loss 2
• Take Profit 1
• Take Profit 2
• Take Profit 3
• Confidence percentage
• Signal status
• Remaining valid bars

The three profit targets are calculated from the selected risk-to-reward ratios.

  1. Hybrid Trend Analysis

The trend engine combines:

• Fast EMA
• Slow EMA
• RSI direction
• Current price position
• Recent swing high
• Recent swing low

The market is classified as:

• BULLISH
• BEARISH
• NEUTRAL

A BUY signal requires a bullish market condition. A SELL signal requires a bearish market condition.

  1. Automatic Support and Resistance Detection

The indicator detects recent swing highs and swing lows to calculate:

• Current resistance
• Current support
• Support zone
• Resistance zone
• Support or resistance break events

These levels are also used when calculating the signal plan.

  1. Fibonacci Retracement Analysis

The dashboard displays the main Fibonacci retracement levels calculated from the detected market structure:

• 0.0%
• 23.6%
• 38.2%
• 50.0%
• 61.8%
• 78.6%

Price reactions near the 50.0%, 61.8% and 78.6% levels can contribute to the confidence score.

  1. Dual Signal Modes

Realtime Mode

When ConfirmedMode is disabled, the indicator evaluates the current candle. This provides faster signals, but the signal conditions may change before the candle closes.

Confirmed Mode

When ConfirmedMode is enabled, the indicator evaluates the previous closed candle. This provides more stable confirmation but may produce signals later.

  1. Two Entry Methods

Close Price Entry

The entry price is based on the closing price of the evaluated candle.

Zone Price Entry

The entry price is placed near the calculated support zone for BUY signals or resistance zone for SELL signals.

  1. Two Stop Loss Levels

SL1 is the primary protection level calculated outside the current support or resistance zone.

SL2 is a wider secondary protection reference calculated from the main swing structure.

These levels are provided for planning purposes. The indicator does not automatically place orders.

  1. Three Adjustable Profit Targets

TP1, TP2 and TP3 are calculated using adjustable risk-to-reward ratios.

Default settings:

• TP1: 1.0R
• TP2: 1.5R
• TP3: 2.0R

Users can adjust each target independently.

  1. SecretTrader Four-Line Market Reference

The indicator includes a separate four-line visual system:

• Fast Lower Support
• Fast Upper Resistance
• Slow Upper Resistance
• Slow Lower Support
• Gray Balance Zone

The fast channel is designed to show shorter-term price boundaries.

The slow channel displays wider market boundaries.

The gray belt represents the central balance area between the smoothed slow high and low values.

Important: The four-line system is a visual market reference only. It is not used to generate BUY or SELL signals.

  1. Responsive Dashboard

The dashboard can automatically adapt to different chart sizes.

Available layouts:

• Automatic
• Two Panel
• Stacked
• Compact

Users can also manually adjust:

• Dashboard position
• Dashboard corner
• Panel width and height
• Font size
• Line spacing
• Column spacing
• Background color
• Border color
• Text color

  1. Market Analysis Dashboard

The Market Analysis Dashboard displays:

• Symbol and timeframe
• Current price
• Market trend
• Trend score
• RSI value
• Current tick volume
• Volume condition
• Resistance level
• Support level
• Support or resistance break event
• Fibonacci levels
• Fast channel values
• Slow channel values
• Gray balance-zone values

  1. Signal Plan Dashboard

The Signal Plan Dashboard displays:

• BUY, SELL or WAIT
• Confidence score
• Signal quality
• Entry price
• SL1
• SL2
• TP1
• TP2
• TP3
• Current signal status
• Remaining valid bars
• Total number of signals
• Number of expired signals

Possible signal statuses include:

• WAITING
• ACTIVE SIGNAL
• TP1 HIT
• TP2 HIT
• TP3 HIT
• SL1 HIT
• SL2 HIT
• EXPIRED

  1. Multiple Alert Options

The indicator supports:

• MetaTrader popup alerts
• Mobile push notifications
• Email alerts
• One alert per signal option

Each alert can include:

• Symbol
• Timeframe
• Signal direction
• Entry price
• SL1 and SL2
• TP1, TP2 and TP3
• Confidence score

Push notifications and email alerts must first be configured correctly in the MetaTrader 5 terminal.

  1. Clean Chart Design

The indicator does not use trade arrows.

Market information, signal levels and signal status are displayed inside the dashboards, while the optional four-line system provides a clean visual reference directly on the chart.

SUPPORTED MARKETS AND TIMEFRAMES

STA Market Compass operates on the symbol and timeframe of the current MetaTrader 5 chart.

It can be attached to Forex, metals, indices, cryptocurrencies and other instruments provided by the broker.

Market behaviour, volatility, tick volume and price structure differ between instruments. Users should test the settings on each preferred symbol and timeframe before using the indicator for live trading decisions.

BASIC SETUP

  1. Attach STA Market Compass to an MT5 chart.

  2. Select Realtime Mode or Confirmed Mode.

  3. Set the required minimum confidence level.

  4. Choose Close Price Entry or Zone Price Entry.

  5. Adjust the risk-to-reward ratios when required.

  6. Enable the preferred dashboard and visual channels.

  7. Configure popup, mobile or email alerts.

  8. Wait for the Signal Plan Dashboard to display an active BUY or SELL signal.

INPUT PARAMETERS

FOUR-LINE VISUAL SETTINGS

FastN — Default: 25

First smoothing period used to calculate the fast channel.

FastN1 — Default: 25

Second smoothing period applied to the fast channel.

SlowN — Default: 61

First smoothing period used to calculate the slow channel and gray balance zone.

SlowN1 — Default: 61

Second smoothing period applied to the slow channel.

SlowMultiplier — Default: 3.0

Controls how far the slow outer support and resistance lines are expanded from the gray balance zone.

ShowFastChannel — Default: true

Shows or hides the fast support and resistance lines.

ShowSlowChannel — Default: true

Shows or hides the slow support and resistance lines.

ShowGrayBelt — Default: true

Shows or hides the gray balance zone.

HistoryBars — Default: 250

Number of historical bars used to display the four-line visual system.

FastShift — Default: 0

Applies a data shift to the fast channel.

SlowShift — Default: 0

Applies a data shift to the slow channel.

GENERAL STRATEGY SETTINGS

LookbackBars — Default: 500

Number of recent bars loaded for market analysis and signal calculations.

ShowDashboard — Default: true

Shows or hides the Market Analysis and Signal Plan dashboards.

EnableAlerts — Default: true

Master control for all signal alerts.

SIGNAL SETTINGS

ConfirmedMode — Default: false

False evaluates the current candle for faster realtime signals.

True evaluates the previous closed candle for confirmed signals.

ValidBars — Default: 16

Number of chart bars for which a signal remains valid.

MinConfidence — Default: 60.0

Minimum confidence score required to generate a BUY or SELL signal. Accepted range is from 0 to 100.

TREND AND MOMENTUM SETTINGS

FastEMA — Default: 50

Period of the fast Exponential Moving Average used by the trend engine.

SlowEMA — Default: 200

Period of the slow Exponential Moving Average used by the trend engine.

RSIPeriod — Default: 14

Period of the Relative Strength Index used for momentum analysis.

MARKET STRUCTURE SETTINGS

SwingDepth — Default: 3

Number of bars required on each side when confirming a swing high or swing low.

A higher value identifies stronger but less frequent swing points.

SwingLookback — Default: 50

Number of recent bars searched when detecting support and resistance swing levels.

ATR AND PRICE-ZONE SETTINGS

ATRPeriod — Default: 14

Period of the Average True Range used to calculate price zones and protection levels.

ZoneATRMultiplier — Default: 0.30

Controls the width of support, resistance and Fibonacci tolerance zones.

SL_Buffer_ATR — Default: 0.20

Additional ATR buffer placed outside the support or resistance zone when calculating SL1.

SL2_ATR_Multiplier — Default: 1.00

ATR distance used to calculate the wider SL2 level from the main swing structure.

TAKE-PROFIT SETTINGS

TP1_RR — Default: 1.0

Risk-to-reward multiplier used to calculate Take Profit 1.

TP2_RR — Default: 1.5

Risk-to-reward multiplier used to calculate Take Profit 2.

TP3_RR — Default: 2.0

Risk-to-reward multiplier used to calculate Take Profit 3.

VOLUME SETTINGS

VolumeMAPeriod — Default: 20

Number of bars used to calculate average tick volume.

UseVolumeFilter — Default: true

When enabled, above-average tick volume can add to the confidence score.

When disabled, volume does not contribute additional confidence points.

ENTRY SETTINGS

EntryMode — Default: ENTRY_CLOSE_PRICE

ENTRY_CLOSE_PRICE uses the closing price of the evaluated candle.

ENTRY_ZONE_PRICE uses the calculated support-zone boundary for BUY signals or resistance-zone boundary for SELL signals.

COLOR SETTINGS

BuyColor — Default: Lime

Color used for bullish information and BUY signals.

SellColor — Default: Tomato

Color used for bearish information and SELL signals.

NeutralColor — Default: Gold

Color used for neutral information, waiting conditions and general references.

DashboardBgColor — Default: Black

Background color of both dashboards.

DashboardBorderColor — Default: Medium Sea Green

Border color of both dashboards.

DashboardTextColor — Default: White

Main text color used inside the dashboards.

RESPONSIVE DASHBOARD SETTINGS

DashboardLayout — Default: DASH_AUTO

DASH_AUTO automatically selects a layout based on chart width.

DASH_TWO_PANEL displays the Market and Signal dashboards as two separate panels.

DASH_STACKED places the Signal dashboard below the Market dashboard.

DASH_COMPACT uses a smaller layout for narrow chart windows.

AutoScaleDashboard — Default: true

Automatically adjusts dashboard font size according to chart width.

SmallScreenWidth — Default: 900

Chart-width threshold used to activate the Compact layout in Automatic mode.

MediumScreenWidth — Default: 1300

Chart-width threshold used to select between Stacked and Two Panel layouts in Automatic mode.

MinFontSize — Default: 7

Minimum font size used by automatic dashboard scaling.

MaxFontSize — Default: 10

Maximum font size used by automatic dashboard scaling.

MARKET DASHBOARD POSITION

MarketDashCorner — Default: 0

Chart corner used for the Market Analysis Dashboard.

Corner values:

• 0: Upper left
• 1: Upper right
• 2: Lower left
• 3: Lower right

MarketDashX — Default: 10

Horizontal distance of the Market Dashboard from the selected corner.

MarketDashY — Default: 20

Vertical distance of the Market Dashboard from the selected corner.

MarketDashWidth — Default: 360

Width of the Market Analysis Dashboard in pixels.

MarketDashHeight — Default: 330

Height of the Market Analysis Dashboard in pixels.

SIGNAL DASHBOARD POSITION

SignalDashCorner — Default: 1

Chart corner used for the Signal Plan Dashboard.

Corner values:

• 0: Upper left
• 1: Upper right
• 2: Lower left
• 3: Lower right

SignalDashX — Default: 10

Horizontal distance of the Signal Dashboard from the selected corner.

SignalDashY — Default: 20

Vertical distance of the Signal Dashboard from the selected corner.

SignalDashWidth — Default: 330

Width of the Signal Plan Dashboard in pixels.

SignalDashHeight — Default: 280

Height of the Signal Plan Dashboard in pixels.

DASHBOARD TEXT SETTINGS

DashboardFontSize — Default: 8

Base font size used by the dashboards.

DashboardLineGap — Default: 4

Vertical spacing between dashboard rows.

DashboardColumnGap — Default: 160

Horizontal spacing between dashboard columns.

ALERT SETTINGS

EnablePopupAlert — Default: true

Displays a popup alert inside MetaTrader 5 when a new signal is created.

EnablePushNotification — Default: false

Sends the signal to the MetaTrader mobile application.

MetaTrader notifications must be configured before this option can work.

EnableEmailAlert — Default: false

Sends the signal through the email system configured in MetaTrader 5.

Email settings must be configured before this option can work.

AlertOncePerSignal — Default: true

Prevents repeated alerts for the same active signal.

IMPORTANT INFORMATION

• STA Market Compass is an analytical indicator, not an Expert Advisor.

• The indicator does not automatically open, modify or close trading positions.

• Realtime signals are calculated from the current candle and may change before that candle closes.

• Confirmed Mode uses the previous closed candle but does not guarantee that every signal will be successful.

• The four-line support, resistance and balance system is for visual reference only and does not affect the signal calculation.

• Tick volume depends on the broker’s available market data.

• Entry, Stop Loss and Take Profit levels are analytical references and should be reviewed before placing any order.

• Users remain responsible for position sizing, risk management and trade execution.

RISK WARNING

Trading Forex, CFDs and other leveraged financial instruments involves substantial risk. Past market behaviour does not guarantee future results. Signals and price levels provided by this indicator are for analytical and educational purposes and should not be considered financial advice. Always test the indicator and apply appropriate risk management before using it in live trading.


Prodotti consigliati
-- Semplice ma efficace. Indicatore di inversione - Che cos'è? Un indicatore di sovrapposizione che segue il trend e combina la logica SuperTrend con la tecnologia della curva esponenziale. Rileva la direzione del trend, traccia un canale dinamico sul grafico e invia avvisi in tempo reale quando il trend si inverte. Come funziona? L'indicatore calcola una linea di base esponenziale utilizzando l'ATR e un fattore SuperTrend. Quando il prezzo chiude al di sopra o al di sotto di questa linea di
FREE
Hunttern ZigZag MT5
Hassan Gh Fakhraei
5 (1)
Hunt markets with Hunttern ZigZag . Easy to use with one parameter    You can use it for the following:       -Classic patterns       -Heads and shoulders       -Harmonic patterns       -Elliott Wave       -Support and resistance       -Supply and Demand Single parameter:      -Period (1-120) Features:        -Candle time        -Single parameter        -Light mode template This is version 1 of Hunttern ZigZag. We are very happy to receive feedback from you.
FREE
Mako VWAP
Danillo Boni Vitti
MAKO VWAP - VWAP Ancorato con Bande di Deviazione Standard e Pannello HUD IL PROBLEMA Ogni trader sa che il prezzo ruota attorno a un valore "equo", ma pochi riescono a misurarlo con chiarezza. Un VWAP semplice mostra la media ponderata per il volume, ma non dice quanto il prezzo si sia già allontanato da essa. Senza questa misura, è difficile capire se un movimento è ancora nella norma o è già esteso, e il trader finisce per comprare massimi, vendere minimi o entrare troppo tardi. Calcolare l
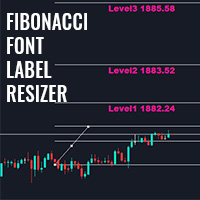
Questo indicatore ti consente di mostrare le etichette dei livelli di Fibonacci con caratteri di grandi dimensioni . Supporta fino a 25 livelli di Fibonacci - Non appena disegni Fibonacci mostra i livelli che hai aggiunto come parametro di input con caratteri di grandi dimensioni con il colore e il carattere che scegli. Opzioni personalizzabili: 1. Carattere testo Fibo 2. Dimensioni del testo Fibo 3. Colore del testo Fibo 3. Aggiungi una descrizione a ciascun livello 4. Altre opzioni com
FREE
Here I present you this awesome indicator I made. This is a nique combination witch puts you in the same level as MM's. So you can surf a lot of waves and identify the rally time, breakouts, and the perfect time to get in the market. ---- The SSL Channel is a great all-rounder based on 2 Simple Moving Averages, one of recent Highs, one of recent Lows. The calculation prints a   channel   on the chart consisting of 2 lines. This strategy gives a Long signal when price closes above the top of thes
Info:   marcobarbosabots Pivot lines are an easy way to see market trend. The indicator provides the pivot line and three first support and Resistance lines. Calculations used was: Resistance 3 = High + 2*(Pivot - Low) Resistance 2 = Pivot + (R1 - S1) Resistance 1 = 2 * Pivot - Low Pivot point = ( High + Close + Low )/3 Suport 1 = 2 * Pivot - High Suport 2 = Pivot - (R1 - S1) Suport 3 = Low - 2*(High - Pivot) You can use the calculated values ​​on an EA too, just make sure the indicator is a
This indicator automatically identifies liquidity levels using swing fractals and tracks when price sweeps through them. Works on any symbol and timeframe with full multi-timeframe support. Features: — Detects swing highs and lows via a fractal method (configurable bars left & right) on a selected timeframe. Active levels are displayed as rays extending to the right; swept levels turn into dashed lines ending at the sweep candle. — Plots Previous Day (PDhigh / PDlow), Previous Week (PWhigh / PWl
FREE
Trend Guardian Pro – Indicatore di Previsione Anticipata dei Trend Trend Guardian Pro   è il risultato della collaborazione tra un team di matematici professionisti, analisti e trader. L’indicatore è stato sviluppato sulla base di anni di analisi dei dati storici e utilizza metodi avanzati di modellazione matematica per identificare potenziali inversioni di tendenza nelle fasi iniziali. Caratteristiche Chiave: Previsione Anticipata:   analizza molteplici fattori di mercato per individuare segnal
Sviluppo della versione precedente dell'indicatore ZigZag WaveSize MT4 ZigZag WaveSize - indicatore ZigZag standard modificato con l'aggiunta di informazioni sulla lunghezza d'onda in punti, livelli e diverse logiche di allarme Miglioramenti generali: Adattamento del codice per MetaTrader 5 Lavoro ottimizzato con gli oggetti grafici Novità: Livelli orizzontali agli estremi Scelta del tipo di livelli: orizzontale/raggi/segmenti Filtro per livelli liquidi (non penetrati dal prezzo) Buffer per le
FREE
Easy Support and Resistance
Danny Giovanni Romero Lozano
EASY SUPPORT AND RESISTANCE Visualize support and resistance levels across multiple timeframes with dynamic color-coded lines Overview This powerful MT5 indicator automatically identifies and highlights key price levels by drawing rectangles on the last closed candle and its first opposite-colored candle across six different timeframes (M15, M30, H1, H2, H4, D1). The lines dynamically change color based on price action confirmation, transforming into support or resistance levels when validated
FREE
Free automatic Fibonacci is an indicator that automatically plots a Fibonacci retracement based on the number of bars you select on the BarsToScan setting in the indicator. The Fibonacci is automatically updated in real time as new highest and lowest values appears amongst the selected bars. You can select which level values to be displayed in the indicator settings. You can also select the color of the levels thus enabling the trader to be able to attach the indicator several times with differe
FREE
ADR Levels Plus
Dustin Ricardo Pierenz
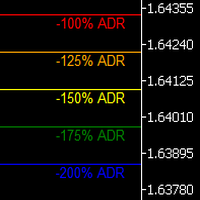
Uncover the market’s secret zones with the ADR Levels+ Indicator. This dynamic tool plots ADR extension levels at 100%, 125%, 150%, and 200% right on your chart. In most cases, price dances between these boundaries—but when it breaks out, it often signals a prime opportunity for a mean reversion trade or the start of an evolving trend. Plus, an integrated alarm system triggers as soon as these key levels are reached, ensuring you never miss a lucrative trading opportunity. Elevate your strategy
TrendDecoder Scanner MT5
Christophe Trouillas
5 (1)
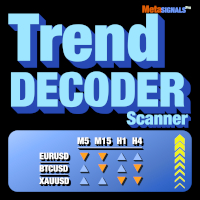
Ottenere segnali   TrendDECODER per più attività e più unità temporali | Determinare l'unità temporale migliore per entrare | Massimizzare i profitti e le operazioni vincenti Indicatore e screener non ripitturanti, non ritardati - ideale per il trading manuale e automatizzato - per tutti gli asset e tutte le unità di tempo。 $49  per le prime 50 copie - poi $99 Dopo l'acquisto per favore lascia un commento o una recensione e ti invieremo un indicatore EXTRA del valore di 99$。 Di cosa si tratta?
Asian Session Range Mapping & Fibonacci‑Based Breakout Levels Darkstone Asian Fibo Breakout is a technical market‑structure tool designed to identify the Asian session price range and display Fibonacci‑based breakout reference levels on the chart. The indicator provides a structured visual framework for traders who analyze time‑based market behavior and session‑driven volatility patterns. This tool does not generate trading signals or recommendations. It simply displays session ranges and calcul
Apex Break PRO MT5
Kestutis Balciunas
Apex Break PRO è un indicatore di rottura di linee di tendenza su pivot non ridisegnante per MetaTrader 5. Rileva massimi di pivot e minimi di pivot, traccia linee di tendenza dinamiche inclinate tra pivot consecutivi e genera segnali di acquisto e vendita quando il prezzo rompe quelle linee di tendenza alla chiusura confermata di una candela. Ogni segnale viene filtrato attraverso fino a quattro strati di confluenza indipendenti — tendenza EMA, limiti RSI, rilevamento di picchi di volume e forz
Caicai L&S Yield Histogram Important Notice: This indicator is an integral tool of the automated EA Caicai Long and Short Pair Trading . This indicator visually displays the percentage deviation (Yield %) of a pair's current spread relative to its own historical mean. It is an excellent tool for quickly visualizing the gross financial potential of a market distortion in Long & Short operations. Main Features: Percentage Visualization: Understand the size of the distortion in palpable percentage
Fibonacci Auto Levels — Smart, Automatic Fibonacci Mapping Introduction Fibonacci Auto Levels is an indicator that automatically detects key price zones and draws precise Fibonacci levels. It helps traders focus on strategy by removing the need for manual setup. Key Features - Automatic peak and trough detection based on customizable candle lookback - Classic and extended Fibonacci levels from 0.0% to 161.8%, drawn with geometric precision - Customizable visual design with adjustable colors,
FREE
FibRetrace Zones Zone di ritracciamento di Fibonacci dell'ultimo swing FibRetrace Zones è il complemento visivo gratuito dell'Expert Advisor FibRetrace. Disegna i livelli di ritracciamento di Fibonacci ed evidenzia la zona di pullback dell'ultimo swing, così vedete dove si allineano gli ingressi prima di operare. La zona è colorata in base alla direzione: verde per i setup rialzisti, rosso per quelli ribassisti. Funziona su qualsiasi simbolo e qualsiasi timeframe. CARATTERISTICHE PRINCIPALI Rile
FREE
Pare de seguir as "sardinhas" e comece a operar como big player, de forma automática. O robô Imbalance Autotrader é a mais recente tecnologia de trade que monitora os big players (grandes investidores) do mercado financeiro. Com estratégia de rompimento ( breakout ) ou pullback (Fair Value Gap FVG e Order Block) , você consegue configurar o robô para o ativo, conforme condições que você deseja operar. Além disso, o robô pode ter stops configuráveis, dinâmicos ou fixos. Na questão de gerenciamen
The   DailyWeeklyMarkers   indicator helps traders visualize trading weeks by clearly marking the start of each day and week on the chart. It draws vertical separator lines for each day (including weekends if enabled) and highlights the beginning of new trading weeks with double lines for better clarity. This makes it easier to analyze price action within daily and weekly contexts. Who Is This Indicator For? Swing Traders   – Helps identify weekly opening gaps and key levels. Day Traders   – Vis
FREE
BluePrint Adaptive Trader - Professional Trading System Advanced Channel Trading System based on our proprietary TrenderFlex PRO algorithm Learn more about TrenderFlex PRO KEY FEATURES • TrenderFlex PRO Channel Technology - Advanced channel calculation based on our proven algorithm • Adaptive Risk Management - Automatic TP/SL calculation based on channel width • Win Rate Statistics - Real-time tracking of TP1, TP2, TP3 success rates • Multi-Timeframe Analysis - Monitor 7 timeframes simultaneou
FREE
Fractal Structure Auto Fibonacci This tool is designed for price action traders and structural analysts who want to optimize their charting. It automatically identifies valid market swings using fractal logic, draws clear ZigZag lines, and automatically draws Fibonacci retracement levels for the most recent trading range. Key Features Dynamic Fractal Detection: Identifies valid swing peaks and troughs based on a user-defined review period (n). It filters out market noise and visually marks
FREE
Supertrend Volume Confirm
Isaac Alexander Pinero Garcias
DESCRIPTION Supertrend Volume Confirm — Trend Signals Confirmed by Volume and RSI Supertrend Volume Confirm is a buy/sell signal indicator based on the classic Supertrend, with two additional confirmation filters: volume and RSI. Unlike more complex multi-timeframe systems, this indicator works on a single timeframe, designed for traders who want something direct and easy to read. It works on any market symbol (forex, gold, indices, stocks, crypto) thanks to its default use of tick volume, unive
Displays trends in current chart. You can display trends of multiple timeframes in one chart by inserting this indicator as often as you want. Key features: displays trend line by finding highs and lows counts number of high/low of current trend in different color (long/short) allows you to display multiple timeframe trends in one chart Settings: Indicator Name: if you want to show M5 and H1 on one chart add TITrend twice to your current chart and rename M5 to "TITrendM5" and H1 to "TITrendH1" C
Golden Delta Library — Free MT5 Tools Market Description Short Description Golden Delta Library is a free MT5 toolkit for traders who want cleaner chart structure, Renko-based context, risk planning, and practical execution panels. Renko EDGE EA Golden Delta | Algo Trading Research Updates, research and new developments: https://www.mql5.com/en/channels/golden-delta What It Does The collection includes Renko indicators, SuperTrend / ADX Renko variants, XAUUSD helper panels, and RiskLab Trad
VibeFox ZigZag — pivot di swing con punti di ingresso su rottura e su inversione VibeFox ZigZag è un indicatore di struttura di swing in tempo reale per MetaTrader 5. Disegna la classica linea ZigZag che collega i massimi e i minimi significativi, segna il momento in cui appare un segnale di ingresso direttamente sul grafico dei prezzi e raccoglie tutti i comandi in un unico pannello interattivo moderno. Invece di scrutare il grafico in cerca di massimi e minimi, vedete la struttura del mercato
AlgoChamp v3 PLUS AlgoChamp v3 PLUS is an simple indicator designed to provide traders with clear market view at a very low cost . More AlgoChamp products and updates are currently in development. An automated trading solution is also planned for a future release. Features trend clouds Candle coloring EMA 21, 50, 100 and 200 overlays Take Profit markers max momentum tracking Customizable chart components Compatible with all supported trading instruments and timeframes How to Use Attach AlgoChamp
Auto Fib Retracements
Ross Adam Langlands Nelson
4.2 (5)
Automatic Fibonacci Retracement Line Indicator. This indicator takes the current trend and if possible draws Fibonacci retracement lines from the swing until the current price. The Fibonacci levels used are: 0%, 23.6%, 38.2%, 50%, 61.8%, 76.4%, 100%. This indicator works for all charts over all timeframes. The Fibonacci levels are also recorded in buffers for use by other trading bots. Any comments, concerns or additional feature requirements are welcome and will be addressed promptly. 
FREE
Babel Assistant
Iurii Bazhanov
4.33 (9)
Babel assistant 1 Il robot di netting per MT5 "Babel_assistant_1" utilizza l'indicatore ZigZag per generare livelli di Fibonacci su vari timeframe (M1, M5, M15, H1, H4, D1 e W1) e calcola la forza delle tendenze di acquisto e vendita. Apre una posizione utilizzando l'impostazione "Lot for open a position" se viene superato il livello di tendenza specificato di 4,925. Dopodiché, Babel posiziona ordini pendenti su determinati livelli di Fibonacci e imposta le linee di Stop Loss e Take Profit speci
FREE
LevelsFib DTZ
Vitaliy Davydov
The combined Levels Ib DTZ indicator helps to determine the trend direction when trading. Displaying signals on the chart about a possible upcoming trend change. The indicator is a combination of Fibonacci levels with overbought and oversold zones and a trend indicator based on ZigZag and ATR indicators. The Levels Ib DTZ indicator helps traders predict future price movements and adjust their strategy accordingly. It works on all timeframes.
Gli utenti di questo prodotto hanno anche acquistato
Trend Sniper X
Sarvarbek Abduvoxobov
4.9 (41)
Trend Sniper X è un indicatore trend-following multi-timeframe per MetaTrader 5 che aiuta i trader a identificare la direzione del trend e i potenziali punti di inversione con chiarezza e precisione. per MT4: https://www.mql5.com/en/market/product/193245 Informazioni sul prezzo: Il prezzo attuale è promozionale ed è soggetto a modifiche con il rilascio di futuri aggiornamenti e nuove funzionalità. Offerta Bonus: Per ricevere GRATIS l'Auto-Trade Assistant EA per questo indicatore, invia un messa
Smart Trend Trading System — MetaTrader 5 Dopo l'acquisto, inviami un messaggio su MQL5 per ricevere GRATUITAMENTE Smart Universal Expert Advisor, insieme al corso online, al manuale PDF e all'accesso al gruppo privato. STTS riunisce la direzione del trend, i segnali di entrata e uscita, le zone di inversione e i livelli di prezzo importanti direttamente sul grafico. Segui il sistema manualmente oppure collega un EA compatibile separato per eseguire le operazioni automaticamente con le impostazi
Zoryk Gold
Reda El Koutbane
4.76 (17)
ZORYK — Sistema avanzato di segnali XAUUSD per MetaTrader 5 Conosci sicuramente questa sensazione. Passi molto tempo ad analizzare l’oro. Aspetti il punto d’ingresso corretto. Finalmente apri l’operazione e il prezzo inizia immediatamente a muoversi contro di te. Chiudi troppo presto, sposti lo Stop Loss o esiti per alcuni secondi. Successivamente il mercato raggiunge esattamente l’obiettivo che avevi previsto inizialmente, ma senza di te nella posizione. Il problema non era sempre la direzione.
SuperScalp Pro
Van Minh Nguyen
4.56 (36)
SuperScalp Pro - Professional Multi-Layer Confluence Scalping System SuperScalp Pro è un indicatore avanzato per lo scalping che migliora il Supertrend classico attraverso diversi filtri intelligenti di conferma. Aiuta a identificare opportunità di Buy/Sell con una probabilità maggiore, riducendo significativamente i falsi segnali. Le frecce Buy e Sell vengono visualizzate direttamente sul grafico, mentre i livelli di Stop Loss e Take Profit basati sull’ATR vengono calcolati automaticamente in t
Un nuovo Re in città - Indicatore + Gestione ordini (TP1 + TP2 + TP3) + Invio opzionale di segnali Telegram INCLUSO (GRATIS) (SISTEMA COMPLETO DI TRADING e SEGNALI) Il nostro miglior EA per l’Oro: Gold Slayer Questo indicatore include una strategia avanzata, un sistema di trading con gestione ordini personalizzabile e un sistema mean reversion che combina estensioni di envelope, supportato da molteplici filtri intelligenti di conferma come RSI per individuare ingressi di inversione ad alta proba
SMC Intraday Formula
VividMind Digital Solutions
5 (26)
Cominciamo con la verità. Nessun indicatore da solo ti renderà profittevole. Se qualcuno ti dice il contrario, ti sta vendendo un sogno. Qualsiasi indicatore che mostra frecce perfette di acquisto/vendita può essere reso impeccabile — basta ingrandire la giusta sezione della storia e catturare solo i trade vincenti. Noi non lo facciamo.  SMC Intraday Formula è uno strumento. Legge la struttura del mercato per te, identifica le zone a più alta probabilità e ti mostra esattamente come appare la t
GoldenX Entry MT5
VividMind Digital Solutions
5 (16)
GoldenX Entry è un indicatore per MT5 con un algoritmo adattivo Smart Entry Trend, un sistema di scoring dei segnali, un rilevatore del regime di mercato e un filtro di volatilità. Ogni segnale include un livello di ingresso calcolato, tre livelli di Take-Profit (TP1, TP2, TP3) e un livello di Stop-Loss. È costruito su più livelli analitici progettati per adattarsi a diverse condizioni di mercato, combinando un sistema analitico multilivello con un ottimizzatore integrato e un sistema di traccia
M5 Sniper
MeanFX
5 (3)
Porta il tuo vantaggio nel trading sotto i riflettori! M5 Sniper è un nuovo indicatore di MeanFX. Combina segnali di trading precisi con livelli TP/SL adattivi , creando così le migliori operazioni statistiche possibili! Il prezzo aumenta ogni 5 acquisti, il prossimo prezzo è di 69$ Scrivimi dopo l'acquisto per ricevere consigli/guida e un EA bonus Cosa lo rende diverso? Performance statistica comprovata su Gold XAUUSD ( funziona su quasi ogni asset , concentrandosi sulla padronanza di un singol
La leggenda ritorna: Entry Points Pro 10. Il rilancio del leggendario indicatore che per 3 anni è rimasto nella Top-3 del MQL5 Market. Centinaia di recensioni entusiaste (589 su due versioni), migliaia di trader lo usano ogni giorno per operare, 31.000+ download della demo   MT4+MT5 . Ho letto ogni vostra recensione degli ultimi cinque anni — e invece di promesse ho inserito nella versione 10 le risposte. Dall'autore che opera sui mercati dal 1999 e tiene all'onestà, alla propria reputazione e a
Adaptive Price Action Engine Acquista un indicatore, ricevi l'EA gratis Analisi Auto-Ottimizzata del Trend e dei Pattern Candlestick Multi-Timeframe I mercati cambiano continuamente e non tutti i pattern di Price Action hanno lo stesso valore in ogni condizione di mercato. Adaptive Price Action Engine è progettato per adattarsi alle condizioni di mercato in continua evoluzione, combinando struttura del trend, analisi Multi-Timeframe, pattern Candlestick e ottimizzazione statistica in un unico fr
Neuro Poseidon MT5
Daria Rezueva
4.75 (52)
Neuro Poseidon is a new indicator by Daria Rezueva. It combines precise trading signals with adaptive TP/SL levels - creating best possible trades as a result! Message me and get  Neuro Poseidon Assistant  as a gift to automize your trading process! What makes it stand out? 1. Proven profitability on all assets and timeframes 2. Only confirmed BUY and SELL signals present on the chart 3. Adaptive TP & SL levels generated by the software for each trade 4. Easy to understand - suitable for al
Auto Optimized SpeedAngle è un sistema di vettorizzazione del momento di livello istituzionale che elimina l'overfitting ( curve-fitting ) attraverso l'ottimizzazione continua Walk-Forward (WFO). Invece di affidarsi a input statici che si degradano quando i regimi di mercato cambiano, l'indicatore recalibra dinamicamente i suoi parametri utilizzando la validazione Out-of-Sample (OOS), assicurando che i segnali visualizzati rappresentino reali vantaggi statistici anziché anomalie storiche. Quadro
M1 Sniper MT5
Oleg Rodin
5 (7)
M1 SNIPER   è un sistema di indicatori di trading facile da usare. Si tratta di un indicatore a freccia progettato per l'intervallo temporale M1. L'indicatore può essere utilizzato come sistema autonomo per lo scalping sull'intervallo temporale M1 e come parte del tuo sistema di trading esistente. Sebbene questo sistema di trading sia stato progettato specificamente per il trading sull'intervallo temporale M1, può comunque essere utilizzato anche con altri intervalli temporali. Inizialmente ho p
Gann Made Easy è un sistema di trading Forex professionale e facile da usare che si basa sui migliori principi del trading utilizzando la teoria di mr. WD Gann. L'indicatore fornisce segnali ACQUISTA e VENDI accurati, inclusi i livelli di Stop Loss e Take Profit. Puoi fare trading anche in movimento utilizzando le notifiche PUSH. CONTATTAMI DOPO L'ACQUISTO PER RICEVERE GRATUITAMENTE LE ISTRUZIONI DI TRADING E OTTIMI INDICATORI EXTRA! Probabilmente hai già sentito parlare molte volte dei metodi d
ARIPoint
Temirlan Kdyrkhan
1 (4)
ARIPoint is a powerful trading companion designed to generate high-probability entry signals with dynamic TP/SL/DP levels based on volatility. Built-in performance tracking shows win/loss stats, PP1/PP2 hits, and success rates all updated live. Key Features: Buy/Sell signals with adaptive volatility bands Real-time TP/SL/DP levels based on ATR Built-in MA Filter with optional ATR/StdDev volatility Performance stats panel (Success, Profit/Loss, PP1/PP2) Alerts via popup, sound, push, or email Cu
Scalper Vault   è un sistema di scalping professionale che ti fornisce tutto il necessario per scalping di successo. Questo indicatore è un sistema di trading completo che può essere utilizzato dai trader di forex e opzioni binarie. L'intervallo di tempo consigliato è M5. Il sistema fornisce segnali di freccia accurati nella direzione della tendenza. Ti fornisce anche i segnali più alti e più bassi e i livelli di mercato di Gann. Gli indicatori forniscono tutti i tipi di avvisi, comprese le noti
Ciao a tutti i trader! Molti investitori individuali utilizzano script web lenti. Un approccio sistematico è essenziale per un trading redditizio. L'indicatore Astro AI non è semplicemente una visualizzazione su un grafico. Si tratta di una sofisticata rete neurale composta da due agenti che operano direttamente all'interno del terminale. Dettagli tecnici del sistema: 1. Agente 1: Analista (Rete neurale grafica – GNN) Il mercato non è costituito da singole barre di prezzo, ma da una rete di
Divergence Bomber
Ihor Otkydach
4.89 (94)
Ogni acquirente dell’indicatore riceverà inoltre gratuitamente: L’utilità esclusiva “Bomber Utility”, che gestisce automaticamente ogni operazione, imposta i livelli di Stop Loss e Take Profit e chiude le posizioni secondo le regole della strategia I file di configurazione (set file) per adattare l’indicatore a diversi asset I set file per configurare il Bomber Utility in tre modalità: “Rischio Minimo”, “Rischio Bilanciato” e “Strategia di Attesa” Una guida video passo-passo per installare, con
Tokyo mt5 Indicator
Vasiliy Strukov
5 (10)
Il Tokyo Indicator offre una chiara panoramica visiva della direzione del trend, dei potenziali segnali di trading e delle condizioni di mercato. La sua linea di trend a gradini, codificata a colori, distingue le fasi rialziste (in blu) da quelle ribassiste (in magenta). Frecce direzionali dedicate evidenziano potenziali opportunità di acquisto e vendita al variare del trend visualizzato. Una dashboard integrata riunisce in un'unica visualizzazione pratica il segnale corrente, il bias di mercato
Welcome to ENTRY IN THE ZONE AND SMC MULTI TIMEFRAME  Entry In The Zone and SMC Multi Timeframe is a real-time market analysis tool based on Smart Money Concepts (SMC), designed to analyze market structure, price direction, and key trading zones. It supports both Single-Timeframe and Multi-Timeframe Analysis, providing a clearer view of overall market structure across multiple timeframes, with real-time BUY / SELL signals designed with a strict focus on No-Repaint principles. The signals are des
Quantum TrendPulse
Bogdan Ion Puscasu
5 (26)
Ecco   Quantum TrendPulse   , lo strumento di trading definitivo che combina la potenza di   SuperTrend   ,   RSI   e   Stocastico   in un unico indicatore completo per massimizzare il tuo potenziale di trading. Progettato per i trader che cercano precisione ed efficienza, questo indicatore ti aiuta a identificare con sicurezza le tendenze di mercato, i cambiamenti di momentum e i punti di entrata e uscita ottimali. Caratteristiche principali: Integrazione SuperTrend:   segui facilmente l'andame
Trend Catcher ind mt5
Ramil Minniakhmetov
5 (18)
INDICATORE TREND CATCHER L'indicatore Trend Catcher analizza i movimenti dei prezzi di mercato, utilizzando una combinazione di indicatori di analisi del trend proprietari dell'autore e personalizzati. Identifica la vera direzione del mercato filtrando il rumore a breve termine e concentrandosi sulla forza del momentum sottostante, sull'espansione della volatilità e sul comportamento della struttura dei prezzi. Utilizza inoltre una combinazione di indicatori personalizzati di smoothing e filtr
RelicusRoad Pro MT5
Relicus LLC
4.96 (25)
Basta andare a intuito nei tuoi trade. Sai quando entrare, dove uscire e da che parte va il mercato, tutto su un solo grafico. RelicusRoad Pro riunisce quasi venti strumenti in un unico indicatore, e attivi quelli che si adattano al tuo modo di operare. Ingressi chiari. Uscite chiare. Un piano su ogni grafico. Ti suona familiare? Compri, e un minuto dopo il prezzo ti va contro. Chiudi troppo presto, poi guardi il movimento proseguire senza di te. Cinque indicatori sul grafico, cinque risposte di
Unix Scalper
Issam Kassas
4 (4)
Unix Scalper — MetaTrader 5 Dopo l'acquisto, inviami un messaggio su MQL5 per ricevere GRATUITAMENTE Smart Universal Expert Advisor, insieme al corso online, al manuale PDF e all'accesso al gruppo privato. Individua il setup. Esamina il piano. Scegli come operare. UNIX Scalper riunisce analisi di mercato, indicazioni BUY/SELL/WAIT e livelli Entry, Stop Loss, TP1 e TP2 in un unico pannello organizzato. VISUALIZZA IL SEGNALE E IL PIANO • Indicazioni chiare: BUY, SELL o WAIT. • Livelli definiti: E
Gold Trend Coach MT5
Cristhian Alexander Gaibor Cuasquer
5 (1)
Gold Trend Coach è un indicatore di trend per l'oro (XAUUSD) su MetaTrader 5 con segnali di acquisto e vendita, stop loss e tre obiettivi di take profit, confermati alla chiusura della candela, una dashboard coach multi-timeframe e avvisi sul tuo telefono e su Telegram. Costruito per lo scalping su M5 e l'intraday su M15 durante le sessioni di Londra e New York. Gold Trend Coach: segnali di trend sull'oro XAUUSD con ingresso, stop e tre obiettivi. Prezzo di lancio $39 per le prime 20 copie, poi
Market Structure Order Block Dashboard MT5 è un indicatore MT5 progettato per i trader che vogliono leggere la struttura di mercato e le principali zone di reazione del prezzo direttamente sul grafico. Combina BOS, ChoCH, Order Blocks, Fair Value Gaps (FVG), Liquidità, Kill Zones, Volume Profile e un pannello compatto per un'analisi rapida. Questo indicatore è rivolto ai trader che utilizzano la struttura di mercato, i concetti ICT e Smart Money come quadro decisionale. Può aiutare a individuare
FiboSniper Pro
Van Minh Nguyen
5 (3)
FiboSniper Pro – Multi-Filter Fibonacci System with Auto SL/TP and Control Panel FiboSniper Pro è un indicatore tecnico che combina Fibonacci Envelopes dinamici con diversi filtri di conferma per generare segnali Buy e Sell selezionati. I livelli di Fibonacci vengono calcolati sulla base di Moving Average e ATR e successivamente filtrati tramite ADX, EMA, RSI, ATR, Volume, Time e struttura delle candele. L’indicatore visualizza direttamente sul grafico i livelli automatici di Stop Loss e Take Pr
Presentazione       Quantum Breakout PRO   , l'innovativo indicatore MQL5 che sta trasformando il modo in cui scambi le zone di breakout! Sviluppato da un team di trader esperti con un'esperienza di trading di oltre 13 anni,       Quantum Breakout PRO       è progettato per spingere il tuo viaggio di trading a nuovi livelli con la sua strategia innovativa e dinamica della zona di breakout. Quantum Breakout Indicator ti fornirà frecce di segnalazione sulle zone di breakout con 5 zone target di
Volatility Master for MetaTrader is a real-time dashboard tool that scans up to  50 symbols  to identify high-volatility , trending markets instantly. With bullish/bearish signals, customizable alerts, and a user-friendly interface, it helps you avoid range-bound conditions and focus on high-probability trades. Clarity leads to confidence. Trade confidently and protect your capital effectively with this powerful dashboard. We don't offer free or bonus indicators in exchange of reviews from you.
FX Trend MT5 NG
Daniel Stein
5 (6)
FX Trend NG: La Nuova Generazione di Intelligenza di Trend Multi-Mercato Panoramica FX Trend NG è uno strumento professionale di analisi del trend multi-timeframe e monitoraggio dei mercati. Ti consente di comprendere la struttura completa del mercato in pochi secondi. Invece di passare tra numerosi grafici, puoi identificare immediatamente quali strumenti sono in trend, dove il momentum sta diminuendo e dove esiste un forte allineamento tra i timeframe. Offerta di Lancio – Ottieni FX Trend NG
Altri dall’autore
Directional Layering Directional Layering is an automated Expert Advisor for MetaTrader 5 designed around trend-following, pullback entries, controlled position layering, basket management, and a one-time recovery hedge. The EA first identifies the main market direction using two Exponential Moving Averages on a higher timeframe. It then waits for a pullback on the entry timeframe before opening the initial position. Instead of opening multiple positions immediately, additional positions are
Filtro:
Nessuna recensione
Rispondi alla recensione