STA Market Compass
- Индикаторы
-
Tang Wai Ho
 I am Michael Tang, a trader, trading educator, and founder of Secret Trader Asia.
I have been involved in the financial markets since 2015, with a strong focus on price action, market structure, risk management, trading indicators, and automated trading systems. - Версия: 1.10
- Активации: 5
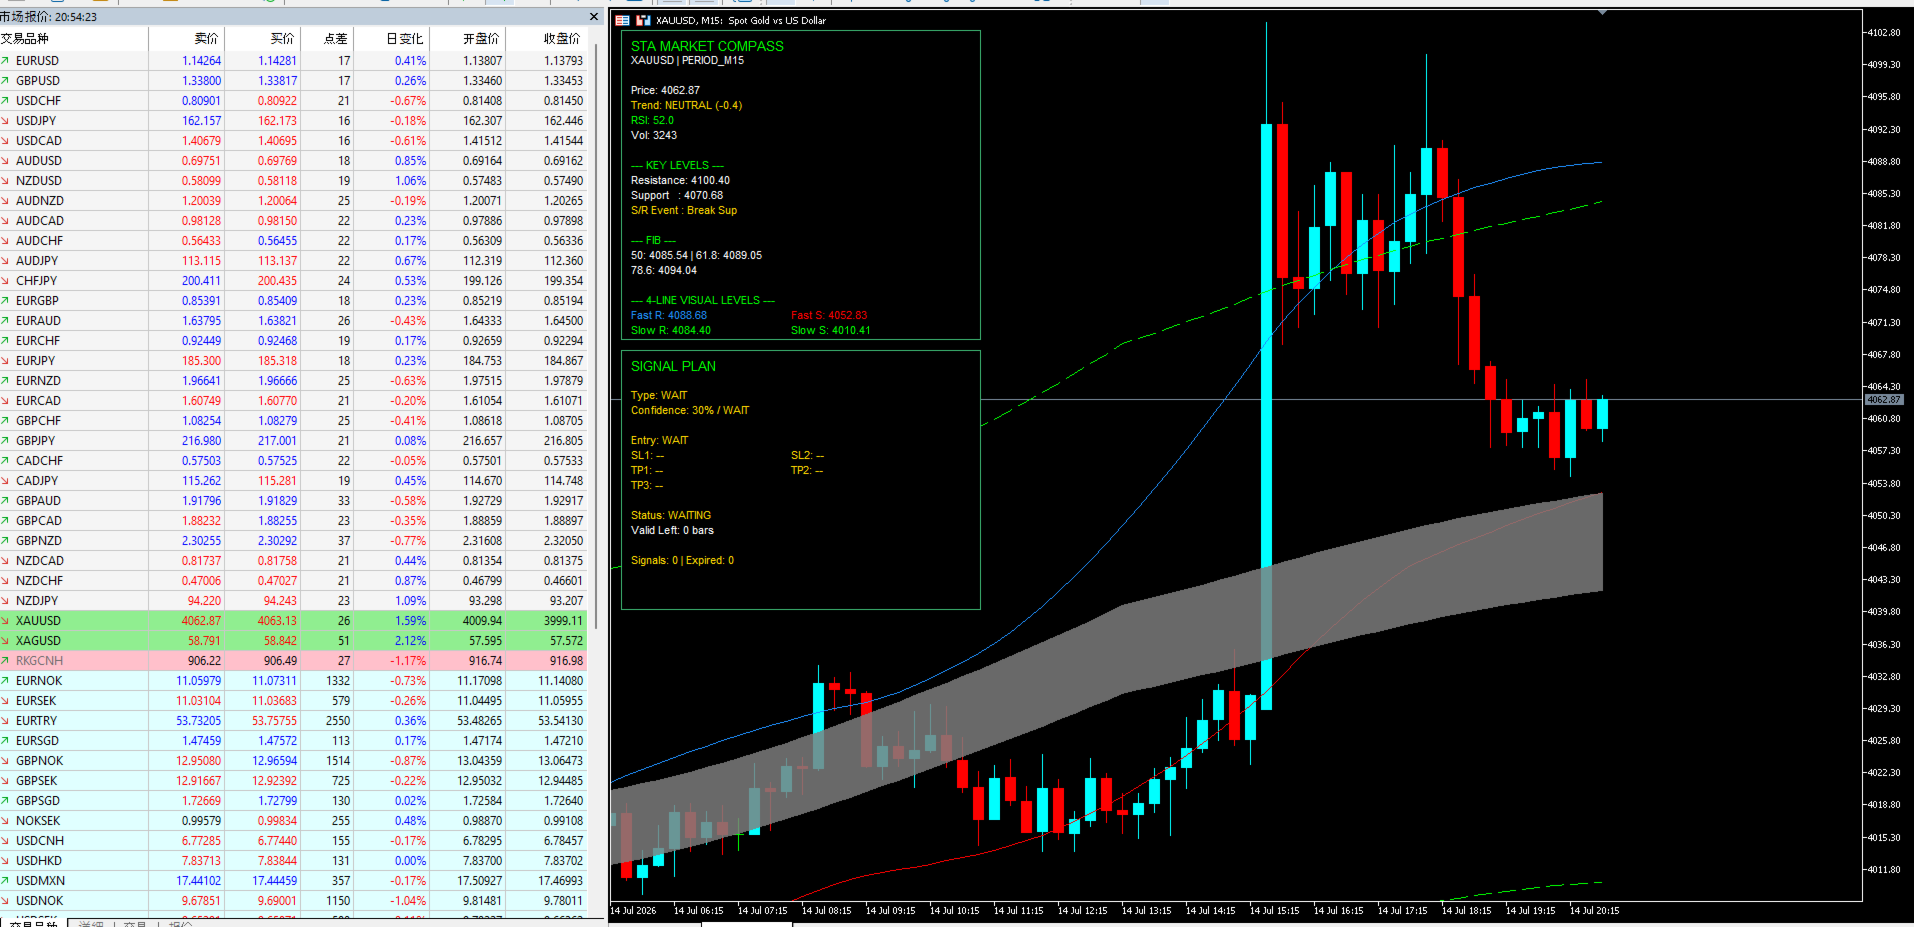
STA Market Compass is a hybrid MetaTrader 5 indicator that converts trend, market structure, momentum and key price levels into a clear manual trading plan.
OVERVIEW
STA Market Compass is designed for traders who want to understand the current market condition without using multiple indicators on the same chart.
The indicator combines:
• Trend direction
• Recent swing structure
• Support and resistance zones
• Fibonacci retracement levels
• RSI momentum
• Candlestick confirmation
• Optional tick-volume confirmation
• ATR-based entry and protection zones
The result is displayed through two responsive dashboards:
• Market Analysis Dashboard
• Signal Plan Dashboard
The indicator does not open, modify or close trades. All trading decisions and order execution remain under the user’s control.
KEY FEATURES
-
Clear BUY, SELL or WAIT Decision
The indicator evaluates several market conditions and displays:
• BUY
• SELL
• WAIT
A signal is only generated when the calculated confidence reaches the selected minimum threshold.
When market conditions are unclear, the indicator remains in WAIT mode instead of forcing a trading signal.
-
Confidence Score from 0% to 100%
Each potential signal receives a confidence score based on:
• Overall trend direction
• Price position near support or resistance
• Fibonacci retracement location
• RSI momentum
• Bullish or bearish candle confirmation
• Tick-volume activity
The dashboard classifies the result as:
• HIGH
• VALID
• WEAK
• WAIT
The minimum confidence level can be adjusted by the user.
-
Complete Signal Plan
Every active signal includes:
• Entry price
• Stop Loss 1
• Stop Loss 2
• Take Profit 1
• Take Profit 2
• Take Profit 3
• Confidence percentage
• Signal status
• Remaining valid bars
The three profit targets are calculated from the selected risk-to-reward ratios.
-
Hybrid Trend Analysis
The trend engine combines:
• Fast EMA
• Slow EMA
• RSI direction
• Current price position
• Recent swing high
• Recent swing low
The market is classified as:
• BULLISH
• BEARISH
• NEUTRAL
A BUY signal requires a bullish market condition. A SELL signal requires a bearish market condition.
-
Automatic Support and Resistance Detection
The indicator detects recent swing highs and swing lows to calculate:
• Current resistance
• Current support
• Support zone
• Resistance zone
• Support or resistance break events
These levels are also used when calculating the signal plan.
-
Fibonacci Retracement Analysis
The dashboard displays the main Fibonacci retracement levels calculated from the detected market structure:
• 0.0%
• 23.6%
• 38.2%
• 50.0%
• 61.8%
• 78.6%
Price reactions near the 50.0%, 61.8% and 78.6% levels can contribute to the confidence score.
-
Dual Signal Modes
Realtime Mode
When ConfirmedMode is disabled, the indicator evaluates the current candle. This provides faster signals, but the signal conditions may change before the candle closes.
Confirmed Mode
When ConfirmedMode is enabled, the indicator evaluates the previous closed candle. This provides more stable confirmation but may produce signals later.
-
Two Entry Methods
Close Price Entry
The entry price is based on the closing price of the evaluated candle.
Zone Price Entry
The entry price is placed near the calculated support zone for BUY signals or resistance zone for SELL signals.
-
Two Stop Loss Levels
SL1 is the primary protection level calculated outside the current support or resistance zone.
SL2 is a wider secondary protection reference calculated from the main swing structure.
These levels are provided for planning purposes. The indicator does not automatically place orders.
-
Three Adjustable Profit Targets
TP1, TP2 and TP3 are calculated using adjustable risk-to-reward ratios.
Default settings:
• TP1: 1.0R
• TP2: 1.5R
• TP3: 2.0R
Users can adjust each target independently.
-
SecretTrader Four-Line Market Reference
The indicator includes a separate four-line visual system:
• Fast Lower Support
• Fast Upper Resistance
• Slow Upper Resistance
• Slow Lower Support
• Gray Balance Zone
The fast channel is designed to show shorter-term price boundaries.
The slow channel displays wider market boundaries.
The gray belt represents the central balance area between the smoothed slow high and low values.
Important: The four-line system is a visual market reference only. It is not used to generate BUY or SELL signals.
-
Responsive Dashboard
The dashboard can automatically adapt to different chart sizes.
Available layouts:
• Automatic
• Two Panel
• Stacked
• Compact
Users can also manually adjust:
• Dashboard position
• Dashboard corner
• Panel width and height
• Font size
• Line spacing
• Column spacing
• Background color
• Border color
• Text color
-
Market Analysis Dashboard
The Market Analysis Dashboard displays:
• Symbol and timeframe
• Current price
• Market trend
• Trend score
• RSI value
• Current tick volume
• Volume condition
• Resistance level
• Support level
• Support or resistance break event
• Fibonacci levels
• Fast channel values
• Slow channel values
• Gray balance-zone values
-
Signal Plan Dashboard
The Signal Plan Dashboard displays:
• BUY, SELL or WAIT
• Confidence score
• Signal quality
• Entry price
• SL1
• SL2
• TP1
• TP2
• TP3
• Current signal status
• Remaining valid bars
• Total number of signals
• Number of expired signals
Possible signal statuses include:
• WAITING
• ACTIVE SIGNAL
• TP1 HIT
• TP2 HIT
• TP3 HIT
• SL1 HIT
• SL2 HIT
• EXPIRED
-
Multiple Alert Options
The indicator supports:
• MetaTrader popup alerts
• Mobile push notifications
• Email alerts
• One alert per signal option
Each alert can include:
• Symbol
• Timeframe
• Signal direction
• Entry price
• SL1 and SL2
• TP1, TP2 and TP3
• Confidence score
Push notifications and email alerts must first be configured correctly in the MetaTrader 5 terminal.
-
Clean Chart Design
The indicator does not use trade arrows.
Market information, signal levels and signal status are displayed inside the dashboards, while the optional four-line system provides a clean visual reference directly on the chart.
SUPPORTED MARKETS AND TIMEFRAMES
STA Market Compass operates on the symbol and timeframe of the current MetaTrader 5 chart.
It can be attached to Forex, metals, indices, cryptocurrencies and other instruments provided by the broker.
Market behaviour, volatility, tick volume and price structure differ between instruments. Users should test the settings on each preferred symbol and timeframe before using the indicator for live trading decisions.
BASIC SETUP
-
Attach STA Market Compass to an MT5 chart.
-
Select Realtime Mode or Confirmed Mode.
-
Set the required minimum confidence level.
-
Choose Close Price Entry or Zone Price Entry.
-
Adjust the risk-to-reward ratios when required.
-
Enable the preferred dashboard and visual channels.
-
Configure popup, mobile or email alerts.
-
Wait for the Signal Plan Dashboard to display an active BUY or SELL signal.
INPUT PARAMETERS
FOUR-LINE VISUAL SETTINGS
FastN — Default: 25
First smoothing period used to calculate the fast channel.
FastN1 — Default: 25
Second smoothing period applied to the fast channel.
SlowN — Default: 61
First smoothing period used to calculate the slow channel and gray balance zone.
SlowN1 — Default: 61
Second smoothing period applied to the slow channel.
SlowMultiplier — Default: 3.0
Controls how far the slow outer support and resistance lines are expanded from the gray balance zone.
ShowFastChannel — Default: true
Shows or hides the fast support and resistance lines.
ShowSlowChannel — Default: true
Shows or hides the slow support and resistance lines.
ShowGrayBelt — Default: true
Shows or hides the gray balance zone.
HistoryBars — Default: 250
Number of historical bars used to display the four-line visual system.
FastShift — Default: 0
Applies a data shift to the fast channel.
SlowShift — Default: 0
Applies a data shift to the slow channel.
GENERAL STRATEGY SETTINGS
LookbackBars — Default: 500
Number of recent bars loaded for market analysis and signal calculations.
ShowDashboard — Default: true
Shows or hides the Market Analysis and Signal Plan dashboards.
EnableAlerts — Default: true
Master control for all signal alerts.
SIGNAL SETTINGS
ConfirmedMode — Default: false
False evaluates the current candle for faster realtime signals.
True evaluates the previous closed candle for confirmed signals.
ValidBars — Default: 16
Number of chart bars for which a signal remains valid.
MinConfidence — Default: 60.0
Minimum confidence score required to generate a BUY or SELL signal. Accepted range is from 0 to 100.
TREND AND MOMENTUM SETTINGS
FastEMA — Default: 50
Period of the fast Exponential Moving Average used by the trend engine.
SlowEMA — Default: 200
Period of the slow Exponential Moving Average used by the trend engine.
RSIPeriod — Default: 14
Period of the Relative Strength Index used for momentum analysis.
MARKET STRUCTURE SETTINGS
SwingDepth — Default: 3
Number of bars required on each side when confirming a swing high or swing low.
A higher value identifies stronger but less frequent swing points.
SwingLookback — Default: 50
Number of recent bars searched when detecting support and resistance swing levels.
ATR AND PRICE-ZONE SETTINGS
ATRPeriod — Default: 14
Period of the Average True Range used to calculate price zones and protection levels.
ZoneATRMultiplier — Default: 0.30
Controls the width of support, resistance and Fibonacci tolerance zones.
SL_Buffer_ATR — Default: 0.20
Additional ATR buffer placed outside the support or resistance zone when calculating SL1.
SL2_ATR_Multiplier — Default: 1.00
ATR distance used to calculate the wider SL2 level from the main swing structure.
TAKE-PROFIT SETTINGS
TP1_RR — Default: 1.0
Risk-to-reward multiplier used to calculate Take Profit 1.
TP2_RR — Default: 1.5
Risk-to-reward multiplier used to calculate Take Profit 2.
TP3_RR — Default: 2.0
Risk-to-reward multiplier used to calculate Take Profit 3.
VOLUME SETTINGS
VolumeMAPeriod — Default: 20
Number of bars used to calculate average tick volume.
UseVolumeFilter — Default: true
When enabled, above-average tick volume can add to the confidence score.
When disabled, volume does not contribute additional confidence points.
ENTRY SETTINGS
EntryMode — Default: ENTRY_CLOSE_PRICE
ENTRY_CLOSE_PRICE uses the closing price of the evaluated candle.
ENTRY_ZONE_PRICE uses the calculated support-zone boundary for BUY signals or resistance-zone boundary for SELL signals.
COLOR SETTINGS
BuyColor — Default: Lime
Color used for bullish information and BUY signals.
SellColor — Default: Tomato
Color used for bearish information and SELL signals.
NeutralColor — Default: Gold
Color used for neutral information, waiting conditions and general references.
DashboardBgColor — Default: Black
Background color of both dashboards.
DashboardBorderColor — Default: Medium Sea Green
Border color of both dashboards.
DashboardTextColor — Default: White
Main text color used inside the dashboards.
RESPONSIVE DASHBOARD SETTINGS
DashboardLayout — Default: DASH_AUTO
DASH_AUTO automatically selects a layout based on chart width.
DASH_TWO_PANEL displays the Market and Signal dashboards as two separate panels.
DASH_STACKED places the Signal dashboard below the Market dashboard.
DASH_COMPACT uses a smaller layout for narrow chart windows.
AutoScaleDashboard — Default: true
Automatically adjusts dashboard font size according to chart width.
SmallScreenWidth — Default: 900
Chart-width threshold used to activate the Compact layout in Automatic mode.
MediumScreenWidth — Default: 1300
Chart-width threshold used to select between Stacked and Two Panel layouts in Automatic mode.
MinFontSize — Default: 7
Minimum font size used by automatic dashboard scaling.
MaxFontSize — Default: 10
Maximum font size used by automatic dashboard scaling.
MARKET DASHBOARD POSITION
MarketDashCorner — Default: 0
Chart corner used for the Market Analysis Dashboard.
Corner values:
• 0: Upper left
• 1: Upper right
• 2: Lower left
• 3: Lower right
MarketDashX — Default: 10
Horizontal distance of the Market Dashboard from the selected corner.
MarketDashY — Default: 20
Vertical distance of the Market Dashboard from the selected corner.
MarketDashWidth — Default: 360
Width of the Market Analysis Dashboard in pixels.
MarketDashHeight — Default: 330
Height of the Market Analysis Dashboard in pixels.
SIGNAL DASHBOARD POSITION
SignalDashCorner — Default: 1
Chart corner used for the Signal Plan Dashboard.
Corner values:
• 0: Upper left
• 1: Upper right
• 2: Lower left
• 3: Lower right
SignalDashX — Default: 10
Horizontal distance of the Signal Dashboard from the selected corner.
SignalDashY — Default: 20
Vertical distance of the Signal Dashboard from the selected corner.
SignalDashWidth — Default: 330
Width of the Signal Plan Dashboard in pixels.
SignalDashHeight — Default: 280
Height of the Signal Plan Dashboard in pixels.
DASHBOARD TEXT SETTINGS
DashboardFontSize — Default: 8
Base font size used by the dashboards.
DashboardLineGap — Default: 4
Vertical spacing between dashboard rows.
DashboardColumnGap — Default: 160
Horizontal spacing between dashboard columns.
ALERT SETTINGS
EnablePopupAlert — Default: true
Displays a popup alert inside MetaTrader 5 when a new signal is created.
EnablePushNotification — Default: false
Sends the signal to the MetaTrader mobile application.
MetaTrader notifications must be configured before this option can work.
EnableEmailAlert — Default: false
Sends the signal through the email system configured in MetaTrader 5.
Email settings must be configured before this option can work.
AlertOncePerSignal — Default: true
Prevents repeated alerts for the same active signal.
IMPORTANT INFORMATION
• STA Market Compass is an analytical indicator, not an Expert Advisor.
• The indicator does not automatically open, modify or close trading positions.
• Realtime signals are calculated from the current candle and may change before that candle closes.
• Confirmed Mode uses the previous closed candle but does not guarantee that every signal will be successful.
• The four-line support, resistance and balance system is for visual reference only and does not affect the signal calculation.
• Tick volume depends on the broker’s available market data.
• Entry, Stop Loss and Take Profit levels are analytical references and should be reviewed before placing any order.
• Users remain responsible for position sizing, risk management and trade execution.
RISK WARNING
Trading Forex, CFDs and other leveraged financial instruments involves substantial risk. Past market behaviour does not guarantee future results. Signals and price levels provided by this indicator are for analytical and educational purposes and should not be considered financial advice. Always test the indicator and apply appropriate risk management before using it in live trading.