Confluence Bias Map Multi TF
- 지표
-
Nguyen Thanh Trieu
 I am a software developer and trader focused on building practical trading tools for MetaTrader 5.
My work is centered on:
- Market structure analysis
- Price action logic
- Risk visualization
- Custom indicators and utilities - 버전: 1.0
- 활성화: 10
Confluence Bias Map Multi TF
Reading six timeframes at once from separate charts takes time — and by the time you align them all, the setup is already gone.
Signals conflict because each timeframe tells a different story with no way to combine them into a single, objective view.
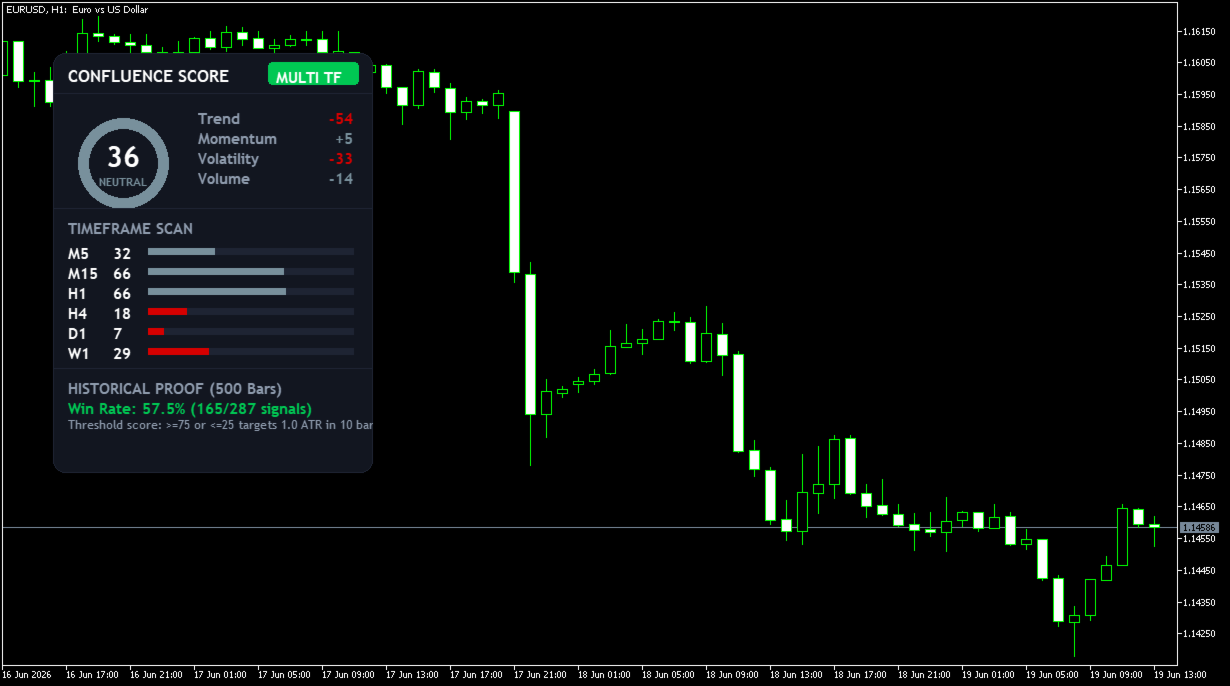
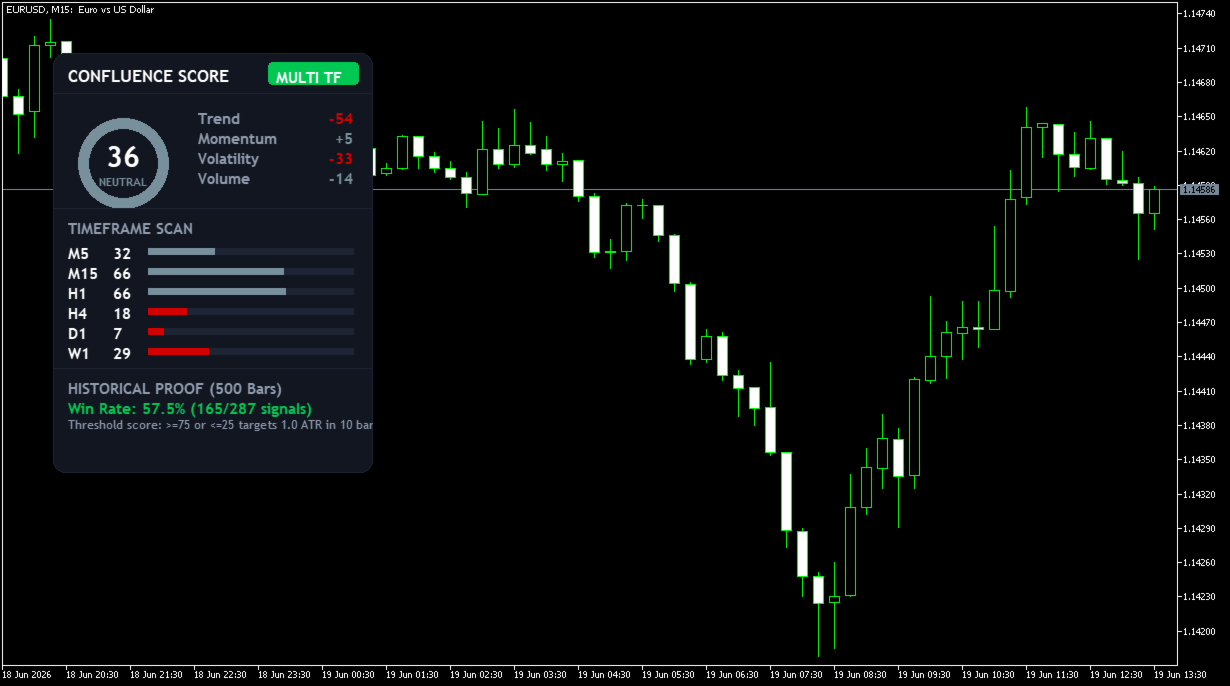
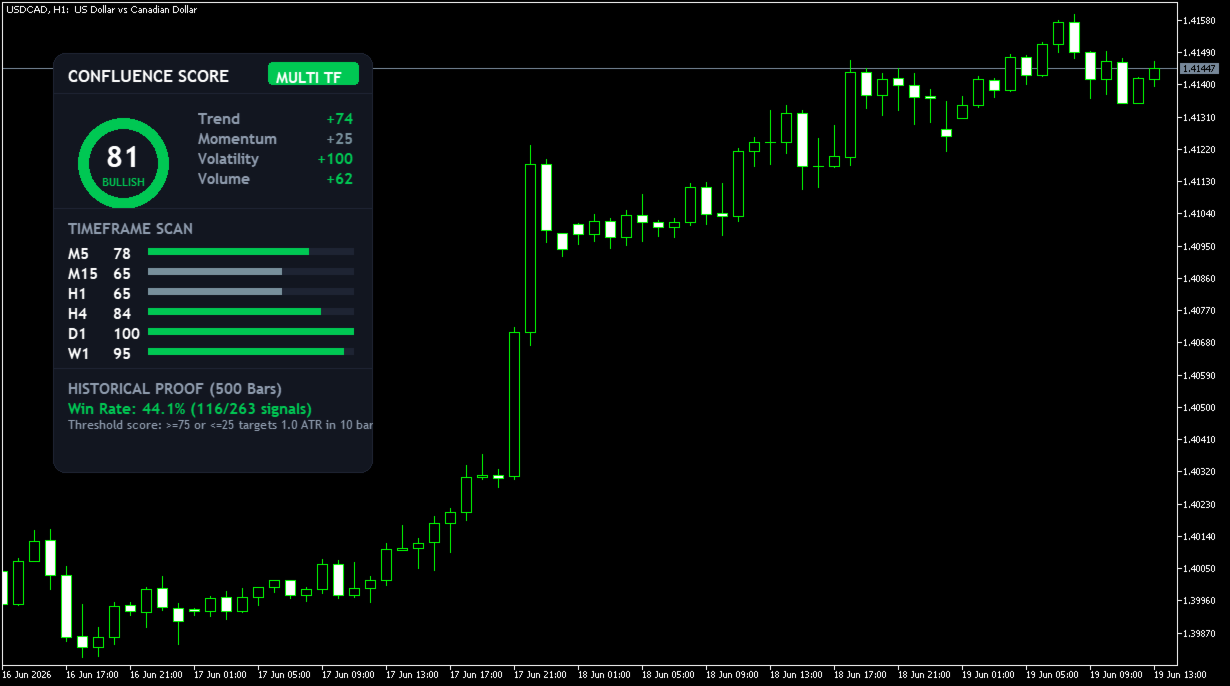
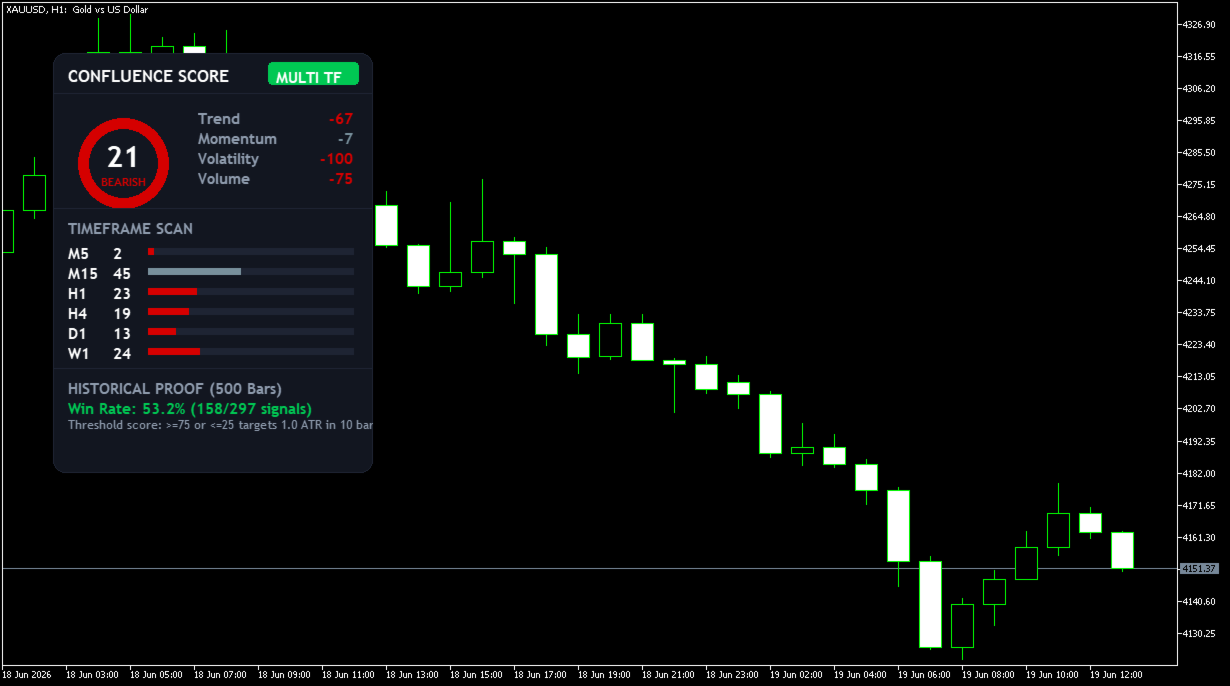
Confluence Bias Map Multi TF scans up to six fully customizable timeframes simultaneously, aggregates trend, momentum, volatility, and volume data into a single weighted score (0 to 100), and displays it on one interactive dashboard — all from a single chart attachment.
Key Features:
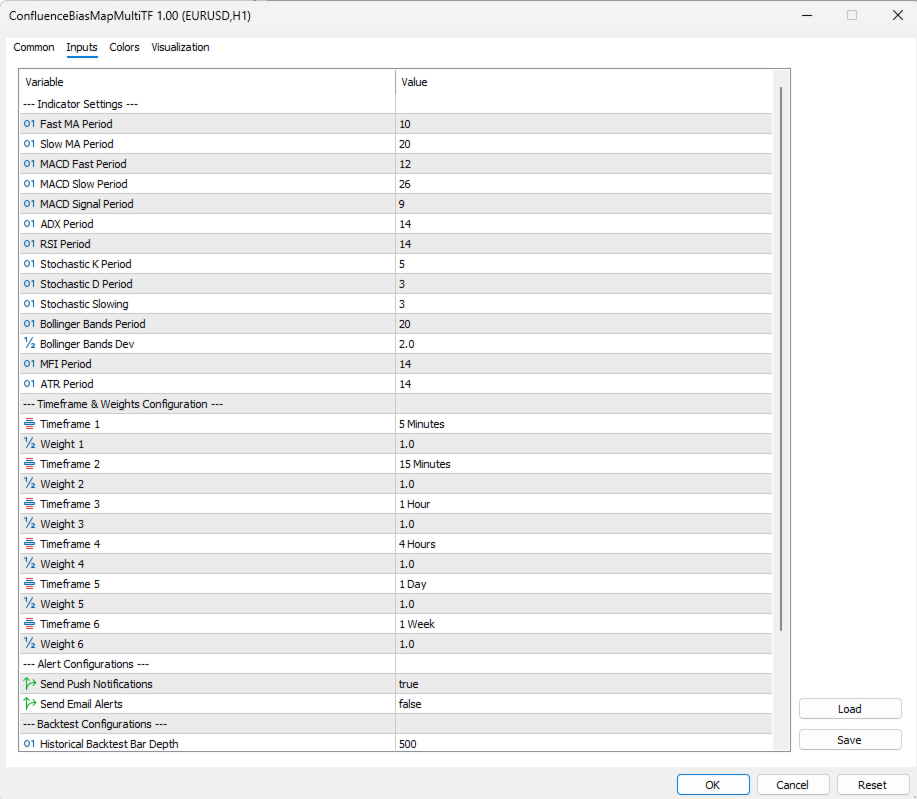
- 6 Configurable Timeframes: Choose any combination of M1, M5, M15, M30, H1, H4, D1, W1, or MN1 for each of the six dashboard slots.
- Custom Timeframe Weighting: Assign individual weights to each timeframe so longer-term bias carries proportionally more influence on the final score.
- Unified Bias Score (0–100): A single composite reading aggregates four indicator categories — trend, momentum, volatility, and volume — across all active timeframes.
- Historical Win-Rate Panel: Scans up to 500 past bars to display the statistical performance rate of previous bias readings at the current score level.
- Draggable Dashboard: Click and drag the panel to any position on your chart without interrupting live data updates.
- Push and Email Alerts: Configurable notifications trigger on bar close when the composite bias crosses strong bullish or bearish thresholds.
- Non-Repainting: All scores are calculated on confirmed, closed candle data only.
What it does NOT do:
It does not open, close, or modify any trades. It does not repaint historical scores after candle close. It does not use external DLLs or make network requests.
Setup:
- Attach to one chart only — the indicator monitors all configured timeframes internally.
- Select your six timeframes and set the weight for each in the Timeframe & Weights settings group.
- Set the History Depth (default 500 bars) for the win-rate panel.
- Enable push or email alerts as needed.
One chart. Six timeframes. One score. Attach and start reading the market in one look.