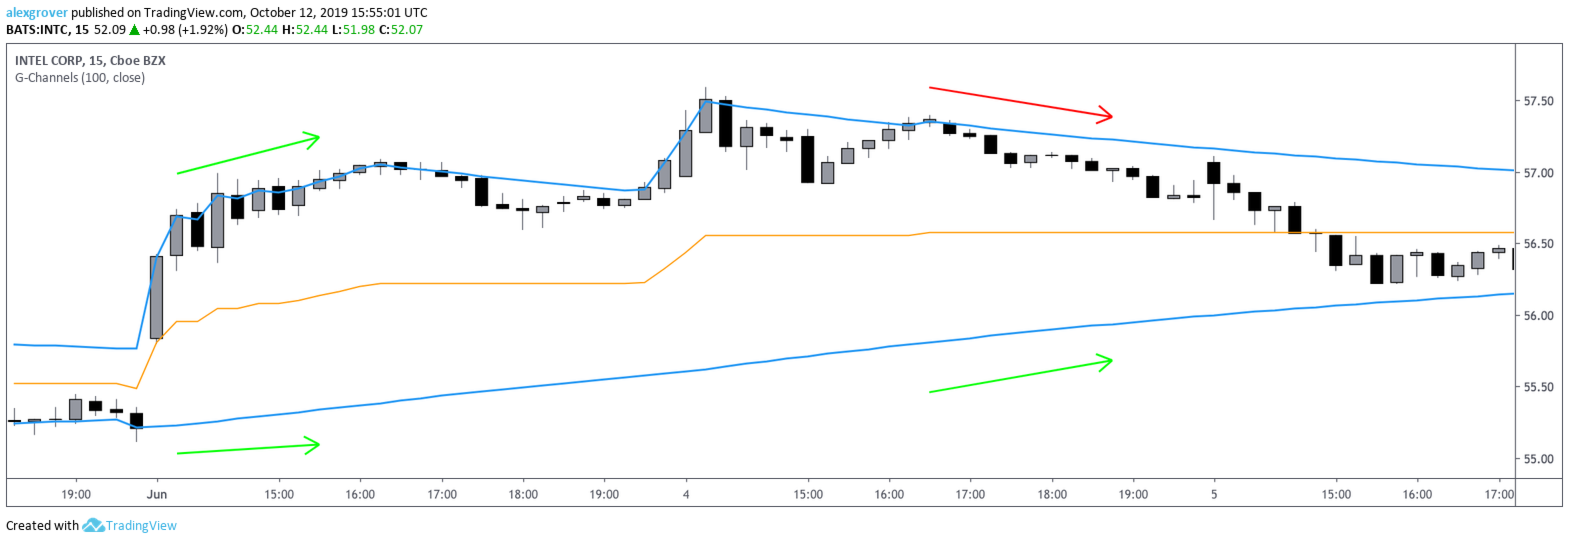
G Channel Indicator

G Channels – Efficient Adaptive Channel Indicator

Introduction

Channel indicators are widely used in technical analysis, offering valuable insights into price movements, trend identification, and volatility. Most channel-based indicators, such as Bollinger Bands and Keltner Channels, rely on a central tendency estimator (e.g., a moving average) combined with a volatility component to define upper and lower bands.

The G Channels indicator takes this concept further by leveraging a highly efficient recursive calculation. This unique approach ensures that the indicator dynamically adapts to market conditions while maintaining computational efficiency. Additionally, the midline of the channel provides a robust central tendency estimator, similar to the average of the highest and lowest prices over a given period.

How It Works – Efficient Calculation

The core efficiency of G Channels comes from its recursive structure, allowing the indicator to use past output values as input. The calculation of the upper band is as follows:

a = max ⁡ ( s r c , n z ( a ( 1 ) ) ) − n z ( a ( 1 ) − b ( 1 ) ) l e n g t h a = \max(src, nz(a(1))) - \frac{nz(a(1) - b(1))}{length} a=max(src,nz(a(1)))lengthnz(a(1)b(1))

Where:

  • src: Closing price
  • a: Upper band
  • b: Lower band

This ensures that the upper band never decreases unless corrected by a calculated adjustment factor derived from the difference between a and b. A similar process is applied to the lower band, ensuring both boundaries adapt smoothly to price movements.

For an even more efficient approach, the calculation could be reduced to:

a = max ⁡ ( s r c , n z ( a ( 1 ) ) ) − n z ( a b s ( c l o s e − a ( 1 ) ) ) l e n g t h a = \max(src, nz(a(1))) - \frac{nz(abs(close - a(1)))}{length} a=max(src,nz(a(1)))lengthnz(abs(closea(1)))

This method, detailed in the research paper "Recursive Bands – A New Indicator for Technical Analysis", has been successfully applied in other tools like the Adaptive Trailing Stop indicator.

The Central Tendency Estimator & EMA 200 Signal

One of the key innovations in G Channels is its central tendency estimator, which is calculated as the average of the upper and lower extremities. This behaves similarly to the midline in Donchian Channels, offering a clear view of the overall market direction.

Buy & Sell Signal – EMA 200 Cross Strategy

A powerful trading signal is generated when the average band crosses the 200-period Exponential Moving Average (EMA 200):

  • Buy Signal: When the average band crosses above the EMA 200, indicating a potential uptrend.
  • Sell Signal: When the average band crosses below the EMA 200, signaling a possible downtrend.

This crossover strategy helps traders confirm market direction and improve trade accuracy.

Key Features

  • Highly Efficient Calculation – Uses recursion for optimized performance.
  • Adaptive Channel Levels – Adjusts dynamically based on price movements.
  • Central Tendency Estimator – Provides a reliable midline for trend analysis.
  • EMA 200 Crossover Signals – Strong buy/sell confirmations.
  • Breakout & Reversal Detection – Helps identify key trading opportunities.
  • Support & Resistance Levels – Acts as dynamic zones for price reactions.

How to Use G Channels in Trading

  • Trend Following: Buy when price bounces off the lower band in an uptrend, sell when it rejects the upper band in a downtrend.
  • Breakout Trading: Enter trades when price closes beyond the channel boundaries.
  • EMA 200 Crossover Strategy:
    • Buy when the average band crosses above EMA 200.
    • Sell when the average band crosses below EMA 200.
  • Support & Resistance: Use the bands as dynamic zones to anticipate price reactions.

Conclusion

G Channels introduces an innovative and efficient way to analyze price movements. Its recursive calculation method ensures accuracy while maintaining a lightweight footprint, making it ideal for traders who seek reliable trend confirmation, breakout signals, and adaptive support/resistance levels.

With the EMA 200 crossover strategy, traders can confidently identify buy and sell opportunities based on a widely used trend filter.

Get G Channels today and enhance your market insights!


추천 제품
FFXMV Forex Dashboard Indicator MT5
Opengates Success International
FULL FOREX MARKET VIEW 대시보드 인디케이터 MT5 이것은 MT5 플랫폼용으로 제작된 맞춤형 인디케이터로, 트레이더에게 시장에서 일어나는 모든 상황을 한눈에 볼 수 있도록 설계되었습니다. 실시간 데이터를 사용하여 시장을 분석하고 성공적인 거래에 필요한 모든 정보를 제공합니다. 설치 방법: 이 인디케이터를 차트 창에 추가하기 전에 MT5의 ‘시장 감시’ 패널로 이동하여 필요하지 않거나 거래하지 않는 통화쌍을 숨기고 필요한 것만 남기세요. 이유는 FFMV 대시보드가 MT5 시장 감시에 표시된 모든 통화쌍을 표시하기 때문입니다. 최대 26개의 통화쌍까지 표시할 수 있습니다. 그 이상이 되면 FFMV 대시보드의 글꼴과 이미지가 흐려지고 깨지며, 올바르게 표시되지 않습니다. 사용 목적: 단일 거래 바스켓 거래(스크린샷 참조) 다중 주문 거래 가능 본인 거래 시스템에서 받은 신호의 유효성 확인 구성 요소: 타임프레임: M1부터 MN1까지 현재 캔들 상태 (매수/매도) 추세: 통
Gann Box MT5
Frederic Jacques Collomb
Gann Box 지표는 트레이더가 시장의 핵심 수준을 식별하고 활용할 수 있도록 설계된 강력하고 다재다능한 도구입니다. 이 지표는 차트에 직사각형을 그릴 수 있게 해주며, 자동으로 전략적 수준인 0, 0.25, 0.50, 0.75, 1 로 여러 영역으로 나뉩니다. 가격이 이 중 하나의 수준에 도달하면 경고가 활성화되어 거래 결정을 내리는 데 귀중한 도움을 제공합니다. 그리신 영역에 대한 시장의 변화를 즉시 알 수 있습니다. 영역을 그리려면 간단한 직사각형을 그리고 이름을 GannBox 로 바꾸기만 하면 됩니다. 이 지표는 지지 및 저항 , 공급 및 수요 개념을 사용하는 트레이더, ICT 기술을 사용하는 트레이더, 또는 공정 가치 갭 (FVG) 전문가 등 모든 유형의 트레이더를 위해 설계되었습니다. 일일 거래자, 스윙 거래자 또는 포지션 거래자이든, Gann Box 는 시장의 움직임을 더 잘 이해하고 예측하는 데 도움을 주어 반응성과 성과를 향상시킵니다. MT4 버전 Gann Box
Indicator Statistics MultiPairs 1. Current Openning Ords - Symbols Openning + Buy Orders + Buy Volume + Sell Orders +Sell Volume - Floating by Symbols 2. Closed Orders - Statistics by Today, Week, Month, YTD and Volume - Sum of Closed Orders by Symbol 3. Statistics by Day - Statistics by Day and Volume 4. DrawDown by Day - Each day DrawDown in Week - Percent of DrawDown Contact me at Telegram @MaiMew68
Kiobi
Firas Al-qasimi
KIOBI VISION KIOBI VISION is a multi-factor analysis indicator designed for professional traders who want a clear and structured view of the market across multiple time frames. Objective The indicator offers a unique summary table that combines several technical tools (RSI, MACD, Stochastics, Vortex, Momentum, PSAR, DMI, MFI, Fisher, and general trend) to provide reliable and quick-to-interpret buy and sell signals. Key Features Multi-timeframe analysis (M1 → MN): a consolidated view of the
Zephir Breakout
Bernardo Rippe Di Dio Castagna
Zephir Power Indicator v1.30 — Breakout Signal & Statistics Tool for MetaTrader 5 Full strategy Guide on purchase - Trader with track record and 8 years of experience  EXTRA COPY FOR TRADING VIEW FOR THIS INDICATOR Zephir Power Indicator v1.30 is a high-performance breakout detection tool for MT5 that identifies precise bullish and bearish entry points based on candle body breakouts, ATR filters, and optional trend confirmation. Designed for professional traders, this indicator visuall
VIX Momentum Pro EA - 제품 설명 개요 VIX Momentum Pro는 VIX75 합성 지수 전용으로 설계된 정교한 알고리즘 거래 시스템입니다. 이 알고리즘은 합성 변동성 시장에서 고확률 거래 기회를 식별하기 위해 독점적인 모멘텀 탐지 기술과 결합된 고급 다중 시간프레임 분석을 사용합니다. 거래 전략 Expert Advisor는 여러 시간프레임에 걸쳐 가격 움직임을 분석하는 포괄적인 모멘텀 기반 접근법으로 작동합니다. 시스템은 VIX75 특성에 특화된 가격 패턴의 수학적 분석을 통해 방향성 모멘텀을 식별합니다. 진입 신호는 모멘텀 수렴, 변동성 임계값, 방향성 편향 확인을 포함한 여러 기술적 조건이 일치할 때 생성됩니다. 이 전략은 기존 지표 의존성을 피하고 대신 합성 지수 행동에 특별히 보정된 독점 수학 모델에 의존합니다. 이 접근법은 알고리즘이 합성 시장의 독특한 24/7 거래 환경에서 효과적으로 작동할 수 있게 합니다. 위험 관리 VIX Momentum Pro
The strategy which is applied in finance market all around the world is known as CTA strategy. A successful CTA always includes multi-strategies, multi-instruments and multi-timeframe. The series of Multi Instruments TrendSystem (MITS) provide a profitable strategy which can be used in different instruments with different timeframe. Multi Instruments TrendSystem 3 BS  MT5 (Blood Sword)  is a fully automated multi-instrument Expert Advisor. This EA is one of our trend strategies EA, it can be us
This EA has been developed, tested and traded live on NASDAQ M15 TF. Everything is ready for immediate use on real account. Very SIMPLE STRATEGY with only FEW PARAMETERS.  Strategy is based on  EXPANSION ON THE DAILY CHART .   It enters if volatility raise after some time of consolidation .  It uses  STOP   pending orders with  ATR STOP LOSS.   To catch the profits is a  TRAILING PROFIT  function in the strategy.  EA has been backtested on more than 10-year long tick data with 99% quality of mo
MTF MultiMeter5
GRANTLEY LAURENCE CAUSE
Benefits: A new and innovative way of looking across multiple timeframes and multiple indicators on any chart. Provides instant multi-timeframe analysis of any market. i.e. forex currency pairs, cryptocurrency pairs, commodities, etc. It offers precise indications across multiple timeframes of volatility as measured by RSI, ADX and STOCH within one chart. Helps you determine high probability trading setups. See example strategy in comments. Can see bullish/bearish volatility building across mult
Visual Trend Flux Analyzer Indicator
AL MOOSAWI ABDULLAH JAFFER BAQER
Visual Trend Flux Analyzer: Your Ultimate Guide to Market Momentum Unlock a clearer, more intuitive way to view market trends and momentum with the Visual Trend Flux Analyzer. This powerful indicator for MetaTrader 5 is designed to cut through market noise and provide you with a clean, visual representation of trend strength and potential reversals. Stop guessing the market's direction and start making informed decisions based on a sophisticated, multi-layered analysis. For just $30, you can eq
Dhokiyas Market Screener
Dhokiyas Money Map Investment Consultants - FZCO
Dhokiya's Market Screener 사용자 가이드 원클릭 트레이딩과 종합 기술 분석을 제공하는 MetaTrader 5 다중 심볼 분석 패널 공식 업데이트 채널 채널 참여 : Dhokiyas 지원 직접 메시지 : Contact 1. 제품 기능 Dhokiya's Market Screener 는 MetaTrader 5용 다중 심볼 기술 분석 도구입니다. 여러 심볼을 동시에 스캔하여 다양한 기술적 확인 신호를 기반으로 매수 또는 매도 방향과 점수를 표시합니다. 이 제품은 하나의 패널에서 빠르게 시장을 확인하고 시간을 절약할 수 있도록 설계되었습니다. 2. 중요 안내 본 제품은 수익을 보장하지 않으며 특정 결과를 약속하지 않습니다. 거래에는 위험이 따릅니다. 적절한 자금 관리 전략을 사용하십시오. 신호는 플랫폼에서 제공되는 시장 데이터와 기술적 지표를 기반으로 계산됩니다. 성과는 브로커 조건, 스프레드, 체결 방식 및 심볼 사양에 따라 달라질 수 있습니다. 3. 설치 방
CChart
Rong Bin Su
Overview In the fast-paced world of forex and financial markets, quick reactions and precise decision-making are crucial. However, the standard MetaTrader 5 terminal only supports a minimum of 1-minute charts, limiting traders' sensitivity to market fluctuations. To address this issue, we introduce the Second-Level Chart Candlestick Indicator , allowing you to effortlessly view and analyze market dynamics from 1 second to 30 seconds on a sub-chart. Key Features Support for Multiple Second-Level
Thermo MAP MT5
Fabio Cavalloni
4.17 (6)
Thermo MAP is a multicurrency and multitimeframe indicator that display a smart heat map based on proprietary calculations. Watch how Forex market moved and is currently moving with a single dashboard and have a consistent and good idea of what is happening! It can be suitable for both scalping or medium/long term, just select options that better fit your trading style Symbols list are automatically sorted based on the preferred column. There is the possibility to click on: First row, timeframe
FREE
HTF Candle Plus MT5
Robby Suhendrawan
HTF Candle Plus Timer Upgrade your trading experience with HTF Candle Plus Timer, a smart indicator that displays higher timeframe candles directly on your current chart. It allows you to stay aligned with the bigger market picture while focusing on your preferred trading timeframe. Key Features: Higher Timeframe Candles Plot custom higher timeframe (HTF) candles such as H1, H4, D1, W1, or MN directly on lower timeframe charts for a clearer market overview. Current Candle Timer A live countdown
Mercury Solar Pro
Enzo Daniel Bergeron
Title: Mercury Solar Pro Description: Mercury Solar Pro is a specialized algorithmic trading system designed exclusively for the GBPUSD pair on the M15 timeframe. Unlike static risk models, Solar Pro utilizes dynamic risk allocation and time-based volatility tracking to navigate both accumulation and expansion market phases. This system is engineered to address the specific requirements of proprietary trading firm challenges, focusing on risk management, drawdown control, and execution during s
MTF Candlestick Patterns Detector : Your Ultimate Price Action Command Centre   In the fast-paced world of trading, missing a single reversal pattern can be the difference between a profitable week and a missed opportunity. The MTF Candlestick Patterns Detector is a professional-grade MQL5 indicator designed to scan, detect, and aggregate over 24 legendary candlestick patterns across all timeframes simultaneously. Stop hunting and guessing through charts. Let the algorithm bring the high-probabi
Z-Score 상관관계는 통계와 시장 분석을 결합하여 차익거래와 추세 거래 모두에서 명확한 신호를 제공하는 강력한 도구입니다. 기능: 두 자산 간의 동적 상관관계를 측정합니다 (예: EURUSD x GBPUSD). 통계적 표준에서 벗어난 편차를 감지하기 위해 Z-Score를 적용합니다. 자산 간 상관관계가 과도하게 왜곡되었을 때 차익거래 기회를 식별합니다. 두 페어 간 Z-Score 교차를 통해 추세 신호를 생성합니다. 장점: 통계적 되돌림과 추세 확인 모두에 활용 가능합니다. 시장의 실제 강도를 감지하는 데 도움을 줍니다. Forex, 지수, 금, 암호화폐, B3 등 다양한 시장에 적용 가능합니다. 스캘퍼, 데이 트레이더, 스윙 트레이더 및 페어 전략에 적합합니다. 이상적인 대상: 통계적 차익거래를 추구하는 트레이더. Z-Score 교차로 확인된 추세 거래. 진입과 청산의 정확도를 높이고자 하는 트레이더. 이렇게 거래할 수 있다고 상상해 보세요: 상
Market Structure Oscillator Overview The Market Structure Oscillator is a technical indicator designed for MetaTrader platforms to analyze market trends across multiple timeframes. It provides a clear visualization of short-term, intermediate-term, and long-term market structures through an oscillator and histogram display in a separate window. The indicator also supports optional chart objects to highlight key market structure points. Features Displays a composite oscillator combining short-ter
Session Mapper PRO
Juan Manuel Scandizzo
Session Mapper PRO | ICT Kill Zones + Session Levels + Alerts - Advanced Trading Session Indicator for MT5 Session Mapper PRO gives you complete visual control over market sessions. See exactly where Asia, London, and New York sessions start and end, their price ranges, and key levels — all updated in real time. PRO Features: Kill Zones: highlights the London Open (07:00-09:00 GMT) and NY Open (13:00-15:00 GMT) — the highest volume windows where the biggest moves happen Session Levels: persiste
Aussenstab Markttechnik
Alexander Josef Zeidler
This indicator shows external bars ("Aussenstäbe") in the chart in candle form. The colors of the candles can be set individually. Also different colors for bearish and bullish bars are possible. In addition, the color of the wicks or outlines is also adjustable. Outside bars are mentioned e.g. by Michael Voigt in the book "Das große Buch der Markttechnik". All other candles are inner bars.
Hidden Gap by MMD MT5
Mariusz Maciej Drozdowski
Hidden Gap by MMD Hidden Gap by MMD is a unique indicator that detects hidden gaps between three consecutive candles. This observation isn't my own, but in the MMD methodology, it has its application alongside other original indicators. You can apply this indicator to the chart multiple times and set the interval from which you want to see the hidden gaps. You can show or hide these gaps as needed. For example, you can view the chart at an M5 interval and see hidden gaps from an M15 chart, etc.
Trend Strength Visualizer
Alexander Denisovich Jegorov
Trend Strength Visualizer A Simple Tool for Trend Analysis This indicator helps you quickly assess the strength of market trends using fast and slow moving averages. It’s designed to give you a clear visual representation of the trend, so you can make better trading decisions. ~Displays: Green Line : Strong uptrend (potential buying opportunities). Red Line : Strong downtrend (potential selling opportunities). ~Values That Can Be Changed: Fast MA period. Slow MA period. Line color for uptrend an
Telegram to MT5 Coppy
Sergey Batudayev
5 (8)
Telegram에서 MT5로:   최고의 신호 복사 솔루션 DLL 없이도 Telegram 채널과 채팅에서 MetaTrader 5 플랫폼으로 거래 신호를 직접 복사하는 최신 도구인 Telegram to MT5를 사용하여 거래를 간소화하세요. 이 강력한 솔루션은 정밀한 신호 실행, 광범위한 사용자 정의 옵션을 제공하고 시간을 절약하며 효율성을 높여줍니다. [ Instructions and DEMO ] 주요 특징 직접 Telegram API 통합 전화번호와 보안 코드를 통해 인증하세요. 사용자 친화적인 EXE 브리지를 통해 채팅 ID를 쉽게 관리하세요. 여러 채널/채팅을 추가, 삭제, 새로 고침하여 동시에 신호를 복사합니다. 고급 필터를 사용한 신호 파싱 예외 단어(예: "보고서", "결과")가 포함된 원치 않는 신호를 건너뜁니다. 유연한 SL 및 TP 형식을 지원합니다: 가격, 핍 또는 포인트. 가격 대신 포인트를 지정하는 신호에 대한 진입 포인트를 자동으로 계산합니다. 주문 맞춤화 및
QuantNas100
Thiago Levi Azevedo Valente
Start the Year 2024 in the perfect way by taking advantage of the Quantitative EA that performed wonderful results in previous years (including 2023) on the NASDAQ Index (NAS100)! It is not a high frequency EA. There are few operations. But they are very precise operations, where the EA analyzes the previous price/volume to understand the current movement and moment. Monthly TP/SL Video = 10% https://www.youtube.com/watch?v=dwgEMMEIIPc Monthly TP/SL Video = 20% https://www.youtube.com/watch?v=
Tim Trend
Oleksii Ferbei
Due to the fact that at each separate period of time, trading and exchange platforms from different parts of the planet are connected to the trading process, the Forex market operates around the clock. Depending on which continent trading activity takes place during a certain period, the entire daily routine is divided into several trading sessions. There are 4 main trading sessions: Pacific. European. American Asian This indicator allows you to see the session on the price chart. You can also
Welcome to Smart Algo Trade Panel Manager MT5 - the ultimate   risk management tool designed to make trading more effective based on user needs.  It is a comprehensive solution for seamless trade planning, position management, and enhanced control over risk. It does not matter weather you a beginner or an advanced trader, or a scalper needing rapid executions, SmartAlgo Trade Panel  adapts to your needs offering flexibility across all markets of your choice. You can put SL, Lot and TP of choice
Smart Currency Strength is a powerful yet simple indicator that measures the strength of individual currencies. It features a graphic panel that lists the main currencies and their strength in each timeframe, ranging from 0 (most oversold) to 100 (most overbought). The strength for all currencies in the current timeframe is also shown in a separate window as a multi-line graph, where each currency is represented with a different color, this allows you to monitor the evolution of strength trend
BlackBox XAU
Enrique Van Rooyen
BlackBox XAU — 골드 전용 고급형 자동매매 프로그램 (EA) 개요 BlackBox XAU는 골드 시장에서 수익을 추구하면서도 드로다운을 철저히 관리하도록 정밀하게 설계된 트레이딩 시스템입니다. 모든 가격 움직임을 따라가는 대신, 규칙 기반의 엄격한 접근 방식을 적용하여 변동성에 적응하고 확률이 높은 거래 기회 만을 선별합니다. EA는 실시간으로 시장 상황을 지속적으로 평가하며, 품질이 낮거나 불확실한 신호를 걸러내고 리스크 대비 보상이 뚜렷하게 유리해지는 순간을 인내심 있게 기다립니다. 조건이 충족되면 정밀한 진입과 함께 시장 상황에 따라 동적으로 조정되는 보호 기능을 갖춘 거래를 실행합니다. 이러한 설계 덕분에 BlackBox는 차트를 불필요한 다수의 거래로 채우지 않고, 양보다 질 을 중시합니다. 통계적으로 우위를 가진 기회에 집중함으로써 트레이더는 안정적인 수익성, 통제 가능한 드로다운, 일관된 위험 대비 성과 를 기대할 수 있습니다. 작동 원리 BlackBox의 핵
다중 시간대 이동 평균선 지표 다중 시간대 이동 평균선 지표를 사용하여 시장 추세를 더 깊이 이해하십시오. 이 강력한 MQL5 도구를 사용하면 하나의 차트에서 5가지 다른 시간대의 이동 평균선을 동시에 시각화할 수 있습니다. 여러 지표 인스턴스로 작업 공간을 복잡하게 만들지 않고도 다양한 관점에서 가격 역학에 대한 포괄적인 통찰력을 얻을 수 있습니다. 주요 기능: 다중 시간대 분석: 하나의 차트에 다른 시간대(예: M15, H1, H4, D1, W1)의 최대 5개의 이동 평균선을 표시합니다. 사용자 정의 기간: 표시되는 모든 선에 대해 원하는 이동 평균 기간을 쉽게 설정할 수 있습니다. 다양한 MA 유형: 단순(SMA), 지수(EMA), 평활(SMMA), 선형 가중(LWMA)을 포함한 광범위한 이동 평균 유형 중에서 선택하십시오. 조정 가능한 시간대: 모니터링하려는 5가지 시간대를 선택하여 비교할 수 없는 유연성을 제공합니다. 깔끔한 시각화: 여러 추세 관점을 한눈에 확인하여 시간대
혁신적인 Trades Time Manager로 손쉽게 거래 루틴을 관리하세요. 이 강력한 도구는 지정된 시간에 주문 실행을 자동화하여 거래 방식을 변화시킵니다. 수동 개입 없이 구매에서 주문 설정에 이르기까지 다양한 거래 작업을 위한 개인화된 작업 목록을 만드십시오. 거래 시간 관리자 설치 및 입력 가이드 EA에 대한 알림을 받으려면 MT4/MT5 터미널에 URL을 추가하십시오(스크린샷 참조). MT4 버전       https://www.mql5.com/en/market/product/103716 MT5 버전       https://www.mql5.com/en/market/product/103715 수동 모니터링에 작별을 고하고 간소화된 효율성을 수용하십시오. 직관적인 인터페이스를 통해 기호, 실행 시간, 가격, 손절매(SL), 이익실현(TP) 포인트 및 로트 크기를 포함한 정확한 매개변수를 설정할 수 있습니다. 도구의 유연성은 시장 행동과 일치하는 적응형 반복 옵션으로 강조됩니
이 제품의 구매자들이 또한 구매함
Azimuth Pro
Ottaviano De Cicco
5 (6)
LAUNCH PROMO Azimuth Pro price is initially set at 299$ for the first 100 buyers. Final price will be 499$ . THE DIFFERENCE BETWEEN RETAIL AND INSTITUTIONAL ENTRIES ISN'T THE INDICATOR — IT'S THE LOCATION. Most traders enter at arbitrary price levels, chasing momentum or reacting to lagging signals. Institutions wait for price to reach structured levels where supply and demand actually shift. Azimuth Pro maps these levels automatically: swing-anchored VWAP, multi-timeframe structure lines, an
Entry In The Zone and SMC Multi Timeframe is a real-time market analysis tool developed based on Smart Money Concepts (SMC). It is designed to analyze market structure, price direction, reversal points, and key zones across multiple timeframes in a systematic way. The system displays Points of Interest (POI) and real-time No Repaint signals, with instant alerts when price reaches key zones or when signals occur within those zones. It functions as both an Indicator and a Signal System (2-in-1), c
Divergence Bomber
Ihor Otkydach
4.89 (85)
이 지표를 구매하신 분께는 다음과 같은 혜택이 무료로 제공됩니다: 각 거래를 자동으로 관리하고, 손절/익절 수준을 설정하며, 전략 규칙에 따라 거래를 종료하는 전용 도우미 툴 "Bomber Utility" 다양한 자산에 맞게 지표를 설정할 수 있는 셋업 파일(Set Files) "최소 위험", "균형 잡힌 위험", "관망 전략" 모드로 설정 가능한 Bomber Utility의 셋업 파일 이 전략을 빠르게 설치, 설정, 시작할 수 있도록 돕는 단계별 영상 매뉴얼 주의: 위의 모든 보너스를 받기 위해서는 MQL5 개인 메시지 시스템을 통해 판매자에게 연락해 주세요. 독창적인 커스텀 지표인 “Divergence Bomber(다이버전스 봄버)”를 소개합니다. 이 지표는 MACD 다이버전스(괴리) 전략을 기반으로 한 올인원(All-in-One) 거래 시스템입니다. 이 기술 지표의 주요 목적은 가격과 MACD 지표 간의 다이버전스를 감지하고, **향후 가격이 어느 방향으로 움직일지를 알려주는
ARICoins
Temirlan Kdyrkhan
ARICoin is a powerful trading companion designed to generate high-probability entry signals with dynamic TP/SL/DP levels based on volatility. Built-in performance tracking shows win/loss stats, PP1/PP2 hits, and success rates all updated live. Key Features: Buy/Sell signals with adaptive volatility bands Real-time TP/SL/DP levels based on ATR Built-in MA Filter with optional ATR/StdDev volatility Performance stats panel (Success, Profit/Loss, PP1/PP2) Alerts via popup, sound, push, or email Cust
CGE Trading Suite
Carl Gustav Johan Ekstrom
5 (1)
CGE Trading Suite delivers the analytical edge typically reserved for professional trading desks. The platform integrates a full suite of analytical tools into one seamless workflow: dynamic grid mapping, liquidity behavior analysis, ECM, trend lines, MIDAS, trade cycles, and directional channel projections. Together, these provide a unified view of market structure and momentum. Directional clarity is further enhanced by the capital flow index, which measures currency basket strength to identif
이 지표를 구매하면 제 프로페셔널 트레이드 매니저를 무료로 드립니다. 우선 이 거래 시스템이 리페인팅, 리드로잉 및 레이그 인디케이터가 아니라는 점을 강조하는 것이 중요합니다. 이는 수동 및 로봇 거래 모두에 이상적인 것으로 만듭니다. 온라인 강좌, 설명서 및 프리셋 다운로드. "스마트 트렌드 트레이딩 시스템 MT5"은 새로운 및 경험이 풍부한 트레이더를 위해 맞춤형으로 제작된 종합적인 거래 솔루션입니다. 10개 이상의 프리미엄 인디케이터를 결합하고 7개 이상의 견고한 거래 전략을 특징으로 하여 다양한 시장 조건에 대한 다목적 선택이 가능합니다. 트렌드 추종 전략: 효과적인 트렌드 추이를 타기 위한 정확한 진입 및 손절 관리를 제공합니다. 반전 전략: 잠재적인 트렌드 반전을 식별하여 트레이더가 범위 시장을 활용할 수 있게 합니다. 스캘핑 전략: 빠르고 정확한 데이 트레이딩 및 단기 거래를 위해 설계되었습니다. 안정성: 모든 인디케이터가 리페인팅, 리드로잉 및 레이그가 아니므로 신뢰
Meridian Pro
Ottaviano De Cicco
5 (1)
Meridian Pro: Professional Multi-Timeframe Trend Matrix for MT5 Overview Meridian Pro is a multi-timeframe trend matrix by Merkava Labs that compresses directional state, strength, momentum condition and matrix agreement into one compact panel. One adaptive engine, applied consistently from M1 to W1. No per-symbol tuning. No indicator stacking. One structured readout across every asset and every timeframe. Launch Offer — Get Meridian Pro for USD 99 (introductory). Regular price: USD 149. 1. Why
RelicusRoad Pro MT5
Relicus LLC
5 (24)
RelicusRoad Pro: 퀀트 시장 운영 체제 70% 할인 평생 이용권 (한정 시간) - 2,000명 이상의 트레이더와 함께하세요 왜 대부분의 트레이더는 "완벽한" 지표를 가지고도 실패할까요? 진공 상태에서 단일 개념 만으로 거래하기 때문입니다. 문맥 없는 신호는 도박입니다. 지속적인 승리를 위해서는 컨플루언스(중첩) 가 필요합니다. RelicusRoad Pro는 단순한 화살표 지표가 아닙니다. 완전한 퀀트 시장 생태계 입니다. 독점적인 변동성 모델링을 사용하여 가격이 이동하는 "공정 가치 로드"를 매핑하고, 단순 노이즈와 실제 구조적 돌파를 구분합니다. 추측은 그만두세요. 기관급 로드 로직으로 거래를 시작하세요. 핵심 엔진: "Road" 알고리즘 시스템의 중심에는 시장 상황에 실시간으로 적응하는 동적 변동성 채널인 Road Algo 가 있습니다. 세이프 라인(평형) 과 가격이 수학적으로 반전될 가능성이 높은 확장 레벨 을 투영합니다. Simple Road: 일반적인 시장을 위
FX Trend MT5 NG
Daniel Stein
5 (4)
FX Trend NG: 차세대 멀티 마켓 트렌드 인텔리전스 개요 FX Trend NG 는 다중 시간 프레임 기반의 전문 트렌드 분석 및 시장 모니터링 도구입니다. 몇 초 만에 전체 시장 구조를 파악할 수 있도록 설계되었습니다. 여러 차트를 일일이 전환할 필요 없이, 어떤 종목이 추세에 있는지, 어디에서 모멘텀이 약화되고 있는지, 그리고 어떤 시간 프레임이 서로 정렬되어 있는지 즉시 확인할 수 있습니다. 출시 기념 특별 혜택 – FX Trend NG 를 $30 (6개월) 또는 $80 평생 라이선스 로 이용할 수 있습니다. 이미 Stein Investments 고객이신가요? -> 메시지를 보내 전용 고객 그룹에 참여하세요. 설정이나 사용 방법이 필요하신가요? -> Stein Investments 공식 페이지 를 방문하세요. 1. FX Trend NG가 특별한 이유 3단계 추세 로직 – 단순한 Buy / Sell이 아닙니다 • 대부분의 지표는 Buy 또는 Sell 두 가지 상태만 제
AriX
Temirlan Kdyrkhan
1 (4)
AriX Indicator for MT5 A powerful trend-following and signal-evaluation tool AriX is a custom MT5 indicator that combines Moving Averages and ATR-based risk/reward logic to generate clear buy/sell signals. It visualizes dynamic SL/TP levels, evaluates past trade outcomes, and displays win/loss statistics in a clean on-chart panel. Key features include: Buy/Sell signals based on MA crossovers ATR-based SL/TP1/TP2/TP3 levels with visual lines and labels Signal outcome tracking with real-time stat
Quantum TrendPulse
Bogdan Ion Puscasu
5 (22)
SuperTrend   ,   RSI   ,   Stochastic   의 힘을 하나의 포괄적인 지표로 결합하여 트레이딩 잠재력을 극대화하는 궁극의 트레이딩 도구   인 Quantum TrendPulse를   소개합니다. 정밀성과 효율성을 추구하는 트레이더를 위해 설계된 이 지표는 시장 추세, 모멘텀 변화, 최적의 진입 및 종료 지점을 자신 있게 식별하는 데 도움이 됩니다. 주요 특징: SuperTrend 통합:   주요 시장 추세를 쉽게 따라가고 수익성의 물결을 타세요. RSI 정밀도:   매수 과다 및 매도 과다 수준을 감지하여 시장 반전 시점을 파악하는 데 적합하며 SuperTrend 필터로 사용 가능 확률적 정확도:   변동성이 큰 시장에서 숨겨진 기회를 찾기 위해 확률적 진동   을 활용하고 SuperTrend의 필터로 사용 다중 시간대 분석:   M5부터 H1 또는 H4까지 다양한 시간대에 걸쳐 시장을 최신 상태로 유지하세요. 맞춤형 알림:   맞춤형 거래 조건이 충족되면
Trend Screener Pro MT5
STE S.S.COMPANY
4.84 (102)
트렌드 표시기, 트렌드 트레이딩 및 필터링을 위한 획기적인 고유 솔루션, 하나의 도구 안에 내장된 모든 중요한 트렌드 기능! Forex, 상품, 암호 화폐, 지수 및 주식과 같은 모든 기호/도구에 사용할 수 있는 100% 다시 칠하지 않는 다중 시간 프레임 및 다중 통화 표시기입니다. Trend Screener는 차트에 점이 있는 화살표 추세 신호를 제공하는 효율적인 지표 추세 추종 지표입니다. 추세 분석기 표시기에서 사용할 수 있는 기능: 1. 트렌드 스캐너. 2. 최대 이익 분석이 있는 추세선. 3. 추세 통화 강도 측정기. 4. 경고가 있는 추세 반전 점. 5. 경고가 있는 강력한 추세 점. 6. 추세 화살표 Trend Screener Indicator가 있는 일일 분석 예, 일일 신호 성능...등은 여기에서 찾을 수 있습니다. 여기를 클릭하십시오. LIMITED TIME OFFER : Trend Screener Indicator는 50$ 및 평생 동안만 사용할 수 있습니다.
Atomic Analyst MT5
Issam Kassas
3.94 (31)
우선적으로 언급할 점은이 거래 지표가 다시 그리지 않고 지연되지 않으며 이를 통해 수동 및 로봇 거래 모두에 이상적이라는 점입니다. 사용자 매뉴얼: 설정, 입력 및 전략. Atomic Analyst는 가격의 강도와 모멘텀을 활용하여 시장에서 더 나은 이점을 찾는 PA Price Action Indicator입니다. 고급 필터를 장착하여 잡음과 거짓 신호를 제거하고 거래 잠재력을 높이는 데 도움이 됩니다. 복잡한 지표의 다중 레이어를 사용하여 Atomic Analyst는 차트를 스캔하고 복잡한 수학적 계산을 간단한 신호와 색상으로 변환하여 초보 트레이더가 이해하고 일관된 거래 결정을 내릴 수 있도록합니다. "Atomic Analyst"는 새로운 및 경험이 풍부한 트레이더를위한 종합적인 거래 솔루션입니다. 프리미엄 지표와 최고 수준의 기능을 하나의 거래 전략에 결합하여 모든 종류의 트레이더에 대한 다재다능한 선택지가되었습니다. 인트라데이 거래 및 스캘핑 전략 : 빠르고 정확한 일일
Meravith MT5
Ivan Stefanov
마켓 메이커를 위한 도구. Meravith는 다음과 같은 기능을 제공합니다: 모든 타임프레임을 분석하고 현재 유효한 추세를 표시합니다. 강세와 약세 거래량이 동일한 유동성 구간(거래량 균형 구간)을 강조 표시합니다. 서로 다른 타임프레임의 모든 유동성 레벨을 차트에 직접 표시합니다. 텍스트 기반 시장 분석을 생성하여 참고용으로 제공합니다. 현재 추세를 기반으로 목표가, 지지선 및 손절가를 계산합니다. 거래의 위험 대비 보상 비율(Risk/Reward)을 계산합니다. 계좌 잔고에 따라 포지션 크기를 산출하고 잠재 수익을 추정합니다. 시장에 중대한 변화가 발생할 경우 경고도 제공합니다. 지표의 주요 라인: 강세/약세 거래량 소진 라인 — 목표가로 사용됩니다. 시장 추세를 나타내는 라인. 시장이 강세인지 약세인지에 따라 색상이 변경되며 추세 지지선 역할을 합니다. 색상은 주로 시장 심리를 보여줍니다. 거래량 균형선(Eq). Eq(Volume Equilibrium) 라인은 시스템의 핵심입니
OmniSync Projection
Antonio-alin Teculescu
5 (1)
Chronos Fractal Engine is an innovative price projection indicator for MetaTrader 5, designed to transform your technical analysis by intelligently identifying and projecting historical price patterns. Built upon an advanced correlation algorithm and the fractal principles of the market, this powerful tool visualizes potential future price movements, giving you a unique edge in your trading decisions. What is Chronos Fractal Engine? At its core, the Chronos Fractal Engine employs a sophisticat
Grabber System MT5
Ihor Otkydach
4.83 (23)
탁월한 기술적 지표인 Grabber를 소개합니다. 이 도구는 즉시 사용 가능한 “올인원(All-Inclusive)” 트레이딩 전략으로 작동합니다. 하나의 코드 안에 강력한 시장 기술 분석 도구, 매매 신호(화살표), 알림 기능, 푸시 알림이 통합되어 있습니다. 이 인디케이터를 구매하신 모든 분들께는 다음의 항목이 무료로 제공됩니다: Grabber 유틸리티: 오픈 포지션을 자동으로 관리하는 도구 단계별 영상 매뉴얼: 설치, 설정, 그리고 실제 거래 방법을 안내 맞춤형 세트 파일: 인디케이터를 빠르게 자동 설정하여 최고의 성과를 낼 수 있도록 도와줍니다 다른 전략은 이제 잊어버리세요! Grabber만이 여러분을 새로운 트레이딩의 정점으로 이끌어 줄 수 있습니다. Grabber 전략의 주요 특징: 거래 시간 프레임: M5부터 H4까지 거래 가능한 자산: 어떤 자산이든 사용 가능하지만, 제가 직접 테스트한 종목들을 추천드립니다 (GBPUSD, GBPCAD, GBPCHF, AUDCAD, AU
Bill Williams Advanced
Siarhei Vashchylka
5 (11)
Bill Williams Advanced is designed for automatic chart analysis using Bill Williams' "Profitunity" system. The indicator analyzes four timeframes at once. Manual (Be sure to read before purchasing) Advantages 1. Analyzes the chart using Bill Williams' "Profitunity" system. Signals are displayed in a table in the corner of the screen and on the price chart. 2. Finds all known AO and AC signals, as well as zone signals. Equipped with a trend filter based on the Alligator. 3. Finds "Divergence Bar
Currency Strength Dashboard Pro
Anastasia Danilova
5 (1)
Currency Strength Dashboard Pro MetaTrader 5 를 위한 실시간 통화 강도 분석 전문 대시보드 입니다. 이 지표는 8개의 주요 통화 (EUR, USD, GBP, JPY, CHF, AUD, CAD, NZD)의 강도를 계산하고, 28개의 통화쌍 을 동시에 여러 시간 프레임에서 분석하여 표시합니다. 이 대시보드는 트레이더가 추가 계산이나 여러 차트 간 전환 없이 한눈에 시장 전체 상황을 파악 할 수 있도록 해줍니다. 계산 방법 이 지표는 고급 수학적 통화 강도 분석 방법 을 기반으로 합니다. 이는 유사한 지표에서 널리 사용되는 RSI 기반 방법 보다 더 정확하고 객관적인 결과를 제공합니다. 이 방법은 28개의 모든 통화쌍 간의 관계를 동시에 분석 하여 시장에서 실제로 형성되는 힘의 균형을 보다 명확하고 편향 없이 보여줍니다. 실시간 대시보드 메인 테이블에는 8개의 통화 에 대한 전체 데이터가 표시됩니다. Rank (순위) — 전체 강도 기준 통화 순위, 1
FX Power MT5 NG
Daniel Stein
5 (31)
FX Power: 통화 강세 분석으로 더 스마트한 거래 결정을 개요 FX Power 는 어떤 시장 상황에서도 주요 통화와 금의 실제 강세를 이해하기 위한 필수 도구입니다. 강한 통화를 매수하고 약한 통화를 매도함으로써 FX Power 는 거래 결정을 단순화하고 높은 확률의 기회를 발견합니다. 트렌드를 따르거나 극단적인 델타 값을 사용해 반전을 예측하고자 한다면, 이 도구는 귀하의 거래 스타일에 완벽히 적응합니다. 단순히 거래하지 말고, FX Power 로 더 스마트하게 거래하세요. 1. FX Power가 거래자에게 매우 유용한 이유 통화와 금의 실시간 강세 분석 • FX Power 는 주요 통화와 금의 상대적 강세를 계산하고 표시하여 시장 역학에 대한 명확한 통찰력을 제공합니다. • 어떤 자산이 앞서고 있고 어떤 자산이 뒤처지는지 모니터링하여 보다 현명한 거래 결정을 내릴 수 있습니다. 포괄적인 멀티 타임프레임 뷰 • 단기, 중기 및 장기 타임프레임에서 통화와 금의 강세를
소개       Quantum Breakout PRO   , 브레이크아웃 존 거래 방식을 변화시키는 획기적인 MQL5 지표! 13년 이상의 거래 경험을 가진 숙련된 트레이더 팀이 개발한       퀀텀 브레이크아웃 PRO       혁신적이고 역동적인 브레이크아웃 존 전략으로 거래 여정을 새로운 차원으로 끌어올리도록 설계되었습니다. Quantum Breakout Indicator는 5개의 이익 목표 영역이 있는 브레이크아웃 영역의 신호 화살표와 브레이크아웃 상자를 기반으로 한 손절 제안을 제공합니다. 초보자 거래자와 전문 거래자 모두에게 적합합니다. Quantum EA 채널:       여기를 클릭하세요 중요한! 구매 후 설치 매뉴얼을 받으려면 개인 메시지를 보내주십시오. 추천: 기간: M15 통화쌍: GBPJPY, EURJPY, USDJPY,NZDUSD, XAUUSD 계정 유형: 스프레드가 매우 낮은 ECN, Raw 또는 Razor 브로커 시간: GMT +3 중개인 :
RFI levels PRO MT5
Roman Podpora
3.67 (3)
이 지표는 추세 반전 지점과 가격 반등 영역을 정확하게 보여줍니다.       주요 투자자들   . 새로운 트렌드가 형성되는 곳을 파악하고 최대한 정확하게 의사결정을 내리며 모든 거래를 완벽하게 통제합니다. TREND LINES PRO   지표와 함께 사용할 때 최대의 잠재력을 발휘합니다.  VERSION MT4 지표가 보여주는 내용: 새로운 추세의 시작 시 활성화되는 반전 구조 및 반전 수준. 최소한의 위험 대비 수익률을 갖는 이익 실현   (TAKE PROFIT)   및   손절매(STOP LOSS)   레벨 표시       RR 1:2   . 지능형 손실 감소 로직이 적용된 손절매 기능. 지정된 지표에서 두 가지 추세 유형에 대한 반전 패턴을 표시합니다. 지표: 트렌드를 따라   트렌드 라인 프로   (글로벌 트렌드 변화) 트렌드 프로   (빠른 트렌드 변화) 간단하고 효과적입니다       스캐너       실시간 추세 (신규). 다중 시간 프레임 도구 필터링. 표시하다  
Advanced Supply Demand MT5
Bernhard Schweigert
4.53 (15)
현재 33% 할인! 초보자나 전문 트레이더를 위한 최고의 솔루션! 이 보조지표는 우리가 다수의 독창적 기능과 새로운 공식을 통합한 독특하고 고품질이며 저렴한 거래 도구입니다. 이 업데이트를 통해 이중 시간대를 표시할 수 있습니다. 더 높은 TF를 표시할 수 있을 뿐만 아니라 차트 TF와 더 높은 TF 모두를 표시할 수 있습니다: 중첩 영역 표시. 모든 Supply Demand 트레이더들이 좋아할 것입니다. :) 중요한 정보 공개 Advanced Supply Demand의 잠재력을 극대화하려면 다음을 방문하십시오. https://www.mql5.com/ko/blogs/post/720245   진입 또는 목표의 명확한 트리거 포인트를 정확히 찾아냄으로 해서 거래가 어떻게 개선될지 상상해 보십시오. 새로운 알고리즘을 기반으로 매수자와 매도자 간의 잠재적인 불균형을 훨씬 더 쉽게 분간할 수 있습니다. 왜냐하면 가장 강한 공급영역과 가장 강한 수요 영역과 과거에 어떻게 진행 되었는지를(이전
Trend Forecaster
Alexey Minkov
5 (7)
The Trend Forecaster indicator utilizes a unique proprietary algorithm to determine entry points for a breakout trading strategy. The indicator identifies price clusters, analyzes price movement near levels, and provides a signal when the price breaks through a level. The Trend Forecaster indicator is suitable for all financial assets, including currencies (Forex), metals, stocks, indices, and cryptocurrencies. You can also adjust the indicator to work on any time frames, although it is recommen
Gann Made Easy 는 mr.의 이론을 사용하여 최고의 거래 원칙을 기반으로 하는 전문적이고 사용하기 쉬운 Forex 거래 시스템입니다. W.D. 간. 이 표시기는 Stop Loss 및 Take Profit Levels를 포함하여 정확한 BUY 및 SELL 신호를 제공합니다. PUSH 알림을 사용하여 이동 중에도 거래할 수 있습니다. 구매 후 거래 방법 안내 및 유용한 추가 지표를 무료로 받으시려면 저에게 연락주세요! 아마도 Gann 거래 방법에 대해 이미 여러 번 들었을 것입니다. 일반적으로 Gann의 이론은 초보자 거래자뿐만 아니라 이미 거래 경험이 있는 사람들에게도 매우 복잡한 것입니다. Gann의 거래 방식은 이론적으로 적용하기 쉽지 않기 때문입니다. 나는 그 지식을 연마하고 Forex 지표에 최고의 원칙을 적용하기 위해 몇 년을 보냈습니다. 표시기는 적용하기가 매우 쉽습니다. 차트에 첨부하고 간단한 거래 권장 사항을 따르기만 하면 됩니다. 지표는 지속적으로 시장 분석
Gold Sniper Scalper Pro
Ich Khiem Nguyen
3.78 (9)
Gold Sniper Scalper Pro는 XAUUSD에서 허위 돌파 (false breakout) 패턴을 감지하기 위해 특별히 설계된 MetaTrader 5 지표입니다. 가격이 레인지 경계를 돌파하여 돌파 트레이더를 유인한 후 반전하는 4봉 트랩 구조를 식별합니다. 지표는 각 셋업을 17개 품질 요소로 평가하고, 4계층 합류 파이프라인을 통해 처리하며, 7타임프레임 추세 합의 엔진으로 검증하고, 금 변동성 상태 분류기로 필터링합니다. 이 모든 과정이 신호가 차트에 표시되기 전에 완료됩니다. 자세한 사용자 가이드는 작성자의   MQL5 블로그 에서 확인할 수 있습니다. 추가 업데이트는 작성자의   MQL5 채널 을 통해 제공됩니다. 현재 지원 정책에 따라 구매자는 저자가 개발한 선별된 보조 도구에 대한 추가 접근 권한을 받을 수 있습니다. Forex 쌍, 지수 및 암호화폐에서도 작동하지만, 감지 매개변수, 변동성 처리 및 필터 로직은 XAUUSD 특성에 최적화되어 있습니다.
ARIPoint
Temirlan Kdyrkhan
ARIPoint is a powerful trading companion designed to generate high-probability entry signals with dynamic TP/SL/DP levels based on volatility. Built-in performance tracking shows win/loss stats, PP1/PP2 hits, and success rates all updated live. Key Features: Buy/Sell signals with adaptive volatility bands Real-time TP/SL/DP levels based on ATR Built-in MA Filter with optional ATR/StdDev volatility Performance stats panel (Success, Profit/Loss, PP1/PP2) Alerts via popup, sound, push, or email Cu
Trend Hunter MT5
Andrey Tatarinov
5 (4)
Trend Hunter 는 Forex, 암호화폐 및 CFD 시장에서 작업하기 위한 추세 지표입니다. 이 지표의 특별한 특징은 가격이 추세선을 약간 돌파할 때 신호를 변경하지 않고 자신있게 추세를 따른다는 것입니다. 표시기는 다시 그려지지 않으며 막대가 닫힌 후에 시장 진입 신호가 나타납니다. 추세를 따라 이동할 때 표시기는 추세 방향에 대한 추가 진입점을 표시합니다. 이러한 신호를 바탕으로 작은 StopLoss로 거래할 수 있습니다. Trend Hunter 는 정직한 지표입니다. 표시 신호 위로 마우스를 가져가면 신호의 잠재적 이익과 가능한 중지가 표시됩니다. 새로운 신호가 나타나면 다음 알림을 받을 수 있습니다. 알리다 푸시 알림 이메일로 알림 텔레그램 알림 차트 스크린샷도 텔레그램으로 전송되므로 거래 결정을 내리기 위해 단말기를 열 필요가 없습니다. 표시 신호는 텔레그램 채널 https://www.mql5.com/ko/market/product/11085#!tab=com
Btmm state engine pro
Garry James Goodchild
5 (3)
Get the user guide here  https://g-labs.software/guides/BTMM_State_Engine_Welcome_Pack.html BTMM State Engine Pro — the   all-in-one Banks   & Institutions Market Maker indicator for Meta Trader 5. Built for   BTMM traders who follow the Asian   session breakout methodology with Kill Zone timing , level stacking, peak formation detection , and multi-pair scanning — all   from a single chart. Combines   a full BTMM State Engine   with a built-in multi-pair Scanner dashboard, eliminating the need
ACB Breakout Arrows MT5
KEENBASE SOFTWARE SOLUTIONS
3.5 (2)
ACB Breakout Arrows 지표는 특별한 돌파 패턴을 감지하여 시장에서 중요한 진입 신호를 제공합니다. 이 지표는 차트를 지속적으로 스캔하면서 한 방향으로 움직임이 자리 잡을 때를 포착하여 큰 움직임 직전에 정확한 진입 신호를 제공합니다. 다중 종목 및 다중 시간대 스캐너는 여기에서 확인하세요 - ACB Breakout Arrows MT5용 스캐너 핵심 기능 지표가 자동으로 손절(Stop Loss) 및 익절(Take Profit) 수준을 제공합니다. 모든 시간대의 돌파 신호를 추적하는 MTF 스캐너 대시보드 포함. 데이 트레이더, 스윙 트레이더 및 스캘퍼에게 적합합니다. 신호 정확도를 높이기 위해 최적화된 알고리즘 사용. 손익분기점 또는 빠른 수익 목표를 위한 특별한 라인 (Quick Profit Line) 제공. 승률, 성공 비율, 평균 수익 등의 성과 분석 지표 제공. 재도색 없음. 신호는 고정되어 신뢰할 수 있습니다. 거래 확인 - ACB Trade Filter 지
Matrix Arrow Indicator MT5
Juvenille Emperor Limited
5 (19)
매트릭스 화살표 표시기 MT5 는 외환, 상품, 암호 화폐, 지수, 주식과 같은 모든 기호/도구에 사용할 수 있는 100% 다시 칠하지 않는 다중 기간 표시기를 따르는 고유한 10 in 1 추세입니다.  Matrix Arrow Indicator MT5 는 다음과 같은 최대 10개의 표준 지표에서 정보와 데이터를 수집하여 초기 단계에서 현재 추세를 결정합니다. 평균 방향 이동 지수(ADX) 상품 채널 지수(CCI) 클래식 하이켄 아시 캔들 이동 평균 이동 평균 수렴 발산(MACD) 상대 활력 지수(RVI) 상대 강도 지수(RSI) 포물선 SAR 스토캐스틱 오실레이터 윌리엄스의 백분율 범위 모든 지표가 유효한 매수 또는 매도 신호를 제공하면 강력한 상승/하락 추세를 나타내는 다음 캔들/막대가 시작될 때 해당 화살표가 차트에 인쇄됩니다. 사용자는 사용할 표시기를 선택하고 각 표시기의 매개변수를 개별적으로 조정할 수 있습니다. 매트릭스 화살표 표시기 MT5는 선택한 표시기에서만 정보를 수
제작자의 제품 더 보기
Sonic R Indicator Description Overview The Sonic R Indicator for MT5 is designed to help traders analyze market trends using moving averages and volume analysis. This tool assists in identifying potential price movements by displaying trend zones and volume strength, making it suitable for various trading strategies. Key Features Dual EMA Trend Channels – Uses 34-period Exponential Moving Averages (EMA) to visualize price movement. Volume Analysis – A color-coded histogram to indicate changes i
Volume Above Average Indicator - MQL5 Introduction The Volume Above Average Indicator is a custom indicator for the MetaTrader 5 (MQL5) platform that helps traders identify the current trading volume compared to the historical average. The indicator uses three different sensitivity levels to classify volume into weak, medium, and strong, providing a clear visualization of market momentum. Key Features Displays trading volume in a separate window. Compares the current volume with the historical a
FREE
Origin Gold Sonic R EA – Automated Trading for XAU/USD (1H) Overview Origin Gold Sonic R EA is a fully automated Expert Advisor designed to trade XAU/USD (Gold) on the H1 timeframe using the Sonic R Strategy. This EA intelligently combines trend analysis, volume-based confirmations, and dynamic support/resistance levels to enter and exit trades with precision. Key Features Fully Automated Trading – Executes buy and sell orders without manual intervention. Advanced Trend Detection – Uses moving
G Channel EA
Dinh Hoan Luu
G Channel EA – Adaptive Trading Expert Advisor Introduction G Channel EA is an advanced automated trading system that utilizes the G Channels Indicator to execute trades based on market conditions. This EA enhances trading precision by combining trend-following strategies, breakout detection, and EMA 200 filtering to deliver efficient trade execution. By leveraging a recursive calculation method , G Channel EA dynamically adapts to price action, ensuring optimal entry, exit, and risk management
필터:
리뷰 없음
리뷰 답변