Pivots Points

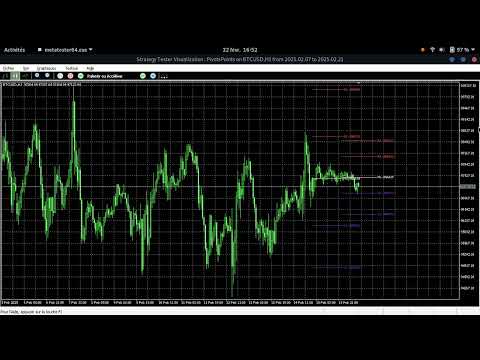
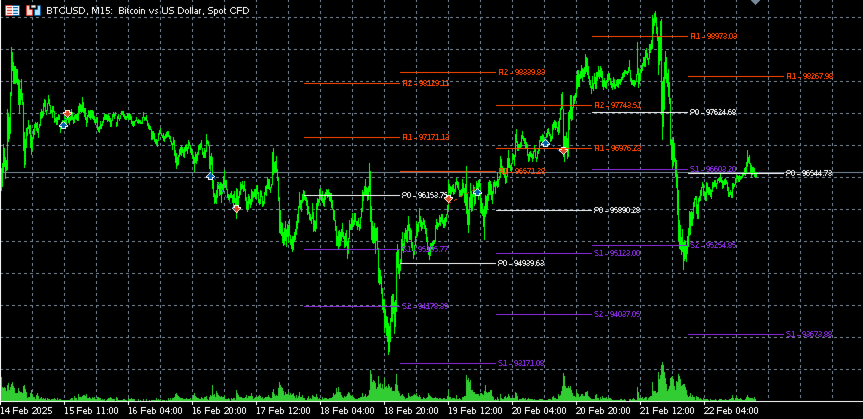
Pivots Points Indicator:

Displays the Pivots Points lines for the Daily, Weekly or Monthly periods

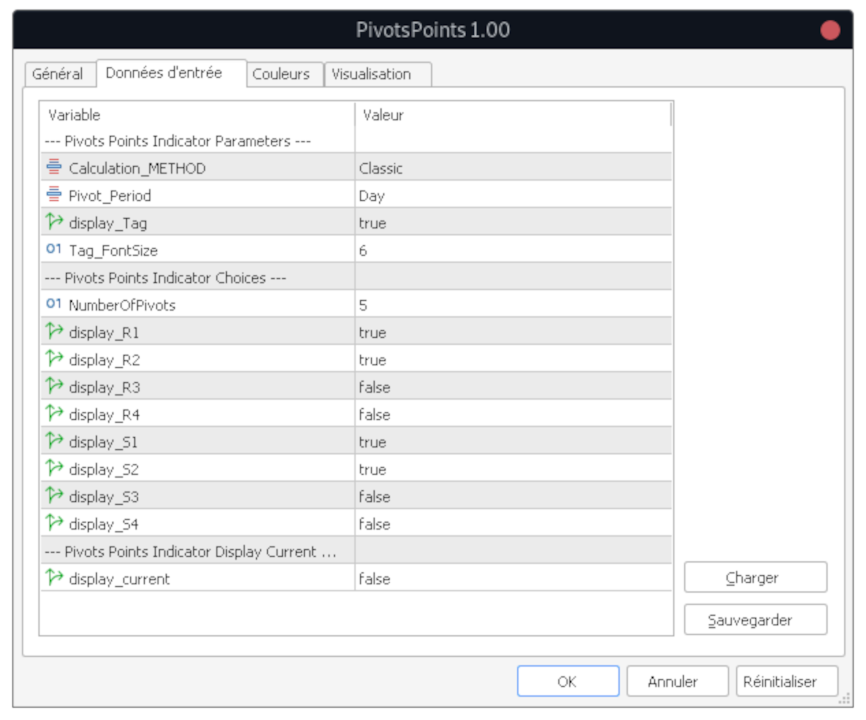
Several parameters are possible:

1 - Choice of calculation method:

- Classic

- Woodie

- Camarilla

- Fibonacci

2 - The choice of the period for calculating the pivot points (Daily, Weekly or Monthly )

3 - The display or not of the price labels (to the right of each line) as well as the size of the associated font

4 - The number of pivot points (previous) that we want to display

5 - Possibility to select the pivot lines (R1, R2, R3, R4, S1, S2, S3, S4) that we want to display or not

6 - Possibility to display the pivot points calculated on the current period (display_current parameter)

This indicator provides 9 buffers which are described below:

// index = 0 => Pivot

// index = 1 => S4

// index = 2 => S3

// index = 3 => S2

// index = 4 => S1

// index = 5 => R1

// index = 6 => R2

// index = 7 => R3

// index = 8 => R4
추천 제품
NEXA Pivot Rebound Basic 1. 개요 NEXA Pivot Rebound Basic은 일일 피벗 레벨(S1, R1)을 기준으로 가격의 반등 가능성을 탐지하는 Expert Advisor입니다. 이 제품은 MetaTrader 5 플랫폼에서 작동하며, M15 차트 기준으로 설계되었습니다. 전일 고가, 저가, 종가를 기반으로 계산된 피벗 레벨과 RSI 및 Stochastic 보조지표를 함께 사용하여 진입 조건을 구성합니다. 본 제품은 자동 매매 전략 연구 및 트레이딩 자동화를 위한 도구입니다. 2. 전략 개요 전략은 다음 요소를 조합하여 신호를 생성합니다. 전일 기준 Pivot Point 계산 S1 / R1 레벨 접근 여부 확인 RSI 보조지표 Stochastic 교차 조건 최근 스윙 고점/저점 기반 손절 설정 고정 비율 기반 이익 목표(RR) 매수 조건은 가격이 S1 근처에 도달하고, 보조지표 조건이 충족될 때 발생합니다. 매도 조건은 가격이 R1 근처에 도달하고, 보조지
Introduction to Support Resistance Indicator Support and Resistance are the important price levels to watch out during intraday market. These price levels are often tested before development of new trend or often stop the existing trend causing trend reversal at this point. Highly precise support and resistance are indispensable for experienced traders. Many typical trading strategies like breakout or trend reversal can be played well around these support and resistance levels. The Precision Sup
Pivot Points MT5 is a universal color multicurrency/multisymbol indicator of the Pivot Points levels systems. You can select one of its three versions: Standard Old, Standard New and Fibo . It plots pivot levels for financial instruments in a separate window . The system will automatically calculate the Pivot Point on the basis of market data for the previous day ( PERIOD_D1 ) and the system of support and resistance levels, three in each. A user can choose colors for the indicator lines. The on
MTF MA Color Candles Alert helps traders read moving-average context faster by replacing regular candles with four customizable candle colors. The indicator can use the current timeframe or a selected higher timeframe moving average. For example, a trader can view M5 price action while coloring the candles from an H1 or H4 moving average condition. Main features: - Multi-timeframe MA source: current, M5, M15, M30, H1, H4, D1, and W1 - Moving average period, method, and applied price are adjus
Camarilla Pivot
Philip Thakadiyil George
Camarilla Pivot Pro EA is a fully automated trading robot built around the powerful Camarilla Pivot Point formula. The EA calculates intraday pivot levels (H1–H6 & L1–L6) and trades based on price reactions at major Camarilla reversal and breakout zones. It is designed for traders who want a clean, mechanical, and proven pivot-based strategy without repainting signals or complicated indicators.
MQL5 "일일 저항 및 지지" 지표 - 일별 지지 및 저항선을 그립니다. 그리기는 그래픽 개체(추세선)의 도움을 통해서만 수행됩니다. 이 지표에는 지표 버퍼가 사용되지 않습니다. 표시기에는 설정이 없습니다. 레벨 검색은 "D1" 시간 프레임의 마지막 500개 막대에서 수행되며 이 매개변수는 코드 내부에 고정되어 있습니다. 수동 거래: 수동으로 거래할 때 이 지표는 "M10"에서 "H1"까지의 기간에 사용하는 것이 좋습니다. 그것은 두 가지 전략으로 사용될 수 있습니다: 수준 돌파와 수준에서 반등, 또는 두 전략의 조합. 기억해야 할 주요 사항은 일일 레벨이 3~4일 지연되어 그려진다는 것입니다. 이것은 레벨이 형성되는 최소 시간입니다. 드문 경우지만 추세가 3~4일 이내에 급격하게 변하면 수치가 사라질 수 있습니다. 보다 보수적인 거래를 사용하는 경우 다른 지표(추세 또는 오실레이터)에서 확인을 찾아야 합니다.
Smart Trendlines MT5
Suvashish Halder
5 (3)
Smart Trendlines – No.1 Trendlines Indicator Smart Trendlines is a precision tool that automatically draws trendlines based on every valid pivot point, helping traders identify key support and resistance zones. It continuously adjusts as new market pivots form, providing a live and accurate reflection of price structure. Whether you’re tracking trends, preparing for reversals, or anticipating breakouts — this indicator keeps you one step ahead. It works seamlessly across all assets including For
ZF Equity Protector Premium v2.0 The Ultimate Daily Loss Breaker for Smart Traders & Prop Firm Hunters Have you ever blown a Prop Firm account just because of "one bad day"? Or has emotional revenge trading destroyed weeks of hard-earned profits in a matter of hours? Put an end to account destruction right now. ZF Equity Protector Premium v2.0 is an advanced automated safety system (EA) specifically engineered to be your capital's ultimate line of defense. This EA acts as a cold, calculated circ
Short Description Swing Timing Breakout EA is a smart Expert Advisor for MetaTrader 5 that combines trend filtering, momentum timing, and dynamic risk management to capture high-probability swing and breakout opportunities. Full Description Swing Timing Breakout EA is a professional trading robot designed for MetaTrader 5, suitable for traders who want a balance between automation, control, and disciplined risk management. This EA uses a trend-following and momentum confirmation approach ,
Unlock the power of Fibonacci with our advanced indicator! This tool precisely plots Fibonacci levels based on the previous day's high and low, identifying the next day's key support and resistance levels. Perfect for day trading and swing trading, it has consistently generated weekly profits for me. Elevate your trading strategy and seize profitable opportunities with ease. NOTE: In the Input section make sure the draw labels are set to "True" so you can see each levels.
지표에 대하여 이 지표는 금융 상품의 종가에 대한 몬테카를로 시뮬레이션을 기반으로 합니다. 몬테카를로는 통계적 기법으로, 이전에 관찰된 결과에 기반한 랜덤 숫자를 사용하여 다양한 결과가 나올 확률을 모델링하는 데 사용됩니다. 어떻게 작동하나요? 이 지표는 과거 데이터를 바탕으로 시간에 따른 랜덤 가격 변화를 모델링하여 특정 종목에 대한 여러 가격 시나리오를 생성합니다. 각 시뮬레이션은 종가 변동을 반영하기 위해 랜덤 변수를 사용하여, 주어진 기간 동안 미래 시장 움직임을 효과적으로 모방합니다. 몬테카를로 시뮬레이션의 장점 - 몬테카를로 시뮬레이션은 다양한 미래 시나리오에 대한 테스트를 통해 여러 거래 전략의 리스크를 분석하는 데 도움을 줍니다. - 희귀한 극단적 사건(꼬리 위험)을 포함하여 다양한 시장 상황에서 전략의 성과를 확인할 수 있습니다. - 단일 예측에 의존하지 않고, 몬테카를로는 관련 확률과 함께 잠재적 결과의 범위를 제공합니다. 이는 수익 또는 손실 가능성을 이해하는
Rainbow EA MT5
Jamal El Alama
Description : Rainbow EA MT5 is a simple Expert advisor based on   Rainbow MT5 indicator witch is based on Moving average with period 34. The indicator is incorporated in the EA, therefore, it is not required for the EA to operate, but if you wish, you can download it from   my product page . The Expert Advisor settings are as follows : Suitable for Timeframes up to H1 The parameters below can be set according to your trading rules. StopLoss ( Stop Loss in pips) TakeProfit ( Take Profit in pips
CRT Candle Range Theory HTF MT5.   Ultimate CRT Indicator: Advanced ICT Concepts and Malaysian SnR Trading System Discounted   Price $50  !!     Secure your lifetime access now before it switches to subscription-only ! Master the Market Maker's Footprints with the Most Advanced Candle Range Theory Indicator Unlock the true power of Smart Money Concepts (SMC) and trade precisely like the institutions with the Ultimate CRT Indicator . Built exclusively for serious traders, this indicator automates
KT Auto Trendline MT5
KEENBASE SOFTWARE SOLUTIONS
KT Auto Trendline draws the upper and lower trendlines automatically using the last two significant swing highs/lows. Trendline anchor points are found by plotting the ZigZag over X number of bars. Features No guesswork requires. It instantly draws the notable trendlines without any uncertainty. Each trendline is extended with its corresponding rays, which helps determine the area of breakout/reversal. It can draw two separate upper and lower trendlines simultaneously. It works on all timeframe
Advanced Support and Resistance Support and resistance levels are widely used in trading. They are important as they show some key price levels. Before applying any strategy, one may consider it necessary to draw support and resistance. However, this process can take much time especially if one is to analyse a lot of currency pairs, commodities or indices. This Advanced Support and Resistance tool was designed for traders at any level, amateur to professional. It plots key support and resistance
FibPiv Zones PRO
Huu Tri Nguyen
FibPiv Zones Fibonacci Pivot Zone Indicator for MetaTrader Short Description FibPiv Zones is a technical analysis indicator combining Fibonacci-based levels and pivot point calculations to display support and resistance zones directly on the chart. Overview FibPiv Zones is a chart analysis indicator designed to visualize market structure using Fibonacci calculations and pivot point levels. The indicator automatically generates: Fibonacci-based support zones Fibonacci-based resistance zones Pivot
Trend Stop  Introduction Trend Stop is a simple yet powerful trend-following and stop-placement tool for MetaTrader 5. It calculates the highest high or lowest low of the last N periods and plots a dynamic line that reacts instantly to trend changes. The result is a clean, reliable trend filter and a practical guide for placing optimal stop levels — without unnecessary noise or lag. Whether you’re a trend trader, swing trader, or scalper, Trend Stop helps you stay on the right side of the market
A pivot point is   an intraday technical indicator used to identify trends and reversals mainly in equities, commodities, and forex markets . Pivot points are calculated to determine levels in which the sentiment of the market could change from bullish to bearish, and vice-versa. the swing daily is an advanced pivot points indicator that grants the user control over many aspects of the trading levels that you'll get familiar with in the controls section  it's used mainly to locate intraday tr
Classic SNR MetaTrader 5 Expert Advisor | Multi-Symbol Support & Resistance Trading with Trend-Based Logic Overview Classic SNR Breakout EA is a professional trading robot that identifies structural Support & Resistance levels using daily swing points and executes trades based on H1 price action relative to these levels. The EA applies   dual logic : in an uptrend, it sells on H1 rejection below an SNR level; in a downtrend, it buys on H1 rejection above an SNR level. Breakout confirmations are
Created by imjesstwoone and mickey1984, this trade model attempts to capture the expansion from the 10:00-14:00 EST 4h candle using just 3 simple steps. All of the information presented in this description has been outlined by its creators, all I did was translate it to MQL5. All core settings of the trade model may be edited so that users can test several variations, however this description will cover its default, intended behavior using NQ 5m as an example. Step 1 is to identify our Price Ra
US500 Scalper
Sergey Batudayev
S&P 500 스캘퍼 어드바이저(S&P 500 Scalper Advisor)는 S&P 500 지수를 성공적으로 거래하고자 하는 트레이더를 위해 설계된 혁신적인 도구입니다. S&P 500 지수는 미국 주식 시장에서 가장 널리 사용되고 권위 있는 지표 중 하나로, 미국 500대 기업으로 구성되어 있습니다. 특징: 자동화된 거래 솔루션:       이 자문가는 고급 알고리즘과 기술적 분석을 기반으로 시장 상황의 변화에 맞춰 전략을 자동으로 조정합니다. 다양한 접근 방식:       자문가는 지수 추세 이해, 가격 변동 분석, 수익 극대화와 위험 최소화를 위한 알고리즘 등 여러 가지 전략을 결합합니다. 유연성 및 사용자 정의 가능성:       트레이더는 자신의 트레이딩 목표, 위험 수준, 트레이딩 전략 선호도에 맞춰 EA 설정을 사용자 지정할 수 있습니다. 위험 관리:       자문가는 시장을 지속적으로 모니터링하고 위험을 관리하기 위한 조치를 취합니다. 특정 손실 수준에 도달하면 거래
The PUA MultiType Pivot indicator is built on the daily chart of the previous day. The PUA MultiType Pivot indicator is one of the most popular tools in technical analysis, used by traders to identify potential reversal points in financial markets. This indicator constructs three types of Pivot points: Classic, Fibonacci, and Camarilla, each offering its unique approach to market analysis. The advantages of this indicator include: Simplicity and Clarity PUA MultiType Pivot provides clearly defi
HiLo Activator Plus
Rodrigo Galeote
5 (1)
HiLo Activator is one of the most used indicators to determine trend. Find it here with the ability to customize period and colors. This indicator also plots up and down arrows when there is a change on the trend, indicating very strong entry and exit points. HiLo fits well to different types of periods for day trading. You can easily understand when it is time to buy or sell. It works pretty good also for other periods like daily and monthly signalizing long-term trends. The use of the indicato
The indicator to trade price consolidation is designed to identify price contraction and alerts us on formation. It does this by analyzing historical price data and identifying price action patterns. The algorithm then uses this information to mark the zone , potential targets and liquidity lines, giving us valuable insights into market behavior.  Traders can adjust parameters such as colors ,alerts types and how many  previously formed zones to display on chart . Furthermore, the indicator can
CosmiCLab FIBO
Kirils Subins
CosmiCLab SMC FIBO CosmiCLab SMC FIBO is a professional trading indicator designed for traders who use Smart Money Concepts (SMC), market structure analysis and Fibonacci retracement levels. The indicator automatically detects market swings and builds Fibonacci levels based on the latest impulse movement. It also identifies market structure changes such as BOS (Break of Structure) and CHOCH (Change of Character), helping traders understand the current market direction. CosmiCLab SMC FIBO also pr
Simple supply and demand indicator which should help identify and visualize S&D zones. Settings: Color for supply zones, color for demand zones - default colors are set for dark (black) background. Number of how much zones should be created above and below current price - value "3" means there will be 3 zones above current price and 3 zones below current price. Principle: When price creates "V", reversal zone is registered. Rectangle filled based on zone type (supply / demand) is drawn if price
Order Block Box
Usiola Oluwadamilol Olagundoye
5 (3)
Next Arrival : Flip or Die Trading Arena. Flip a trading account:  https://flipordie.com/chapter-1-thirteen-doublings-double-a-trading-account/ The Advanced Order Block Indicator for MetaTrader 5 is designed to enhance technical analysis by identifying significant order blocks that sweep liquidity and create Fair Value Gaps (FVG) when pushing away. This indicator is ideal for traders who focus on institutional trading concepts and wish to incorporate advanced order flow and price action strategi
FREE
Mine Farm
Maryna Kauzova
Mine Farm is one of the most classic and time-tested scalping strategies based on the breakdown of strong price levels. Mine Farm is the author's modification of the system for determining entry and exit points into the market... Mine Farm - is the combination of great potential with reliability and safety. Why Mine Farm?! - each order has a short dynamic Stop Loss - the advisor does not use any risky methods (averaging, martingale, grid, locking, etc.) - the advisor tries to get the most
This indicator is a **Pivot-Confluence Zone Identifier** that focuses exclusively on identifying key support and resistance levels where price clusters align with classic pivot points. Here's what it does: ## Core Functionality **Pivot Confluence Detection**:  - Only displays price zones that align with classic pivot point levels (R1, R2, R3, S1, S2, S3) - **Excludes the main pivot point** - focuses only on support and resistance levels - Uses a configurable pip range to detect confluence nea
FREE
UR Gamma MT5
Krzysztof Jan Debski
UR 감마 (머신 러닝 시스템에서 발견되는 유사한 계산으로 구동됨) UR Gamma는 기존 WaveTrend 지표에 새롭고 향상된 기능을 제공하는 최첨단 재무 분석 도구입니다. 고급 디지털 신호 처리 기술을 통합함으로써 UR 감마는 기존 WaveTrend 알고리즘의 일부 제한 사항을 해결하고 가격 움직임의 추세를 식별하고 측정하기 위한 보다 정확하고 강력하며 역동적인 접근 방식을 제공합니다. UR 감마 사용의 이점: 최소한의 설정 모든 데이터는 백그라운드에서 계산되고 있으며 사용자를 위한 출력은 단 1개로 명확하고 깔끔합니다. 피로를 암시하는 배경 수준 모든 종류의 자산에 맞게 조정됩니다. 도구 업데이트를 최신 상태로 유지하고 빠진 것이 있다고 생각되면 요청을 보낼 수 있는 특별한 텔레그램 채팅이 있습니다! 왜 UR 감마인가? 목표는 확률 분포가 -1과 1 사이에서 진동하도록 하고 0을 중간 지점으로 하는 것입니다. 이를 달성하기 위해 활성화 함수라고 하는 기계 학습의
이 제품의 구매자들이 또한 구매함
SignalTech MT5
Yue Wang
5 (22)
SignalTech MT5 is an unique fully rule based trading system for EURUSD, USDCHF, USDJPY, AUDUSD, NZDUSD, EURJPY, AUDJPY, NZDJPY, CADJPY.  All the winning trades with chart setups are published on the comments page. 2026-05 3458 Pips (Until 05-20 NY Closed) 2026-04 2243 Pips 2026-03 2165 Pips 2026-02 2937 Pips 2026-01 2624 Pips 2025-12 1174 Pips It can generate signals with Buy/Sell Arrows and Pop-Up/Sound Alerts. Each signal has clear Entry and Stop Loss levels, which should be automatically flag
Azimuth Pro
Ottaviano De Cicco
5 (7)
Azimuth Pro V2: Synthetic Fractal Structure and Confirmed Entries for MT5 Overview Azimuth Pro is a multi-level swing structure indicator by Merkava Labs . Four nested swing layers, swing-anchored VWAP, ABC pattern detection, three-timeframe structural filtering, and closed-bar confirmed entries — one chart, one workflow from micro-swings to macro-cycles. This is not a blind signal product. It is a structure-first workflow for traders who care about location, context, and timing. V2 Launch Offe
ARIPoint
Temirlan Kdyrkhan
1 (1)
ARIPoint is a powerful trading companion designed to generate high-probability entry signals with dynamic TP/SL/DP levels based on volatility. Built-in performance tracking shows win/loss stats, PP1/PP2 hits, and success rates all updated live. Key Features: Buy/Sell signals with adaptive volatility bands Real-time TP/SL/DP levels based on ATR Built-in MA Filter with optional ATR/StdDev volatility Performance stats panel (Success, Profit/Loss, PP1/PP2) Alerts via popup, sound, push, or email Cu
KT Alpha Hunter Arrows MT5
KEENBASE SOFTWARE SOLUTIONS
대부분의 화살표 인디케이터는 신호만 보여주고, 나머지 판단은 모두 트레이더에게 맡깁니다. KT Alpha Hunter Arrows는 완성된 트레이딩 플랜을 제공합니다. 각 신호 화살표가 표시될 때마다 진입선, 손절선, 네 개의 익절 목표, 그리고 현재 심볼과 시간대가 지금 거래할 가치가 있는지 알려주는 실시간 엣지 판정이 함께 그려집니다. 포함된 Trade Manager EA는 사용자가 직접 진입한 뒤의 실행 관리를 맡아, 시장이 흔들리고 감정이 개입되기 쉬운 상황에서도 거래 원칙을 유지할 수 있도록 도와줍니다. 리페인트 없음. 종가 확정 후 신호만 표시. Forex, Gold, Indices 및 사용자가 거래하는 다양한 MT5 지원 상품에 맞게 설계되었습니다. 주요 기능 캔들이 마감된 후에만 표시되는 리페인트 없는 매수 및 매도 화살표. 각 신호마다 진입선, 구조적 손절선, 네 개의 익절 목표 표시. 현재 차트에서 매수와 매도 셋업을 별도로 평가하는 Edge Dashboard.
Gem SIGNAL
Shengzu Zhong
5 (1)
GEM Signal Pro GEM Signal Pro는 MetaTrader 5용 추세추종형 지표로, 차트에서 더 명확한 신호, 더 구조적인 트레이드 설정, 그리고 더 실용적인 리스크 관리를 원하는 트레이더를 위해 설계되었습니다. 단순한 화살표만 표시하는 것이 아니라, GEM Signal Pro는 전체 트레이드 아이디어를 더 깔끔하고 읽기 쉬운 방식으로 보여줍니다. 조건이 확인되면 진입가, 손절가, 목표가를 차트에 표시하여 트레이더가 설정을 더 효율적으로 검토할 수 있도록 도와줍니다. 작동 방식 이 지표는 먼저 내부 로직에 따라 유효한 초기 신호를 식별합니다. 확인 조건이 충족되면, GEM Signal Pro는 차트에 전체 설정을 표시합니다. 이를 통해 트레이더는 거래 구조를 더 명확하게 보고, 수동 분석 작업을 줄일 수 있습니다. 차트에 표시되는 거래 레벨 확인된 신호에 대해, GEM Signal Pro는 다음을 표시할 수 있습니다. 진입가 손절가 목표가 1 목표가 2 목표가 3 손
RelicusRoad Pro MT5
Relicus LLC
4.96 (24)
RelicusRoad Pro: 퀀트 시장 운영 체제 70% 할인 평생 이용권 (한정 시간) - 2,000명 이상의 트레이더와 함께하세요 왜 대부분의 트레이더는 "완벽한" 지표를 가지고도 실패할까요? 진공 상태에서 단일 개념 만으로 거래하기 때문입니다. 문맥 없는 신호는 도박입니다. 지속적인 승리를 위해서는 컨플루언스(중첩) 가 필요합니다. RelicusRoad Pro는 단순한 화살표 지표가 아닙니다. 완전한 퀀트 시장 생태계 입니다. 독점적인 변동성 모델링을 사용하여 가격이 이동하는 "공정 가치 로드"를 매핑하고, 단순 노이즈와 실제 구조적 돌파를 구분합니다. 추측은 그만두세요. 기관급 로드 로직으로 거래를 시작하세요. 핵심 엔진: "Road" 알고리즘 시스템의 중심에는 시장 상황에 실시간으로 적응하는 동적 변동성 채널인 Road Algo 가 있습니다. 세이프 라인(평형) 과 가격이 수학적으로 반전될 가능성이 높은 확장 레벨 을 투영합니다. Simple Road: 일반적인 시장을 위
우선적으로, 이 거래 도구는 전문적인 거래에 이상적인 비-다시 그리기 및 지연되지 않는 지표입니다.  온라인 강좌, 사용자 매뉴얼 및 데모. 스마트 가격 액션 컨셉트 인디케이터는 신규 및 경험 많은 트레이더 모두에게 매우 강력한 도구입니다. Inner Circle Trader Analysis 및 Smart Money Concepts Trading Strategies와 같은 고급 거래 아이디어를 결합하여 20가지 이상의 유용한 지표를 하나로 결합합니다. 이 인디케이터는 스마트 머니 컨셉트에 중점을 두어 대형 기관의 거래 방식을 제공하고 이동을 예측하는 데 도움을 줍니다.  특히 유동성 분석에 뛰어나 기관이 어떻게 거래하는지 이해하는 데 도움을 줍니다. 시장 트렌드를 예측하고 가격 변동을 신중하게 분석하는 데 탁월합니다. 귀하의 거래를 기관 전략에 맞추어 시장의 동향에 대해 더 정확한 예측을 할 수 있습니다. 이 인디케이터는 시장 구조를 분석하고 중요한 주문 블록을 식별하고 다양
MetaTrader 5용 스마트 다층 브레이크아웃 및 풀백 탐지기 "스마트하고, 간단하고, 빠르게!" 고확률 브레이크아웃 진입을 놓치는 것에 지치셨나요? 여러 차트를 몇 시간씩 스캔하면서 브레이크아웃을 추세 방향과 통화 모멘텀에 맞추려고 하지만 — 결국 움직임을 놓치고 마나요? Break Pullback은 하나의 지표로 이 모든 문제를 해결합니다. Break Pullback이란 무엇인가요? Break Pullback은 시장 구조, 브레이크아웃, 추세 지속 설정을 거래하는 트레이더를 위해 특별히 설계된 전문가급 MetaTrader 5 지표입니다. 실시간으로 여러 통화 쌍에 걸쳐 Break와 Pullback 형성을 자동으로 감지하고 — 세 가지 확인 레이어를 통해 모든 신호를 필터링합니다: 구조적 브레이크아웃 탐지 — 차트의 주요 브레이크 레벨 식별 HTF 일봉 바이어스 — 진입을 지배적인 일봉 추세 방향에 맞춤 통화 강도 지수 — 쌍을 이룬 통화 간의 모멘텀 불균형 확인 결과: 오
ARICoins
Temirlan Kdyrkhan
ARICoin is a powerful trading companion designed to generate high-probability entry signals with dynamic TP/SL/DP levels based on volatility. Built-in performance tracking shows win/loss stats, PP1/PP2 hits, and success rates all updated live. Key Features: Buy/Sell signals with adaptive volatility bands Real-time TP/SL/DP levels based on ATR Built-in MA Filter with optional ATR/StdDev volatility Performance stats panel (Success, Profit/Loss, PP1/PP2) Alerts via popup, sound, push, or email Cust
AX Forex Indicator MT5
MQL TOOLS SL
5 (1)
The AX Forex Indicator MT5 is a sophisticated trading tool designed to provide traders with a comprehensive analysis of multiple currency pairs. This   powerful indicator   simplifies the complex nature of the forex market, making it accessible for both novice and experienced traders. AX Forex Indicator uses   advanced algorithms   to detect trends, patterns and is an essential tool for traders aiming to enhance their forex trading performance. With its robust features, ease of use, and reliabl
OmniSync Projection
Antonio-alin Teculescu
5 (1)
Chronos Fractal Engine is an innovative price projection indicator for MetaTrader 5, designed to transform your technical analysis by intelligently identifying and projecting historical price patterns. Built upon an advanced correlation algorithm and the fractal principles of the market, this powerful tool visualizes potential future price movements, giving you a unique edge in your trading decisions. What is Chronos Fractal Engine? At its core, the Chronos Fractal Engine employs a sophisticat
Presenting one-of-a-kind Gann Indicator for XAUUSD IQ Gold Gann Levels is a non-repainting, precision tool designed exclusively for XAUUSD/Gold intraday trading. It uses W.D. Gann’s square root method to plot real-time support and resistance levels, helping traders spot high-probability entries with confidence and clarity. William Delbert Gann (W.D. Gann) was an exceptional market analyst whose trading technique was based on a complex blend of mathematics, geometry, astrology, and ancient calcul
" Dynamic Scalper System MT5 " 지표는 추세 파동 내에서 스캘핑 방식으로 거래하도록 설계되었습니다. 주요 통화쌍 및 금에서 테스트되었으며, 다른 거래 상품과의 호환성이 가능합니다. 추가적인 가격 변동 지원을 통해 추세에 따라 단기 포지션 진입 신호를 제공합니다. 지표의 원리 큰 화살표는 추세 방향을 결정합니다. 작은 화살표 형태의 스캘핑 신호를 생성하는 알고리즘은 추세 파동 내에서 작동합니다. 빨간색 화살표는 상승 방향을, 파란색 화살표는 하락 방향을 나타냅니다. 민감한 가격 변동선은 추세 방향으로 그려지며, 작은 화살표의 신호와 함께 작용합니다. 신호는 다음과 같이 작동합니다. 적절한 시점에 선이 나타나면 진입 신호가 형성되고, 선이 있는 동안 미결제 포지션을 유지하며, 완료되면 거래를 종료합니다. 권장되는 작업 시간대는 M1~H4입니다. 화살표는 현재 캔들에 형성되며, 다음 캔들이 이미 시작되었더라도 이전 캔들의 화살표는 다시 그려지지 않습니다. 입
QuasarEdge
Yuki Miyake
【SPECIAL INTRODUCTORY PRICE】 Release Celebration Sale! We are currently offering Quasar Edge at a special early-bird price to celebrate its official launch. This offer is limited to a specific number of copies or a limited timeframe, after which the price will increase to the standard retail value. Don't miss this opportunity to acquire a professional-grade trading environment at its lowest price. Quasar Edge & Dual Dashboard — Transform Market Chaos into Trading Confidence: The Ultimate M
Premium level Pro
Dmitriy Kashevich
Premium level is a unique indicator with more than 80% accuracy of correct predictions! This indicator has been tested for more than two months by the best Trading Specialists! The author's indicator you will not find anywhere else! From the screenshots you can see for yourself the accuracy of this tool! 1 is great for trading binary options with an expiration time of 1 candle. 2 works on all currency pairs, stocks, commodities, cryptocurrencies Instructions: As soon as the red arrow app
AriX
Temirlan Kdyrkhan
1 (4)
AriX Indicator for MT5 A powerful trend-following and signal-evaluation tool AriX is a custom MT5 indicator that combines Moving Averages and ATR-based risk/reward logic to generate clear buy/sell signals. It visualizes dynamic SL/TP levels, evaluates past trade outcomes, and displays win/loss statistics in a clean on-chart panel. Key features include: Buy/Sell signals based on MA crossovers ATR-based SL/TP1/TP2/TP3 levels with visual lines and labels Signal outcome tracking with real-time stat
Ziva LSE System
Hassan Abdullah Hassan Al Balushi
ZIVA LSE System A Professional Liquidity & Structure Execution Framework Executive Overview ZIVA LSE System is a professionally engineered analytical framework designed to interpret market behavior through structural logic and liquidity dynamics. It is not positioned as a conventional indicator. Rather, it functions as a structured execution environment that organizes price action into a clear, disciplined decision-making model. The system is built to deliver consistency, clarity, and controlled
Scalping Winning Signals Pro SWS
Muhammad Usman Siddique
5 (1)
UZFX SWS {스캘핑 승리 신호} 프로 v1.0은 빠르게 움직이는 시장에서 정확한 진입 신호를 찾는 스캘퍼, 데이 트레이더, 스윙 트레이더를 위해 Usman Zabir(UZFX LABS)가 특별히 개발한 강력하고 재도색되지 않는 지표입니다. 지연이나 잘못된 재도색 없이 신뢰할 수 있는 실시간 신호를 요구하는 트레이더에게 이상적입니다. 추천* 최적 시간대: 30분 이상. {1시간}이 가장 선호하며, 결과는 놀라울 정도입니다...! 참고: { LTL 164343 } 지표와 함께 사용하면 신호 적중률을 높일 수 있습니다. LTL 신호를 통해 추세를 파악하고, SWS 신호를 진입 신호로 활용하세요. 이 접근 방식은 승률을 극대화하고 오신호를 방지하는 데 도움이 됩니다. 주요 기능: 최근 및 과거 신호를 명확한 시각적 화살표로 표시(오래된 신호는 점으로 표시 옵션 포함). 자동 계산 및 그리기 기능: 진입선, 손절선(최근 스윙 저점/고점 기준), 다중 이익실현선(RRR 1:1, 2:1
The Zone Trading Indicator is a technical analysis tool for MetaTrader 5 that automatically identifies and displays tradable price zones across multiple timeframes to assist with structured market analysis. The indicator plots Monthly, Weekly, Daily, and H4 tradable zones , allowing traders to view higher- and lower-timeframe price areas simultaneously. These zones are designed to support one-candle–based entry approaches by highlighting predefined areas where price interaction may be monitored.
Btcusd Pro
Metin Erkamoglu
BTCUSD PRO Signal Solution for MT5 BTCUSD PRO is a decision-support indicator for MetaTrader 5, designed for traders who analyze BTCUSD or BTCUSD# with a structured signal workflow. The product is not an automated trading system. It does not open, close, or manage trades automatically. It provides analytical buy and sell signal information and displays a visual trade plan on the chart so the user can make their own trading decisions. Main purpose BTCUSD PRO is designed for traders who prefe
이 지표의 핵심 개념은 최고의 멘토 중 한 명인 Arjo가 설계하고 개발한 '공정 가치 갭 이론'에 기반하며, 저는 여기에 개발 요소를 더했습니다. 이 비디오 시리즈에는 완벽하고 포괄적인 설명을 위한 유튜브 링크와 컴파일된 MT4/MT5 시스템 실행 스크린샷이 포함됩니다. 모든 시스템은 모든 플랫폼과 사용자 요청에 맞춰 MT4와 MT5 버전으로 각각 제공될 예정입니다. 선착순 100명에게는 TradingView에서 시스템을 추가로 사용할 수 있는 PineScript 툴을 보너스로 제공합니다. 링크: https://youtu.be/gT5SFdwIYC0?si=L_ldI4E_pCx4gVhL 제공되는 기능: 1. 링크에 설명된 대로 강세/약세 공정 가치 갭 박스가 자동으로 감지 및 그려집니다. 2. 은밀한 돌파 갭 신호 3. 돌파 갭 신호 4. 푸시 알림 표시기 (선택 사항) 5. 본 시스템은 모든 시간대에서 작동합니다. 권장 시간대는 15분, 1시간, 4시간, 그리고 일일 차트입니다.
A1rum Orion Target MT5
Abdu Rais Bin Patani
A1rum In1 Target V1 은 시장 방향, 존 분석, 신호 품질을 하나의 전문적인 대시보드로 단순화하기 위해 설계된 스마트 하이브리드 트레이딩 인디케이터입니다. 더 깔끔한 차트와 빠른 의사결정을 원하는 트레이더를 위해 제작되었으며, 추세 방향성, 존 매핑, 타이밍 확인, 동적 점수 시스템을 하나의 구조로 통합합니다. 주요 기능 Smart BUY / SELL signal detection Dynamic signal strength meter Professional dashboard interface Trend bias & market quality analysis Zone-based entry confirmation Timing Pulse confirmation engine Daily session zone levels Clean body-only candle coloring Optimized for backtesting and live trading Supports all
MightyPips Sentiment Pro is a market sentiment indicator for MetaTrader 5 designed to help traders analyze buying and selling pressure in the market. The indicator evaluates market behavior to provide a clearer view of trend direction, momentum strength, and overall sentiment conditions. It helps traders understand whether buyers or sellers are currently dominating the market. Features Buyer vs Seller Analysis Displays the balance between buying and selling pressure using real-time market data.
The Propfolio Master Suite is the ultimate all-in-one analytical workstation for professional traders. Combining the power of the Beat The Market Maker (BTMM) methodology, Smart Money Concepts (SND/Liquidity), and Advanced Volume Profile, this suite replaces multiple different indicators with one optimized engine. Monitor up to 14 pairs simultaneously from a single chart, instantly identify market cycles, and seamlessly map institutional footprints with the click of a button. The Command Center
First time on MetaTrader, introducing IQ Star Lines - an original Vedic Astrology based indicator. "Millionaires don't use astrology, billionaires do" . - J.P. Morgan, Legendary American financier and banker. Welcome to  the new and updated  IQ Star Lines , the ultimate fusion of ancient planetary harmonic cycles and modern quantitative trading. published for the   first time on Metatrader. This is an indicator built by the developer, who has spent almost 2 decades trading while studying Vedic
UZFX {SSS} 스캘핑 스마트 시그널 MT5는 급변하는 시장에서 정확한 실시간 시그널을 필요로 하는 스캘퍼, 데이 트레이더, 스윙 트레이더를 위해 설계된 리페인팅 없는 고성능 트레이딩 지표입니다. (UZFX-LABS)에서 개발한 이 지표는 가격 움직임 분석, 추세 확인, 스마트 필터링 기능을 결합하여 모든 통화 쌍과 시간대에서 확률이 높은 매수 및 매도 시그널을 생성합니다. 추천* 최적 시간대: 15분 이상. {1시간}이 제가 가장 선호하는 시간대입니다. 그리고 그 결과는 정말 놀라울 정도입니다...! 참고: { LTL 164343 } 지표와 함께 사용하면 신호 적중률을 높일 수 있습니다. LTL 신호를 통해 추세를 파악하고, SSS 신호를 진입 신호로 활용하세요. 이 접근 방식은 승률을 극대화하고 오신호를 방지하는 데 도움이 됩니다. 주요 기능 스마트 신호 감지 – 강력한 추세 반전 및 지속 패턴을 정밀하게 식별합니다. 다중 시간대 스캘핑 – 모든 시간대에서 완벽하게 작동
==================================================================== SMC Pro v6.1 APEX AI — XAUUSD Gold Empire MetaTrader 5 Indicator · Smart Money Concepts · Predictive Intelligence Engine ==================================================================== SMC Pro v6.1 APEX AI is a professional Smart Money Concepts indicator system built exclusively for XAUUSD (Gold) on MetaTrader 5. It combines the complete SMC framework — Order Blocks, Liquidity sweeps, Fair Value Gaps, Break of Structure,
Meravith MT5
Ivan Stefanov
5 (1)
마켓 메이커를 위한 도구. Meravith는 다음과 같은 기능을 제공합니다: 모든 타임프레임을 분석하고 현재 유효한 추세를 표시합니다. 강세와 약세 거래량이 동일한 유동성 구간(거래량 균형 구간)을 강조 표시합니다. 서로 다른 타임프레임의 모든 유동성 레벨을 차트에 직접 표시합니다. 텍스트 기반 시장 분석을 생성하여 참고용으로 제공합니다. 현재 추세를 기반으로 목표가, 지지선 및 손절가를 계산합니다. 거래의 위험 대비 보상 비율(Risk/Reward)을 계산합니다. 계좌 잔고에 따라 포지션 크기를 산출하고 잠재 수익을 추정합니다. 시장에 중대한 변화가 발생할 경우 경고도 제공합니다. 지표의 주요 라인: 강세/약세 거래량 소진 라인 — 목표가로 사용됩니다. 시장 추세를 나타내는 라인. 시장이 강세인지 약세인지에 따라 색상이 변경되며 추세 지지선 역할을 합니다. 색상은 주로 시장 심리를 보여줍니다. 거래량 균형선(Eq). Eq(Volume Equilibrium) 라인은 시스템의 핵심입니
Shogun Trade Pro
Yuki Miyake
5 (2)
SHOGUN Trade Pro – 16 Years of Unadjusted Precision. https://www.mql5.com/en/market/product/176984 Strategic Market Structure & the Mastery of "Small Losses, Big Profits." March Special Sale – Special Price:  (Regular Price: $299)! This special offer is for a limited time only. We are currently focusing on further product development and optimization. To incorporate valuable feedback from our users into the product, we are offering this discounted price on the condition of your cooperation wi
Niveaux mensuels + PinBar + Marubozu + ALERTES (MQL5) Version : 2.0 FINAL Auteur : KOUAME N'DA LEMISSA See More Description du produit Cet indicateur avancé pour MetaTrader 5 combine l'analyse des niveaux mensuels, la reconnaissance des modèles de chandeliers japonais (PinBar et Marubozu) et un système d'alerte en temps réel. Il aide les traders à identifier rapidement les zones clés du marché et les opportunités de trading à forte probabilité. Caractéristiques principales Affichage automatiqu
제작자의 제품 더 보기
Ichimoku Hinko Hyo MTF Ichimoku Hinko Hyo MTF is a Multi Time Frame indicator. It allows to overlap several ichimoku indicators (from different timeframes) on the same chart. Doing this allows a better read of the market as informations are directly available to user. It is possible to select different curves to be displayed (Tenkan, Kijoun, Chikou, Kumo) In this version 1.0, it is possible to On M1 chart, overlap M5 and M15 indicators. On M5 chart, overlap M15 and H1 indicators. On M15 chart,
Indicateur Moving Average Filling Affiche deux moyennes mobiles (une courte et une longue) dont la durée et le type (Simple, exponentielle) est paramétrable. L'espace entre les deux moyennes mobiles est alors colorié (rempli) :     - Vert si courte > longue     - Rouge si courte < longue Il est possible de changer les couleurs selon les préférences de chacun / chacune.
This tool allows you to draw trend lines, polarity zones, supports and resistances, Fibonacci retracements and save them. The user has 4 buttons which are displayed in their default configuration at the bottom left of the main window : - A "Level" button allowing you to draw support and resistance zones - A “Trend” button allowing you to draw a trend line - A “Fibo” button allowing you to display a Fibonacci retracement - A “DELETE” button which allows you to delete the selected object. A
Flow MTF
Guillaume Jouans
This indicator takes as parameters the periods for three moving averages (Short, Long, Very_Long) and displays them for the current timeframe: - in the form of a cloud (green if Short is greater than Long, red if Short is less than Long) - as a line for the Very_Long moving average. It also allows you to display the status (BUY or SELL) of these same moving averages but for the M15, H1, H4, W1 and MN1 timeframes. This information is summarized in the window titled "TREND", where, for each timefr
필터:
리뷰 없음
리뷰 답변