SwingPointsDetector PRO Market Structure

Stop drawing market structure by hand. SwingPointsDetector PRO automates what institutional traders do manually — identifying swing points, mapping structure, and detecting structural breaks in real time.

WHAT IT DOES

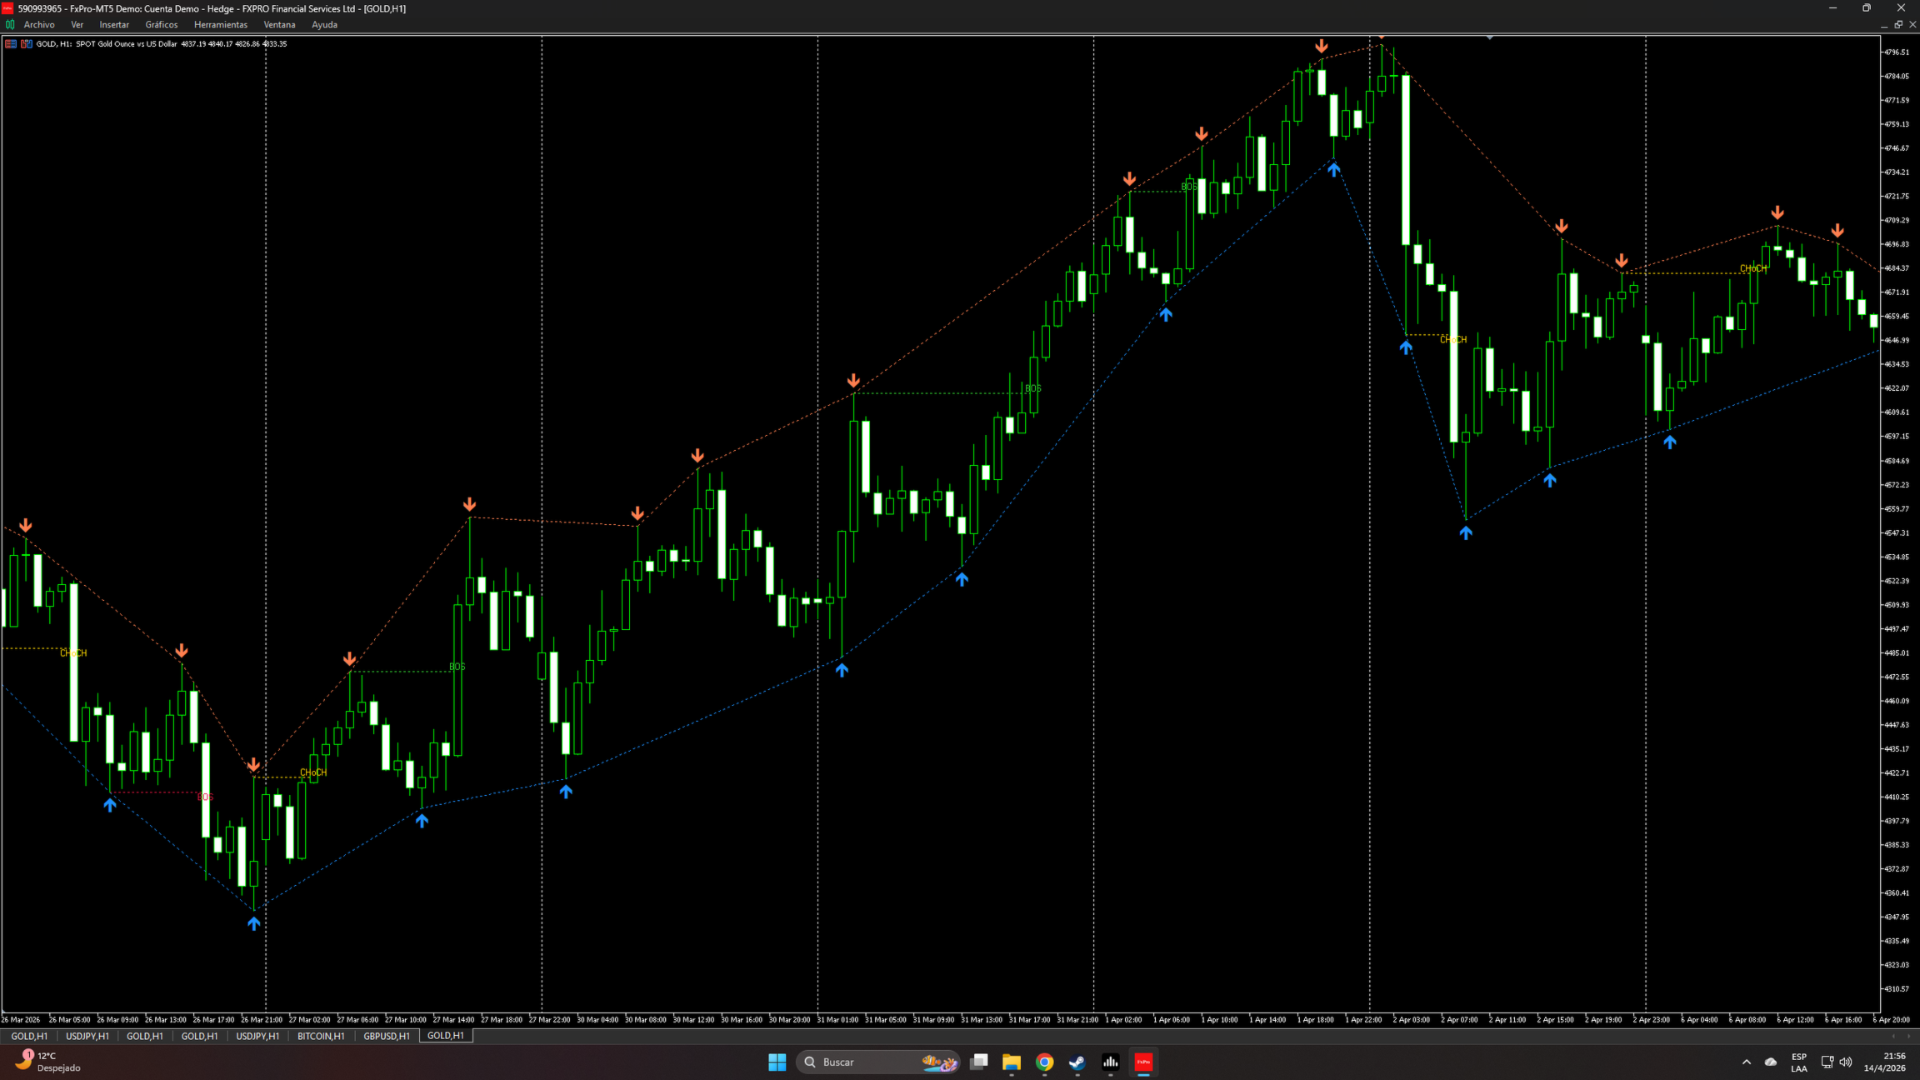
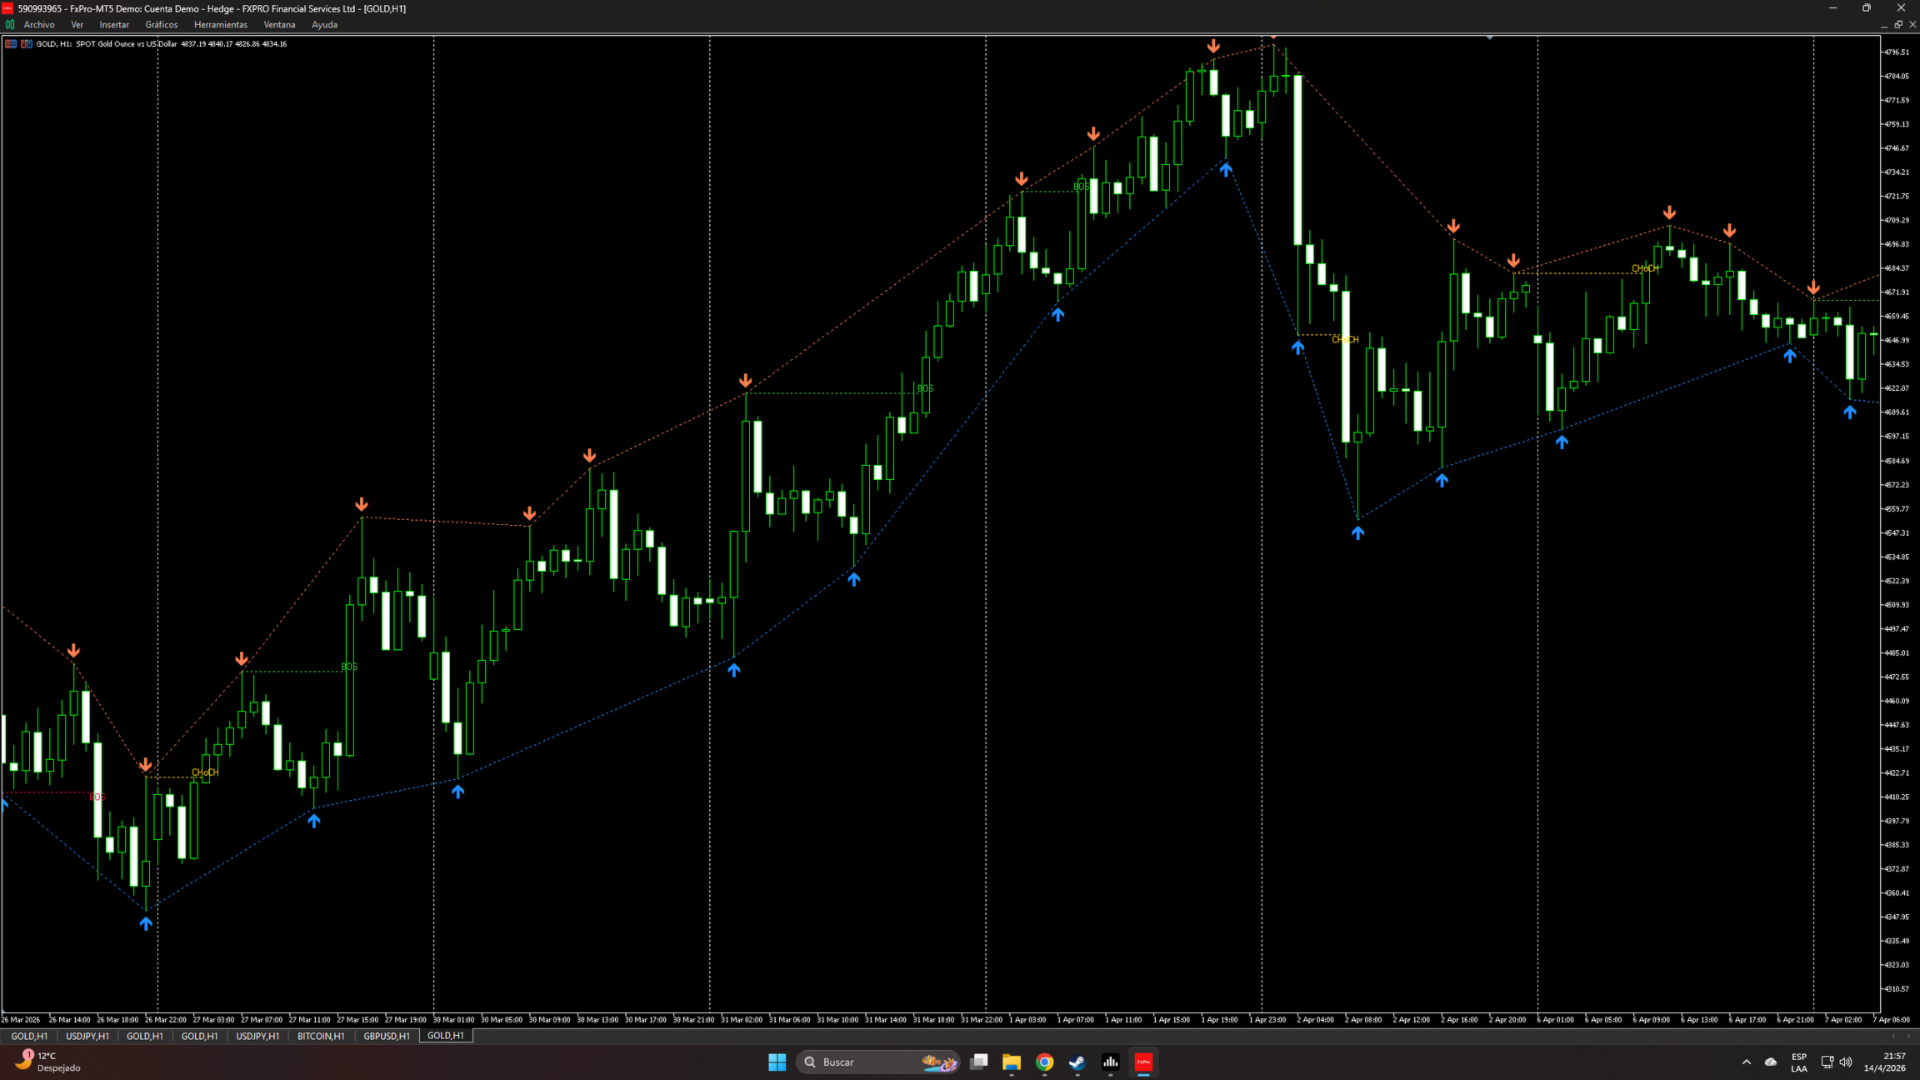
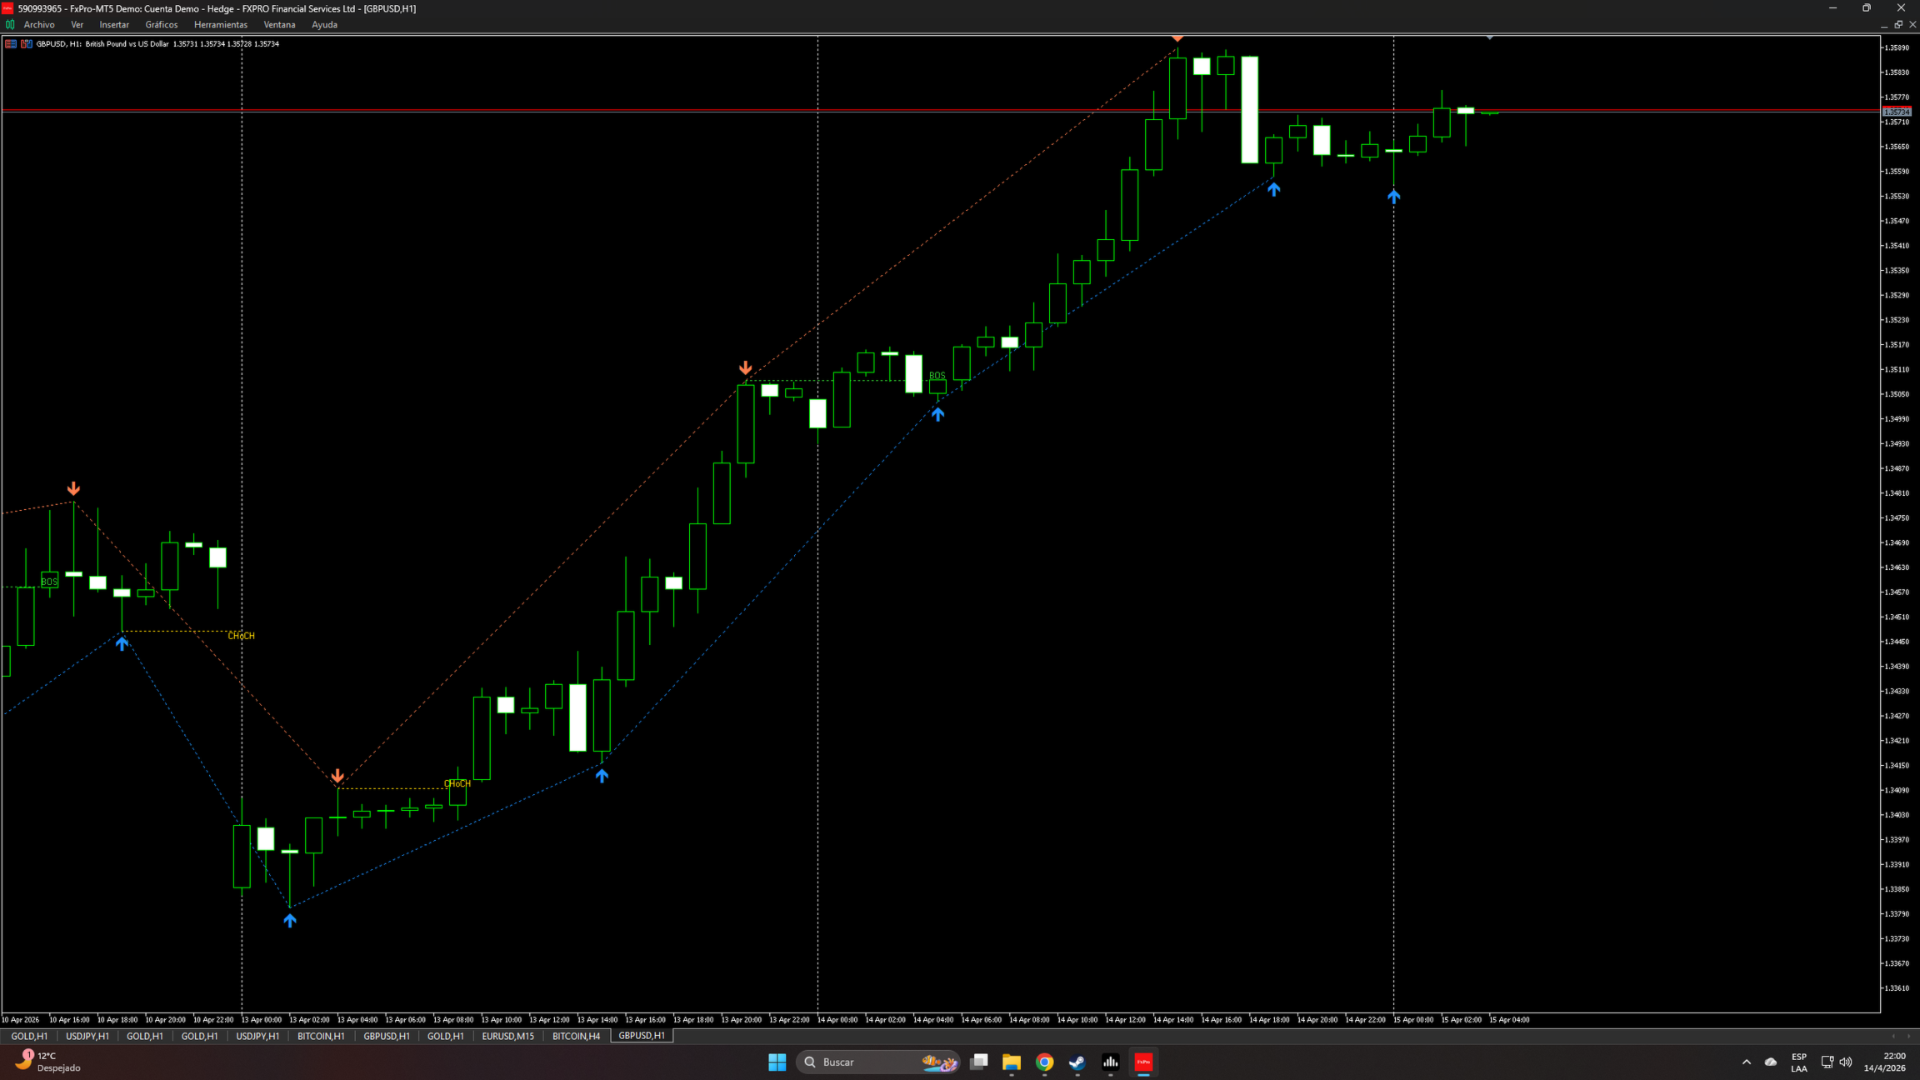
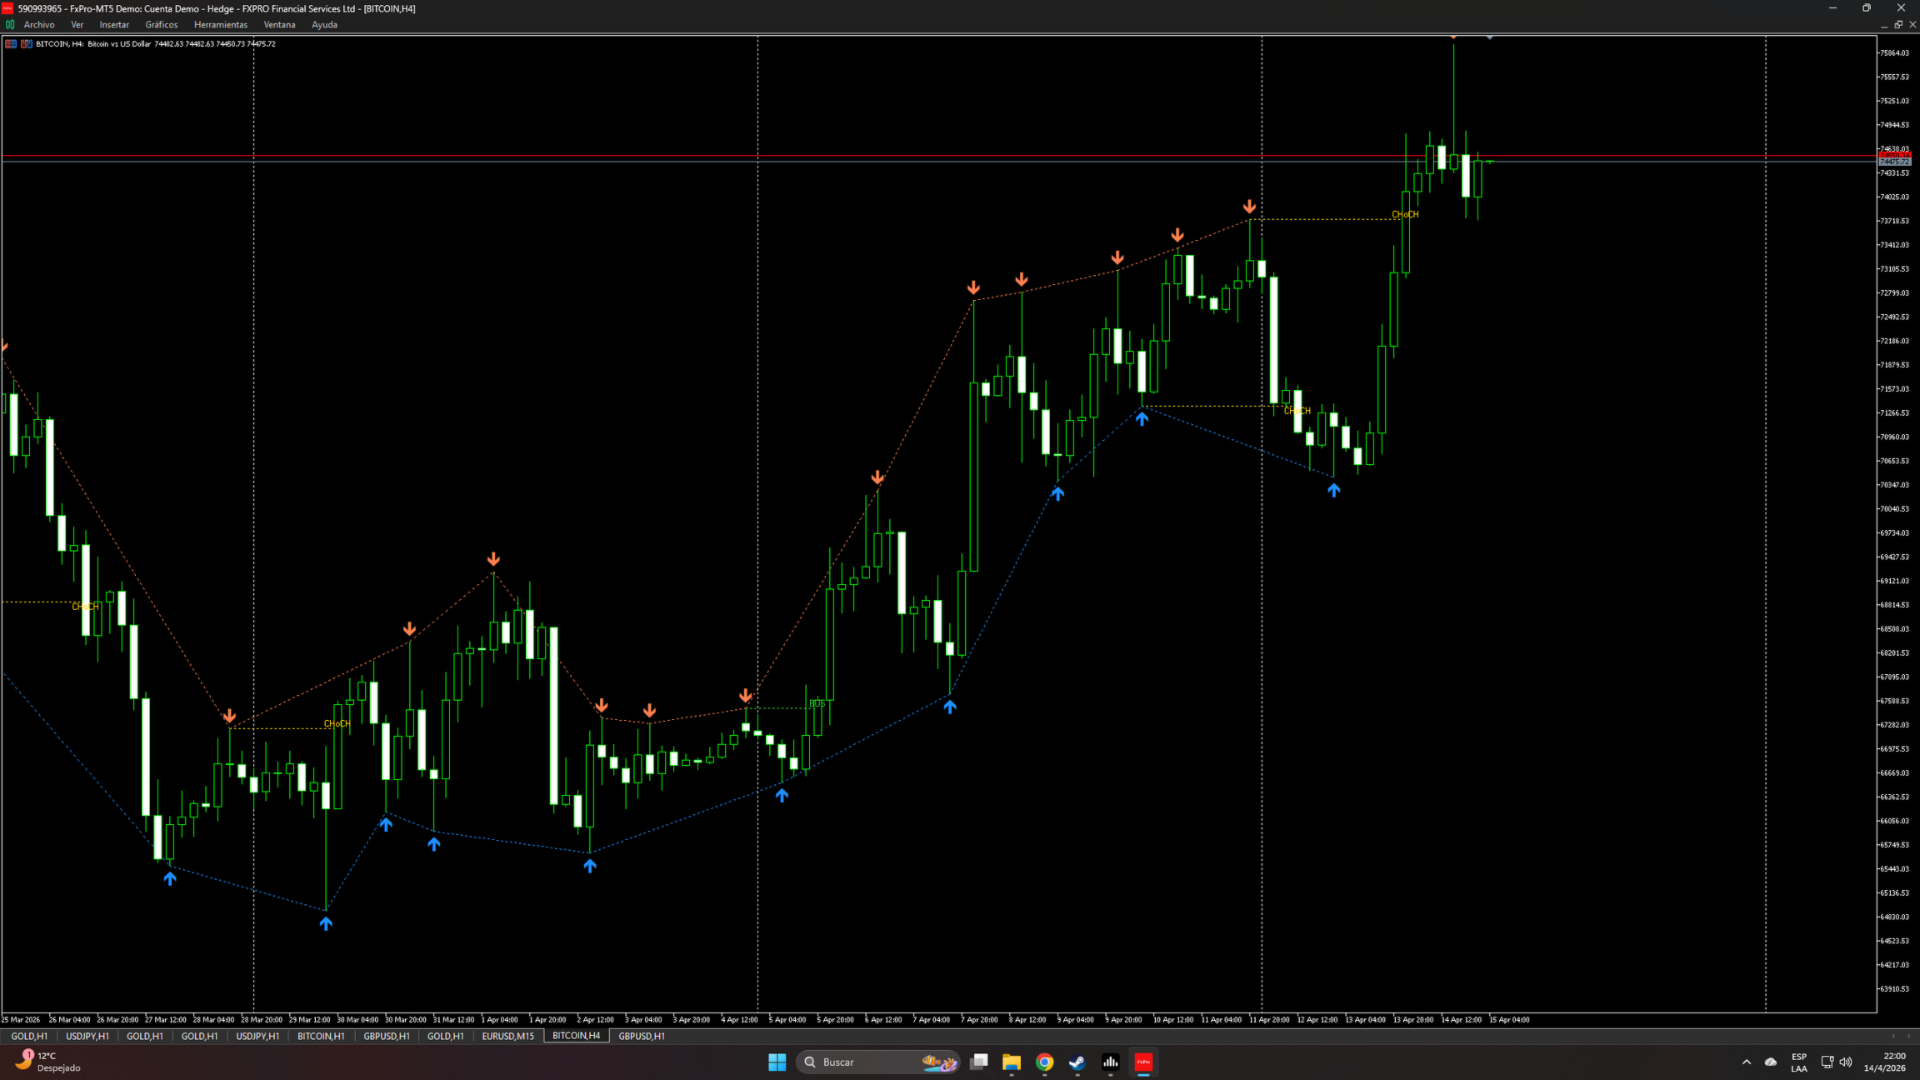
SwingPointsDetector PRO detects confirmed swing highs and swing lows using fractal logic with configurable confirmation bars. It connects them with structure lines, then monitors price for two critical events:

Break of Structure (BOS) — price breaks a swing level in the direction of the trend, confirming continuation. Only fires after a valid pullback, eliminating false signals in trending markets.

Change of Character (CHoCH) — price breaks a swing level against the trend, warning of a potential reversal. This is the earliest structural signal that the trend may be shifting.

Each event is marked with a clean label and a dashed level line from the swing origin to the break point.

KEY FEATURES

  • Non-repaint guarantee: swings are confirmed only after N bars close. Once drawn, they never move or disappear.
  • Smart BOS detection: requires alternating swing (pullback) before firing. No stacked BOS labels in trending markets.
  • Full alert system: popup, push notification, email, and sound alerts for new swings, BOS, and CHoCH. Built-in anti-spam.
  • 4 exportable indicator buffers accessible via iCustom() for EA developers.
  • Universal: works on any symbol (Forex, Gold, Crypto, Indices) and any timeframe (M1 to MN1).
  • Fully customizable: every color, arrow size, line style, and alert type is configurable.
  • Performance optimized with incremental calculation and MaxBarsToCalculate input.

HOW TO USE

  1. Attach the indicator to any chart.
  2. Set SwingStrength (default: 3) — higher values detect larger swings, lower values detect smaller ones.
  3. Enable alerts for real-time notifications.
  4. Follow swing arrows and structure lines. Watch for BOS (trend continues) and CHoCH (trend may reverse).

WHO IS THIS FOR

  • Price action and Smart Money Concepts (SMC) traders.
  • Swing traders who need objective reversal levels.
  • EA developers who need reliable swing level buffers.

INDICATOR BUFFERS (for iCustom)

Buffer 0: Swing High prices Buffer 1: Swing Low prices Buffer 2: BOS signal (+1 bullish, -1 bearish) Buffer 3: CHoCH signal (+1 bullish, -1 bearish)

If you find this indicator useful, please leave a review — it helps other traders discover the tool.


추천 제품
There is a strong correlation between tick volume and real volume.  This is important for 2 reasons: Real volume is a very important indicator because, among many other benefits, it provides strong confirmations of the emergence/dissipation of trends. Real volume is not available in Forex, instead, one has to make do with tick volume. Unfortunately, tick volume is highly broker dependent.  Additionally, it is often not used effectively to define indicators.  Virtually all indicators that use
Marcon s Deviation
Luiz Antonio De Sousa Marcon
DESVIO DE MARCON  (Desvio Dinâmico de VWAP) O Desvio de Marcon é um indicador desenvolvido com o intuito de fornecer ao TRADER uma ferramenta capaz de antecipar pontos relevantes de suporte e resistência através de canais de desvios de VWAP traçados no gráfico.  Mas qual a diferença entre o Desvio de Marcon e os canais de desvio padrão da VWAP já existentes? O Desvio de Marcon utiliza um algoritmo estatístico desenvolvido por Luiz Antonio de Sousa Marcon, que lhe dá a capacidade de se auto calib
DeMarker (DeM) indicator is another member of the Oscillator family of technical indicators. Traders use the index to determine overbought and oversold conditions, assess risk levels, and time when price exhaustion is imminent. This indicator shows DeMarker data from 9 currency pairs of your choice for all 9 timeframes. If a digital value of DeM is less or equal to DnLevel = 0.3 (or whatever number you decided to put), Green square appears. This is potentially an oversold condition and may be a
11 Modules Description & Final Analyzer Trading Guide 1. Reaction Engine 2.0 Purpose : Measures market pressure by analyzing tick movements, volume, and speed within a time window.   How it works : Calculates weighted price changes, considers tick velocity and volatility, and applies EMA smoothing.   Trading use : Strong positive values indicate buying pressure Strong negative values indicate selling pressure Use as confirmation for entry/exit signals 2. Flow Pattern Detector Purpose : Identifie
Esse indicador mede o 1º Canal de referencia e a 1º  Zona Neutra * configurar o canal macro para verificar a frequencia MAIOR H1 H4 1D * configurar o canal micro para verificar a frequencia Menor 1M 5M 15M Como instalar o Indicador fimathe. E uma pré mentoria tem uma estrategia Secreta bonus nesse video . assitao o video para enteder as logicas que podemos iniciar com esse indicador. https://www.youtube.com/playlist?list=PLxg54MWVGlJzzKuaEntFbyI4ospQi3Kw2
Momentum Explosion Pro is an advanced trading indicator designed to help traders identify and capitalize on powerful market movements. By analyzing momentum and volatility dynamics, this tool provides clear buy and sell signals, empowering traders to make precise and timely decisions. Key Features: Momentum and Explosion Signals:   Accurately detects shifts in market momentum and explosive price movements to highlight profitable opportunities. Customizable Alerts:   Stay informed with notificati
SAR Vision MTF
Michal Hrubes
SAR Vision MTF – MT5용 다중 타임프레임 Parabolic SAR 지표 SAR Vision MTF 는 상위 타임프레임의 Parabolic SAR 값을 현재 차트에 직접 표시하는 다중 타임프레임 기술 분석 도구입니다. 여러 차트를 전환하지 않고도 더 넓은 시장 추세를 분석하는 데 도움을 줍니다. 주요 기능 다중 타임프레임 기능 – 상위 타임프레임(예: M5, M15, H1, H4)의 SAR 신호를 하위 타임프레임 차트에서 확인할 수 있습니다. 사용자 지정 가능 – 점 크기, 색상 및 선택한 타임프레임을 사용자 취향에 맞게 조절할 수 있습니다. 명확한 시각적 표현 – 각 타임프레임마다 다른 색상을 사용하여 추세 신호를 구분하기 쉽습니다. 가볍고 효율적 – 다양한 차트 유형에서 원활하게 작동하도록 최적화되었습니다. 사용 사례 추세 관찰 – 상위 타임프레임의 SAR 신호를 모니터링하면 현재 차트 움직임에 대한 추가적인 시장 상황을 파악할 수 있습니다. 잠재적 반전 탐지 – 다
Market Profile Osw MT5
William Oswaldo Mayorga Urduy
사용자 매뉴얼: Market Profile Osw Market Profile Osw는 특정 기간 동안의 거래량 및 가격 분포를 시각화할 수 있는 고급 경매 분석 도구입니다. 기존의 캔들 차트와 달리, 이 시스템은 가장 활발한 거래가 발생한 위치를 보여주어 실제 시장 참여를 기반으로 한 심리적 지지 및 저항 영역을 식별할 수 있게 해줍니다. 1. 매개변수 가이드 (입력 메뉴) 일반 설정 Show Market Profile: 차트에서 프로필 표시를 활성화 또는 비활성화합니다. Volume Type: 가격 변동 횟수(Tick) 또는 실제 거래량(특정 브로커 및 자산에서 사용 가능) 중 활동 측정 방법을 선택할 수 있습니다. Look Back Bars: 지표가 현재 프로필을 생성하기 위해 소급할 캔들 개수를 정의합니다. Profile Right Side: 프로필을 가격축 옆(오른쪽)에 그릴지 아니면 분석 기간의 시작점(왼쪽)에 그릴지 결정합니다. Seconds Refresh: 지표가 데
GRat Clusters  is an indicator that shows various data in the form of clusters on a price chart: volume, delta, ratio of sales and purchases, etc. It allows you to visually see the market profile in real time and on history at a given depth. Capabilities 1.8 types of cluster data: volume, delta, purchases   and sales , volume and delta, imbalance between sales and purchases , volume profile, delta profile, buy and sell profile. 2. A cluster period can be either any available in MT5 timeframe or
WVAP Scalping
Domantas Juodenis
Professional-Grade VWAP + Market Profile Technology for Precision Trading VWAP Scalping Pro is an advanced analytical tool that integrates Volume-Weighted Average Price (VWAP) analysis with professional Market Profile visualization. It provides traders with institutional-style insights into price structure, volume distribution, and session dynamics — ideal for scalping, intraday, and swing trading strategies. Key Features Triple VWAP Strategy Framework Trend VWAP (50) – Defines long-term dire
Pull It Back MT5
Salvatore Caligiuri
PROMOTIONAL PERIOD - ONLY 2 COPIES LEFT OF FIRST 10 BUYERS AT PRICE 300,00$!!! CHECK SCREENSHOTS AND COMMENTS FOR OUR STRATEGY RULES AND LIVE TRADES SIGNALS PULL IT BACK  is a revolutionary trading system and a complete strategy with advanced algorithm developed to detect the trend direction after a  PULLBACK , a  RETREACEMENT  or a  KEY LEVEL BOUNCE . The goal of this indicator is to get as many pips as possible from market trend. Following strictly the rules of the strategy, you can become a
Tik Tok
Ivan Simonika
The Tik Tok indicator was created on the basis of the original extreme search indicators, the indicator is well suited for determining a reversal or a big sharp jerk in one direction, thanks to it you will know when this happens it will notify you when a blue dot for buying red for sale appears. It basically uses the process of detecting the rate of change in price growth and allows you to find entry and exit points from the market. fundamental technical indicator that allows you to assess the
VolumeTracker4X
Oclair Gallacini Prado
VolumeTracker 4X – High-Volume Candle & VWAP Main Description: VolumeTracker 4X automatically identifies the highest-volume candle of the day in the Forex market and calculates the volume-weighted average price (VWAP) from that candle. It draws dynamic channels based on the high and low prices from the highest-volume candle to the current candle , helping you visualize key support and resistance areas . Created for traders who want more precise decisions using real trading volume as a reference.
Trailing Uses Standard Deviation.   A daptive_Trailing_uses_StdDev_Indicator is an indicator of directional movement that allows you to identify a trend at the time of its inception and set the levels of a protective stop. Unlike trailing with a constant distance, the indicator uses the distance to the price proportional to the current standard deviation of StdDev. The distance is equal to the product of the standard deviation and the constant coefficient set by the user. Thus, the trailing
Session separator indicator draws boxes for each trading session to show the trader open and close hours with its high and low. Key features: Option to set hours and colours for 3 trading sessions. Boxes update immediately when breaking out of high/low. Hour shift or auto time zone. Choose the amount of days to draw session boxes. Indicator works on H1 and lower for visibility. Choose border style
거래량 가중 MACD 볼륨 가중 MACD(VW-MACD)는 Buff Dormeier가 작성했으며 그의 책 Investing With Volume Analysis에 설명되어 있습니다. 볼륨 가중 가격 추세의 수렴과 발산을 나타냅니다. 볼륨을 포함하면 VW-MACD가 일반적으로 기존 MACD보다 응답성과 신뢰성이 높아집니다.   MACD(이동 평균 수렴 발산)란 무엇입니까? 이동 평균 수렴 발산은 1979년 Gerald Appel에 의해 만들어졌습니다. 표준 MACD는 단기 지수 평균과 장기 지수 평균 간의 차이를 표시합니다. 차이(MACD 라인)가 양수이고 상승하면 가격 추세가 상승하고 있음을 나타냅니다. MACD 라인이 음수이면 가격 추세가 하락하고 있음을 나타냅니다. 이 차이의 부드러운 지수 평균이 계산되어 MACD 신호 라인을 형성합니다. MACD선이 MACD 신호선 위에 있으면 MACD의 모멘텀이 상승하고 있음을 나타냅니다. 마찬가지로 MACD가 MACD 신호선 아래
This product is designed for the MT5 platform and offers two key features: VWAP (Volume Weighted Average Price) calculation and Volume Profile analysis. Advantages: VWAP Calculation: The product calculates the VWAP, which is a popular indicator used by traders to determine the average price of a security based on its trading volume. It helps identify potential buying or selling opportunities by comparing the current price to the average price weighted by volume. Volume Profile Analysis: The prod
LiquidXPro Reverse
Alex Amuyunzu Raymond
LiquidX Pro - Precision Reversal Engine "Professional multi-confluence reversal detector that identifies high-probability tops and bottoms using institutional liquidity sweeps, volume exhaustion, and momentum divergence" Overview LiquidX Pro - Precision Reversal Engine is a sophisticated, professional-grade indicator designed for serious traders who want to catch high-probability market reversals with institutional precision. Stop chasing breakouts that fail—start trading reversals that pay. Thi
RAD Real Acummulation and Distribution
Jose Alejandro Jacome Jimenez
RAD CRITICAL LEVES RAD indicator tracks “Relevant Volume” in real time, identifying accumulation and distribution processes, projecting them in the chart as SUPPORT or RESISTANCE zones. Natural   support   and resistance levels are generated by Volume Accumulation and Distribution processes. As these processes evolve, levels at which the relevant volume in the market place is positioned, become difficult areas to cross upwards or downwards. By using this information, traders can identify very s
This indicator is designed for M1 time frame and shows: Sum of points when the price goes up (Green Histogram). Sum of points when the price goes down (Red Histogram).  In other words, by the number and ratio of bullish points to bearish ones, you can do a technical analysis of the state of the market. If the green histogram prevails over the red one, you can conclude that at the moment the buyers are stronger than the sellers, and vice versa, if the red histogram prevails over the green, the s
Color Histogram Volume Set
Ricardo Almeida Branco
Do you use volume in your reading of the market? Certainly many traders use it, and do not imagine operating without it. The Color Histogram Volume Set indicator allows the user to choose the value that he considers interesting to monitor. When you pass this you will have visual confirmation and if you want you will also have the audible alert that is given by the indicator. Of course, there are other ways to try to find a high volume, such as assessing whether the volume is above av
Strength Oscillator Pro
Pieter Gerhardus Van Zyl
Check out my German Pro Signal -  https://www.mql5.com/en/signals/2354346 Strength Oscillator Pro is a professional-grade momentum oscillator designed to measure directional price pressure using percentage-based strength analysis over a configurable lookback window. Rather than relying on traditional bounded oscillators, it evaluates true relative price change , making it highly effective for identifying momentum shifts, trend strength, and continuation zones across all markets and timeframes.
MT5용 Crypto_Forex 지표 "추세 진입 히스토그램", 리페인트 없음. - 추세 진입 히스토그램 지표는 Entry_bar가 나타나면 추세 방향 진입 신호를 찾는 데 사용할 수 있습니다. - 이 지표는 가격과 거래량을 모두 고려하여 계산하는 고유한 특징을 가지고 있습니다. - 추세 진입 히스토그램은 두 가지 색상으로 제공됩니다. 빨간색은 약세 추세, 파란색은 강세 추세입니다. - 안정적인 추세(동일한 색상의 히스토그램 막대가 최소 10개 연속 표시)가 나타나면 Entry_bar가 표시될 때까지 기다리세요. - 진입 신호는 히스토그램에서 반대 색상의 열 하나와 초기 추세 색상의 다음 열입니다(그림 참조). - 숏 목표가를 사용하세요. 현재 추세에 따라 차트에서 가장 가까운 고가/저가를 사용하세요. - 지표에는 모바일 및 PC 알림 기능이 내장되어 있습니다. 사용 방법: - 매수 신호: 안정적인 강세 추세(파란색 히스토그램 막대) + 히스토그램의 빨간색 막대 1개 + 파란색
VWAP Indicator MT5
Kyra Nickaline Watson-gordon
Description : VWAP (Volume-Weighted Average Price) is the ratio of the value traded to total volume traded over a particular time horizon. It is a measure of the average price at which pair is traded over the trading horizon. Read More. All Symbols and All Timeframes are supported. Indicator Inputs :     VWAP Mode : Mode of VWAP Calculation. Options can be selected : Single,Session,Daily,Weekly,Monthly     Volumes : Real Volumes,Tick Volumes     Price Type : Used price for calculating. O
Quantum Viscosity Indicator
Muhammad Ahmad Abdulaziz Al-jamal
QVET Pro – Quantum Viscosity & Elasticity Tracker QVET Pro is a professional MetaTrader 5 indicator designed to analyze market behavior using volume, volatility, and statistical normalization. Instead of following traditional lagging indicators, QVET focuses on how price reacts to volume by measuring market viscosity and price elasticity . This helps traders understand when the market is consolidating, stretching, or preparing for a potential move. The indicator uses Z-score normalization to red
VIDYA Enhanced
David Ben Svaiter
The VIDYA-ENHANCED indicator (Variable Index Dynamic Average) is a technical analysis tool used to identify trends and sideways movements. It dynamically adjusts its sensitivity based on market volatility, using the Chande Momentum Oscillator as a volatility index. This feature allows VIDYA-ENHANCED to be more agile during periods of significant price movements, while remaining more stable during less volatile phases.  Features: - Select the price from 12 options - 5 more than the Metatrader
CoioteAverageSpreed
Alexandre Moraes De Souza Lima
O indicador CoioteAverageSpreed é uma releitura do indicador AverageSpreed. Ele mostra a relação de esforço x resultado entre o volume e a volatilidade do preço. Com o volume heatmap é possível identificar visualmente se o preço foi deslocado com uma quantidade maior de volume e se o deslocamento do preço apresentou maior resultado ou não. É possível identificar momentos de ignição e exaustão do movimento, além de injeções de fluxo para dar continuidade a um movimento.
구조가 확인됐다. 오더블록도 맞았다. 브레이크아웃에 진입했다. 가격이 40핍 반전했다. 프리미엄 존을 놓쳤고, FVG 지지가 없었으며, 킬존 시간대 밖이었기 때문이다. 세 가지 요소가 "아니오"라고 했다. 당신은 하나만 확인했다. SMC Confluence Score MT5 는 8개의 기관 분석 레이어를 동시에 스캔하고 실시간으로 단일 매수/매도 컨플루언스 점수(0-10)를 출력합니다. 지표와 타임프레임을 전환하는 대신, 트레이드 전에 모든 SMC 요소를 하나의 패널에서 확인할 수 있습니다. 표시 내용: 컨플루언스 점수 (0-10): OB, FVG, 구조, 존, 세션, 유동성, HTF 방향을 하나의 숫자로 통합. 셋업 품질을 한눈에 파악. 시장 구조 (BOS + CHoCH): 스윙 및 내부 레벨 감지. 진입 전 추세 전환 확인. 강도 등급이 있는 오더블록: 미해소 OB의 거래량 기반 강도 지표. 기관이 포지션을 잡은 구역 우선순위 설정. 공정가치 갭 (FVG): ATR 필터된 불균형
Session Volume Profile  is an advanced graphical representation that displays trading activity during Forex trading sessions at specified price levels. The Forex market can be divided into four main trading sessions: the Australian session, the Asian session, the European session and the favorite trading time - the American (US) session. POC  - profile can be used as a support and resistance level for intraday trading. VWAP  - Volume Weighted Average Price. ATTENTION  ! For the indicator to w
TPO Profile
Simon Draxler
DRX Market Profile Master v4 — MetaTrader 5용 기관 수준 Market Profile Market Profile 및 Time Price Opportunity(TPO) 분석은 실제 시장 구조를 이해하는 가장 효과적인 방법 중 하나입니다. DRX Market Profile Master v4는 이 방법론을 MetaTrader 5에 완전히 구현하며, 전문 거래 플랫폼에 필적하는 기능 세트를 제공합니다. 이 지표는 각 세션마다 어떤 가격 영역이 시장에 의해 수용되었는지(Value Area), 가장 높은 거래 활동이 발생한 위치(Point of Control), 그리고 시장이 빠르고 일방적으로 통과한 영역(Single Prints)을 자동으로 계산합니다. 이 정보는 정밀한 진입 및 청산 결정을 위한 기반을 형성합니다. How does that work? 세션 유형 및 히스토리 보기 이 지표는 시간별, 일별, 주별, 월별 및 사용자 정의의 다섯 가지 세션 유형을
이 제품의 구매자들이 또한 구매함
SuperScalp Pro
Van Minh Nguyen
4.55 (20)
SuperScalp Pro – 고급 다중 필터 스캘핑 인디케이터 시스템 SuperScalp Pro는 클래식 Supertrend와 여러 지능형 확인 필터를 결합한 고급 스캘핑 인디케이터 시스템입니다. 해당 인디케이터는 M1부터 H4까지 모든 타임프레임에서 효율적으로 작동하며, 특히 XAUUSD, BTCUSD 및 주요 외환 통화쌍에 적합합니다. 독립형 시스템으로 사용하거나 기존 거래 전략에 유연하게 통합할 수 있습니다. 이 인디케이터는 11개 이상의 필터를 통합하며, 빠른/느린 EMA, 추세 판별용 3개의 EMA, EMA 기울기(EMA slope), RSI, ADX, 거래량(Volume), VWAP, 볼린저 밴드 돌파(Bollinger Bands Breakout) 및 MACD 다이버전스 필터 등을 포함합니다. 스마트 캔들 필터는 캔들 종가를 확인하여 약한 신호를 제거하고, 3 EMA와 MACD 다이버전스 필터를 결합한 추세 인식 메커니즘은 더 높은 승률의 신호를 선별하는 데 도움을 줍니
Azimuth Pro
Ottaviano De Cicco
5 (6)
Azimuth Pro V2: Synthetic Fractal Structure and Confirmed Entries for MT5 Overview Azimuth Pro is a multi-level swing structure indicator by Merkava Labs . Four nested swing layers, swing-anchored VWAP, ABC pattern detection, three-timeframe structural filtering, and closed-bar confirmed entries — one chart, one workflow from micro-swings to macro-cycles. This is not a blind signal product. It is a structure-first workflow for traders who care about location, context, and timing. V2 Launch Offe
Entry In The Zone and SMC Multi Timeframe is a real-time 2-in-1 market analysis tool that combines market structure analysis and a No Repaint BUY / SELL signal system into a single indicator, built on Smart Money Concepts (SMC) — a widely adopted framework used by professional traders to understand market structure. This indicator helps you see the market more clearly, make decisions based on structure rather than guesswork, and focus on high-probability zones where price is more likely to react
Power Candles MT5
Daniel Stein
4.75 (8)
Power Candles – 모든 시장을 위한 강도 기반 진입 신호 Power Candles 는 Stein Investments의 검증된 강도 분석을 가격 차트에 직접 제공합니다. 가격 움직임에만 반응하는 대신, 각 캔들은 실제 시장 강도를 기준으로 색상화되어 모멘텀 형성, 강도 가속, 명확한 추세 전환을 즉시 파악할 수 있습니다. 모든 시장을 위한 단일 로직 Power Candles는 모든 거래 심볼 에서 자동으로 작동합니다. 현재 심볼이 Forex인지 비-Forex 시장인지 자동으로 감지하여 내부적으로 적절한 강도 모델을 적용합니다. Forex 및 Gold 는 FX Power Delta 값을 사용합니다 (절대값 범위 최대 100) 지수, 크립토 및 CFD 는 IX Power Strength 값을 사용합니다 (절대값 범위 최대 50) 필요한 강도 계산은 Power Candles에 완전히 내장되어 있습니다. 캔들 색상이나 신호 로직을 위해 추가 인디케이터는 필요하지 않습니다. 가격
FX Trend MT5 NG
Daniel Stein
5 (4)
FX Trend NG: 차세대 멀티 마켓 트렌드 인텔리전스 개요 FX Trend NG 는 다중 시간 프레임 기반의 전문 트렌드 분석 및 시장 모니터링 도구입니다. 몇 초 만에 전체 시장 구조를 파악할 수 있도록 설계되었습니다. 여러 차트를 일일이 전환할 필요 없이, 어떤 종목이 추세에 있는지, 어디에서 모멘텀이 약화되고 있는지, 그리고 어떤 시간 프레임이 서로 정렬되어 있는지 즉시 확인할 수 있습니다. 출시 기념 특별 혜택 – FX Trend NG 를 $30 (6개월) 또는 $80 평생 라이선스 로 이용할 수 있습니다. 이미 Stein Investments 고객이신가요? -> 메시지를 보내 전용 고객 그룹에 참여하세요. 설정이나 사용 방법이 필요하신가요? -> Stein Investments 공식 페이지 를 방문하세요. 1. FX Trend NG가 특별한 이유 3단계 추세 로직 – 단순한 Buy / Sell이 아닙니다 • 대부분의 지표는 Buy 또는 Sell 두 가지 상태만 제
Divergence Bomber
Ihor Otkydach
4.9 (86)
이 지표를 구매하신 분께는 다음과 같은 혜택이 무료로 제공됩니다: 각 거래를 자동으로 관리하고, 손절/익절 수준을 설정하며, 전략 규칙에 따라 거래를 종료하는 전용 도우미 툴 "Bomber Utility" 다양한 자산에 맞게 지표를 설정할 수 있는 셋업 파일(Set Files) "최소 위험", "균형 잡힌 위험", "관망 전략" 모드로 설정 가능한 Bomber Utility의 셋업 파일 이 전략을 빠르게 설치, 설정, 시작할 수 있도록 돕는 단계별 영상 매뉴얼 주의: 위의 모든 보너스를 받기 위해서는 MQL5 개인 메시지 시스템을 통해 판매자에게 연락해 주세요. 독창적인 커스텀 지표인 “Divergence Bomber(다이버전스 봄버)”를 소개합니다. 이 지표는 MACD 다이버전스(괴리) 전략을 기반으로 한 올인원(All-in-One) 거래 시스템입니다. 이 기술 지표의 주요 목적은 가격과 MACD 지표 간의 다이버전스를 감지하고, **향후 가격이 어느 방향으로 움직일지를 알려주는
이 지표를 구매하면 제 프로페셔널 트레이드 매니저를 무료로 드립니다. 우선 이 거래 시스템이 리페인팅, 리드로잉 및 레이그 인디케이터가 아니라는 점을 강조하는 것이 중요합니다. 이는 수동 및 로봇 거래 모두에 이상적인 것으로 만듭니다. 온라인 강좌, 설명서 및 프리셋 다운로드. "스마트 트렌드 트레이딩 시스템 MT5"은 새로운 및 경험이 풍부한 트레이더를 위해 맞춤형으로 제작된 종합적인 거래 솔루션입니다. 10개 이상의 프리미엄 인디케이터를 결합하고 7개 이상의 견고한 거래 전략을 특징으로 하여 다양한 시장 조건에 대한 다목적 선택이 가능합니다. 트렌드 추종 전략: 효과적인 트렌드 추이를 타기 위한 정확한 진입 및 손절 관리를 제공합니다. 반전 전략: 잠재적인 트렌드 반전을 식별하여 트레이더가 범위 시장을 활용할 수 있게 합니다. 스캘핑 전략: 빠르고 정확한 데이 트레이딩 및 단기 거래를 위해 설계되었습니다. 안정성: 모든 인디케이터가 리페인팅, 리드로잉 및 레이그가 아니므로 신뢰
Quantum TrendPulse
Bogdan Ion Puscasu
5 (23)
SuperTrend   ,   RSI   ,   Stochastic   의 힘을 하나의 포괄적인 지표로 결합하여 트레이딩 잠재력을 극대화하는 궁극의 트레이딩 도구   인 Quantum TrendPulse를   소개합니다. 정밀성과 효율성을 추구하는 트레이더를 위해 설계된 이 지표는 시장 추세, 모멘텀 변화, 최적의 진입 및 종료 지점을 자신 있게 식별하는 데 도움이 됩니다. 주요 특징: SuperTrend 통합:   주요 시장 추세를 쉽게 따라가고 수익성의 물결을 타세요. RSI 정밀도:   매수 과다 및 매도 과다 수준을 감지하여 시장 반전 시점을 파악하는 데 적합하며 SuperTrend 필터로 사용 가능 확률적 정확도:   변동성이 큰 시장에서 숨겨진 기회를 찾기 위해 확률적 진동   을 활용하고 SuperTrend의 필터로 사용 다중 시간대 분석:   M5부터 H1 또는 H4까지 다양한 시간대에 걸쳐 시장을 최신 상태로 유지하세요. 맞춤형 알림:   맞춤형 거래 조건이 충족되면
Meridian Pro
Ottaviano De Cicco
5 (1)
Meridian Pro: Professional Multi-Timeframe Trend Matrix for MT5 Overview Meridian Pro is a multi-timeframe trend matrix by Merkava Labs that compresses directional state, strength, momentum condition and matrix agreement into one compact panel. One adaptive engine, applied consistently from M1 to W1. No per-symbol tuning. No indicator stacking. One structured readout across every asset and every timeframe. Launch Offer — Get Meridian Pro for USD 99 (introductory). Regular price: USD 149. 1. Why
CGE Trading Suite
Carl Gustav Johan Ekstrom
5 (1)
Institutional-Grade Analytics for MT5 CGE Trading Suite delivers the analytical edge typically reserved for professional trading desks. The platform integrates a full suite of analytical tools into one seamless workflow: dynamic grid mapping, liquidity behavior analysis, ECM, trend lines, MIDAS, trade cycles, and directional channel projections. Together, these provide a unified view of market structure and momentum. Directional clarity is further enhanced by the capital flow index, which measu
소개       Quantum Breakout PRO   , 브레이크아웃 존 거래 방식을 변화시키는 획기적인 MQL5 지표! 13년 이상의 거래 경험을 가진 숙련된 트레이더 팀이 개발한       퀀텀 브레이크아웃 PRO       혁신적이고 역동적인 브레이크아웃 존 전략으로 거래 여정을 새로운 차원으로 끌어올리도록 설계되었습니다. Quantum Breakout Indicator는 5개의 이익 목표 영역이 있는 브레이크아웃 영역의 신호 화살표와 브레이크아웃 상자를 기반으로 한 손절 제안을 제공합니다. 초보자 거래자와 전문 거래자 모두에게 적합합니다. Quantum EA 채널:       여기를 클릭하세요 중요한! 구매 후 설치 매뉴얼을 받으려면 개인 메시지를 보내주십시오. 추천: 기간: M15 통화쌍: GBPJPY, EURJPY, USDJPY,NZDUSD, XAUUSD 계정 유형: 스프레드가 매우 낮은 ECN, Raw 또는 Razor 브로커 시간: GMT +3 중개인 :
Trend Screener Pro MT5
STE S.S.COMPANY
4.85 (104)
트렌드 표시기, 트렌드 트레이딩 및 필터링을 위한 획기적인 고유 솔루션, 하나의 도구 안에 내장된 모든 중요한 트렌드 기능! Forex, 상품, 암호 화폐, 지수 및 주식과 같은 모든 기호/도구에 사용할 수 있는 100% 다시 칠하지 않는 다중 시간 프레임 및 다중 통화 표시기입니다. Trend Screener는 차트에 점이 있는 화살표 추세 신호를 제공하는 효율적인 지표 추세 추종 지표입니다. 추세 분석기 표시기에서 사용할 수 있는 기능: 1. 트렌드 스캐너. 2. 최대 이익 분석이 있는 추세선. 3. 추세 통화 강도 측정기. 4. 경고가 있는 추세 반전 점. 5. 경고가 있는 강력한 추세 점. 6. 추세 화살표 Trend Screener Indicator가 있는 일일 분석 예, 일일 신호 성능...등은 여기에서 찾을 수 있습니다. 여기를 클릭하십시오. LIMITED TIME OFFER : Trend Screener Indicator는 50$ 및 평생 동안만 사용할 수 있습니다.
Grabber System MT5
Ihor Otkydach
4.83 (23)
탁월한 기술적 지표인 Grabber를 소개합니다. 이 도구는 즉시 사용 가능한 “올인원(All-Inclusive)” 트레이딩 전략으로 작동합니다. 하나의 코드 안에 강력한 시장 기술 분석 도구, 매매 신호(화살표), 알림 기능, 푸시 알림이 통합되어 있습니다. 이 인디케이터를 구매하신 모든 분들께는 다음의 항목이 무료로 제공됩니다: Grabber 유틸리티: 오픈 포지션을 자동으로 관리하는 도구 단계별 영상 매뉴얼: 설치, 설정, 그리고 실제 거래 방법을 안내 맞춤형 세트 파일: 인디케이터를 빠르게 자동 설정하여 최고의 성과를 낼 수 있도록 도와줍니다 다른 전략은 이제 잊어버리세요! Grabber만이 여러분을 새로운 트레이딩의 정점으로 이끌어 줄 수 있습니다. Grabber 전략의 주요 특징: 거래 시간 프레임: M5부터 H4까지 거래 가능한 자산: 어떤 자산이든 사용 가능하지만, 제가 직접 테스트한 종목들을 추천드립니다 (GBPUSD, GBPCAD, GBPCHF, AUDCAD, AU
OmniSync Projection
Antonio-alin Teculescu
5 (1)
Chronos Fractal Engine is an innovative price projection indicator for MetaTrader 5, designed to transform your technical analysis by intelligently identifying and projecting historical price patterns. Built upon an advanced correlation algorithm and the fractal principles of the market, this powerful tool visualizes potential future price movements, giving you a unique edge in your trading decisions. What is Chronos Fractal Engine? At its core, the Chronos Fractal Engine employs a sophisticat
Crystal Heikin Ashi Signals
Muhammad Jawad Shabir
5 (2)
Crystal Heikin Ashi Signals - Professional Trend & Signal Detection Indicator Advanced Heikin Ashi Visualization with Intelligent Signal System for Manual & Automated Trading Final Price: $149 ---------> Price goes up $10 after every 10 sales . Limited slots available — act fast . Overview Crystal Heikin Ashi Signals is a professional-grade MetaTrader 5 indicator that combines pure Heikin Ashi candle visualization with an advanced momentum-shift detection system. Designed for both manual traders
Gann Made Easy MT5
Oleg Rodin
5 (2)
Gann Made Easy 는 mr.의 이론을 사용하여 최고의 거래 원칙을 기반으로 하는 전문적이고 사용하기 쉬운 Forex 거래 시스템입니다. W.D. 간. 이 표시기는 Stop Loss 및 Take Profit Levels를 포함하여 정확한 BUY 및 SELL 신호를 제공합니다. PUSH 알림을 사용하여 이동 중에도 거래할 수 있습니다. 구매 후 거래 방법 안내 및 유용한 추가 지표를 무료로 받으시려면 저에게 연락주세요! 아마도 Gann 거래 방법에 대해 이미 여러 번 들었을 것입니다. 일반적으로 Gann의 이론은 초보자 거래자뿐만 아니라 이미 거래 경험이 있는 사람들에게도 매우 복잡한 것입니다. Gann의 거래 방식은 이론적으로 적용하기 쉽지 않기 때문입니다. 나는 그 지식을 연마하고 Forex 지표에 최고의 원칙을 적용하기 위해 몇 년을 보냈습니다. 표시기는 적용하기가 매우 쉽습니다. 차트에 첨부하고 간단한 거래 권장 사항을 따르기만 하면 됩니다. 지표는 지속적으로 시장 분석
Smart Stop Indicator – 차트 위에서 직접 작동하는 지능형 스톱로스 시스템 개요 Smart Stop Indicator는 감이나 추측이 아닌 명확하고 체계적인 방식으로 스톱로스를 설정하고 싶은 트레이더를 위한 맞춤형 솔루션입니다. 이 도구는 클래식 프라이스 액션 논리(고점, 저점 구조)와 현대적인 브레이크아웃 인식을 결합하여 실제로 가장 논리적인 다음 스톱 레벨을 정확히 식별합니다. 추세, 박스권, 빠른 브레이크아웃 상황 등 어떤 시장에서도 인디케이터는 최적의 SL 구역과 상태(“new”, “broken”, “valid”)를 차트에 직접 표시합니다. 새로운 기능으로 SL 거리의 %ADR 표시가 추가되었습니다. 핵심 기능 자동 시장구조 기반 스톱 설정 • 시장 구조와 실시간 가격 움직임을 기반으로 의미 있는 스톱로스 레벨을 자동으로 탐지합니다. 스마트 브레이크아웃 감지 • 빠른 방향 변화나 돌파 상황에서도 불필요한 조기 스톱 조정을 강요하지 않으며 유연하게 반응합
Power Bar MT5
Daniel Stein
실제 자금을 투입하기 전에 어떤 전략이 내 심볼에서 효과적인지 확인하세요. Power Bar는 모든 심볼과 모든 타임프레임에서 극단적인 가격 바 를 감지한 다음, 3가지 다른 트레이딩 전략을 즉시 백테스트하여 승률, 수익 팩터, 손익을 나란히 비교할 수 있습니다. 모든 것이 하나의 인터랙티브 패널에 담겨 있습니다. 추측 없음. 커브 피팅 없음. 오직 데이터뿐입니다. Power Bar가 특별한 이유 대부분의 인디케이터는 신호를 주고 그것이 효과가 있는지는 추측에 맡깁니다. Power Bar는 한 걸음 더 나아갑니다 - 모든 신호를 세 가지 전략 에 대해 테스트하고 통계를 보여줍니다. FlipFlop, Momentum, Reversal을 원클릭으로 전환하고 숫자가 즉시 변하는 것을 확인하세요. FlipFlop - 항상 포지션 유지. 신호에 진입하고, 반대 신호에 청산. 당사의 연구에 따르면 US30, US500, DAX와 같은 추세가 있는 지수에서 가장 효과적입니다. Momentum
FX Power MT5 NG
Daniel Stein
5 (31)
FX Power: 통화 강세 분석으로 더 스마트한 거래 결정을 개요 FX Power 는 어떤 시장 상황에서도 주요 통화와 금의 실제 강세를 이해하기 위한 필수 도구입니다. 강한 통화를 매수하고 약한 통화를 매도함으로써 FX Power 는 거래 결정을 단순화하고 높은 확률의 기회를 발견합니다. 트렌드를 따르거나 극단적인 델타 값을 사용해 반전을 예측하고자 한다면, 이 도구는 귀하의 거래 스타일에 완벽히 적응합니다. 단순히 거래하지 말고, FX Power 로 더 스마트하게 거래하세요. 1. FX Power가 거래자에게 매우 유용한 이유 통화와 금의 실시간 강세 분석 • FX Power 는 주요 통화와 금의 상대적 강세를 계산하고 표시하여 시장 역학에 대한 명확한 통찰력을 제공합니다. • 어떤 자산이 앞서고 있고 어떤 자산이 뒤처지는지 모니터링하여 보다 현명한 거래 결정을 내릴 수 있습니다. 포괄적인 멀티 타임프레임 뷰 • 단기, 중기 및 장기 타임프레임에서 통화와 금의 강세를
ARICoins
Temirlan Kdyrkhan
ARICoin is a powerful trading companion designed to generate high-probability entry signals with dynamic TP/SL/DP levels based on volatility. Built-in performance tracking shows win/loss stats, PP1/PP2 hits, and success rates all updated live. Key Features: Buy/Sell signals with adaptive volatility bands Real-time TP/SL/DP levels based on ATR Built-in MA Filter with optional ATR/StdDev volatility Performance stats panel (Success, Profit/Loss, PP1/PP2) Alerts via popup, sound, push, or email Cust
우선적으로, 이 거래 도구는 전문적인 거래에 이상적인 비-다시 그리기 및 지연되지 않는 지표입니다.  온라인 강좌, 사용자 매뉴얼 및 데모. 스마트 가격 액션 컨셉트 인디케이터는 신규 및 경험 많은 트레이더 모두에게 매우 강력한 도구입니다. Inner Circle Trader Analysis 및 Smart Money Concepts Trading Strategies와 같은 고급 거래 아이디어를 결합하여 20가지 이상의 유용한 지표를 하나로 결합합니다. 이 인디케이터는 스마트 머니 컨셉트에 중점을 두어 대형 기관의 거래 방식을 제공하고 이동을 예측하는 데 도움을 줍니다.  특히 유동성 분석에 뛰어나 기관이 어떻게 거래하는지 이해하는 데 도움을 줍니다. 시장 트렌드를 예측하고 가격 변동을 신중하게 분석하는 데 탁월합니다. 귀하의 거래를 기관 전략에 맞추어 시장의 동향에 대해 더 정확한 예측을 할 수 있습니다. 이 인디케이터는 시장 구조를 분석하고 중요한 주문 블록을 식별하고 다양
Market Structure Order Block Dashboard MT5는 차트에서 직접 시장 구조와 주요 가격 반응 구간을 읽고자 하는 트레이더를 위해 설계된 MT5 인디케이터입니다. 이 도구는 BOS, ChoCH, Order Blocks, Fair Value Gaps (FVG), Liquidity, Kill Zones, Volume Profile, 그리고 빠른 분석을 위한 컴팩트한 dashboard를 결합합니다. 이 인디케이터는 시장 구조, ICT 개념, Smart Money 개념을 의사결정의 기준으로 사용하는 트레이더를 위한 도구입니다. 추세 지속, 가능한 반전, 가격 불균형, 유동성 목표, 그리고 주요 관심 구간을 보다 구조적으로 파악하는 데 도움을 줄 수 있습니다. Version 1.19에는 중요한 기능이 추가되었습니다. 바로 Pending BOS / Pending ChoCH 감지 입니다. 캔들이 이전 swing을 돌파한 상태로 마감하면, 인디케이터는 일반적인 swing
Atomic Analyst MT5
Issam Kassas
3.94 (31)
우선적으로 언급할 점은이 거래 지표가 다시 그리지 않고 지연되지 않으며 이를 통해 수동 및 로봇 거래 모두에 이상적이라는 점입니다. 사용자 매뉴얼: 설정, 입력 및 전략. Atomic Analyst는 가격의 강도와 모멘텀을 활용하여 시장에서 더 나은 이점을 찾는 PA Price Action Indicator입니다. 고급 필터를 장착하여 잡음과 거짓 신호를 제거하고 거래 잠재력을 높이는 데 도움이 됩니다. 복잡한 지표의 다중 레이어를 사용하여 Atomic Analyst는 차트를 스캔하고 복잡한 수학적 계산을 간단한 신호와 색상으로 변환하여 초보 트레이더가 이해하고 일관된 거래 결정을 내릴 수 있도록합니다. "Atomic Analyst"는 새로운 및 경험이 풍부한 트레이더를위한 종합적인 거래 솔루션입니다. 프리미엄 지표와 최고 수준의 기능을 하나의 거래 전략에 결합하여 모든 종류의 트레이더에 대한 다재다능한 선택지가되었습니다. 인트라데이 거래 및 스캘핑 전략 : 빠르고 정확한 일일
Btmm state engine pro
Garry James Goodchild
5 (4)
BTMM State Engine Pro is a MetaTrader 5 indicator for traders who use the Beat The Market Maker approach: Asian session context, kill zone timing, level progression, peak formation detection, and a multi-pair scanner from a single chart. It combines cycle state logic with a built-in scanner dashboard so you do not need the same tool on many charts at once. What it does Draws the Asian session range; session times can follow broker server offset or be set in inputs. Tracks level progression (L
RelicusRoad Pro MT5
Relicus LLC
5 (24)
RelicusRoad Pro: 퀀트 시장 운영 체제 70% 할인 평생 이용권 (한정 시간) - 2,000명 이상의 트레이더와 함께하세요 왜 대부분의 트레이더는 "완벽한" 지표를 가지고도 실패할까요? 진공 상태에서 단일 개념 만으로 거래하기 때문입니다. 문맥 없는 신호는 도박입니다. 지속적인 승리를 위해서는 컨플루언스(중첩) 가 필요합니다. RelicusRoad Pro는 단순한 화살표 지표가 아닙니다. 완전한 퀀트 시장 생태계 입니다. 독점적인 변동성 모델링을 사용하여 가격이 이동하는 "공정 가치 로드"를 매핑하고, 단순 노이즈와 실제 구조적 돌파를 구분합니다. 추측은 그만두세요. 기관급 로드 로직으로 거래를 시작하세요. 핵심 엔진: "Road" 알고리즘 시스템의 중심에는 시장 상황에 실시간으로 적응하는 동적 변동성 채널인 Road Algo 가 있습니다. 세이프 라인(평형) 과 가격이 수학적으로 반전될 가능성이 높은 확장 레벨 을 투영합니다. Simple Road: 일반적인 시장을 위
ARIPoint
Temirlan Kdyrkhan
ARIPoint is a powerful trading companion designed to generate high-probability entry signals with dynamic TP/SL/DP levels based on volatility. Built-in performance tracking shows win/loss stats, PP1/PP2 hits, and success rates all updated live. Key Features: Buy/Sell signals with adaptive volatility bands Real-time TP/SL/DP levels based on ATR Built-in MA Filter with optional ATR/StdDev volatility Performance stats panel (Success, Profit/Loss, PP1/PP2) Alerts via popup, sound, push, or email Cu
ICT PO3 (Power of 3) AMD Protocol Framework Indicator True Time & Structure Integration   |  Non-Repainting | Real-Time  | Multi-Asset  | MT4 Version Available Full Setup Guide & Strategy Playbook: https://www.mql5.com/en/blogs/post/768683 MT4 Version: https://www.mql5.com/en/market/product/171742 Indicator Overview The ICT PO3 AMD Protocol Framework is a complete structural overlay for MetaTrader 5 that maps the True Daily Cycle directly onto your lower-timeframe execution chart. It projects
HFT Spike Detector
OMG FZE LLC
5 (2)
[ My Products ] , [ My Channel ]   ,  [ LIVE SIGNAL ] HFT Spike Detector HFT Spike Detector는 HFT로 인해 발생하는 급격한 가격 변동을 실시간으로 분석하고 측정하기 위해 개발된 전문적인 틱 모니터링 도구입니다. 목적은 브로커로 인해 발생하는 비정상적인 슬리피지, 유동성 공백 및 밀리초 단위 가격 스파이크를 수치 데이터로 감지할 수 있도록 하는 것입니다. 실시간 틱 흐름과 체결 조건을 분석하기 때문에 백테스트로는 정확하게 평가할 수 없습니다. 이 EA는 자동화를 위해 준비된 세트 파일과 함께 사용할 수 있도록 구매할 수 있습니다:  VolumeHedger EA 작동 원리 이 Expert Advisor는 들어오는 모든 틱을 실시간으로 분석하고: 가격 변화 속도 초당 틱 밀도 슬리피지 크기 같은 방향의 마이크로 흐름 측정하여 차트의 패널에 표시합니다. 이를 통해 스프레드를 제외한 실제 실행 품질을 확인할 수
Trend indicator AI mt5
Ramil Minniakhmetov
5 (16)
트렌드 인공 지능 지표는 실행 가능한 진입 점 및 반전 경고와 추세 식별을 결합하여 상인의 시장 분석을 향상시킬 훌륭한 도구입니다. 이 표시기는 사용자가 자신감과 정밀도로 외환 시장의 복잡성을 탐색 할 수 있도록 지원합니다 기본 신호 외에도 트렌드 인공 지능 지표는 풀백 또는 되돌림 중에 발생하는 2 차 진입 점을 식별하여 거래자가 기존 트렌드 내에서 가격 수정을 활용할 수 있도록합니다. 중요한 장점: ·작동 4 및 5 *명확한 구매 또는 판매 신호 *다시 칠하지 않습니다 *모든 자산에서 작동 나는 전보 사기에 개 또는 세트를 판매하지 않도록주의. 모든 설정은 블로그에 여기에 무료.  중요! 지침 및 보너스를 얻기 위해 구입 후 즉시 저에게 연락! 진짜 가동 감시는 뿐 아니라 나의 다른 제품 여기에서 찾아낼 수 있습니다: https://www.mql5.com/en/users/mechanic/seller&nbsp ; 설정 및 입력: 모든 자산에 대해 기본 설정을 권
Market Structure Patterns
Samuel Manoel De Souza
4.47 (19)
Available for   MT4   and   MT5 . Join the Market Structure Patterns channel to download materials available for study and/or additional informations. Related posts: Market Structure Patterns - Introduction Beyond Fancy Order Blocks: Using True Volumetric Analysis with Market Structure Patterns & Timeless Charts Market Structure Patterns   is an indicator based on   smart money concepts   that displays   SMC/ICT   elements that can take your trading decisions to the next level. Take advantage
제작자의 제품 더 보기
Smart Sweep Detector
Juan Manuel Scandizzo
Liquidity Sweep Detector MT5 — FREE Automatically detects liquidity sweeps on swing highs and swing lows. When price breaks beyond a key level and closes back inside the range, the indicator marks it with a clear arrow on your chart — the exact moment smart money grabs liquidity and reverses. What it does: This indicator identifies swing highs and swing lows, draws them on your chart, and monitors when price sweeps beyond these levels. A sweep occurs when price breaks a swing point by a minimum
FREE
Session Mapper FRE
Juan Manuel Scandizzo
Session Mapper — Free Visual Session Indicator for MT5 Session Mapper draws colored rectangles on your chart showing the exact range of each major trading session: Asia, London, New York, and the London-NY Overlap. Each rectangle spans from the session high to the session low, with a label showing the session name and range in pips. Features: Automatic detection of Asia (00:00-07:00 GMT), London (07:00-16:00 GMT), New York (13:00-22:00 GMT) and London-NY Overlap sessions Adjustable broker GMT of
FREE
CandlePulsePRO
Juan Manuel Scandizzo
Know exactly when the candle closes and how much it has moved. CandlePulse PRO gives you real-time candle intelligence — countdown, range, ATR progress, spread, and direction — all in one compact panel. WHAT IT DOES CandlePulse PRO displays essential candle data that every trader needs but MetaTrader does not show by default: Candle Countdown — a floating timer next to the current price showing exactly how much time remains until the candle closes. Colors change dynamically: white when there is
FREE
Session Mapper PRO
Juan Manuel Scandizzo
Session Mapper PRO | ICT Kill Zones + Session Levels + Alerts - Advanced Trading Session Indicator for MT5 Session Mapper PRO gives you complete visual control over market sessions. See exactly where Asia, London, and New York sessions start and end, their price ranges, and key levels — all updated in real time. PRO Features: Kill Zones: highlights the London Open (07:00-09:00 GMT) and NY Open (13:00-15:00 GMT) — the highest volume windows where the biggest moves happen Session Levels: persiste
RiskManager PRO
Juan Manuel Scandizzo
Stop guessing your lot size. RiskManager PRO calculates the exact position size for every trade based on your risk tolerance, with draggable SL/TP lines that update everything in real time. WHAT IT DOES RiskManager PRO is a professional risk management panel that lives on your chart. Set your risk as a percentage of balance, equity, or a fixed dollar amount. Drag the Stop Loss line on the chart, and the panel instantly recalculates the optimal lot size, risk in dollars, reward in dollars, and R:
필터:
리뷰 없음
리뷰 답변