Core Index

Core Index is a precision momentum oscillator designed to highlight high-probability continuation zones in the market. It operates within a normalized range (0–100), delivering a clean and stable signal that avoids erratic spikes and misleading noise. The indicator is built to remain consistent after candle close, ensuring dependable analysis without recalculating past values.

At its core, the indicator tracks underlying market strength and weakness through a refined internal process, then smooths and standardizes the output for clarity. The result is a visually clean gold line that reacts intelligently to price shifts while filtering out insignificant fluctuations.

Please test thoroughly in strategy tester before purchase

How to Use

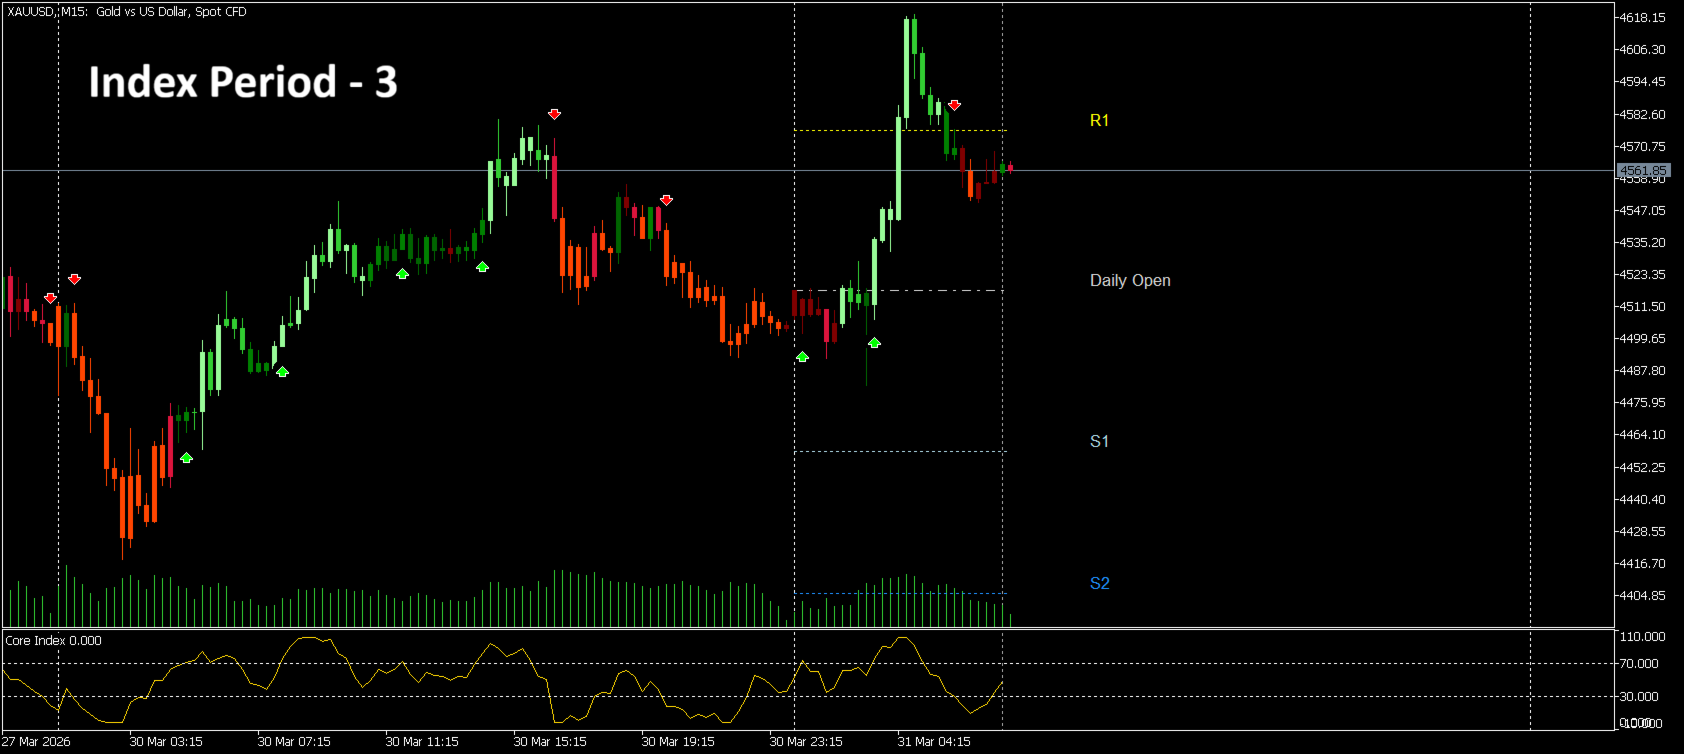
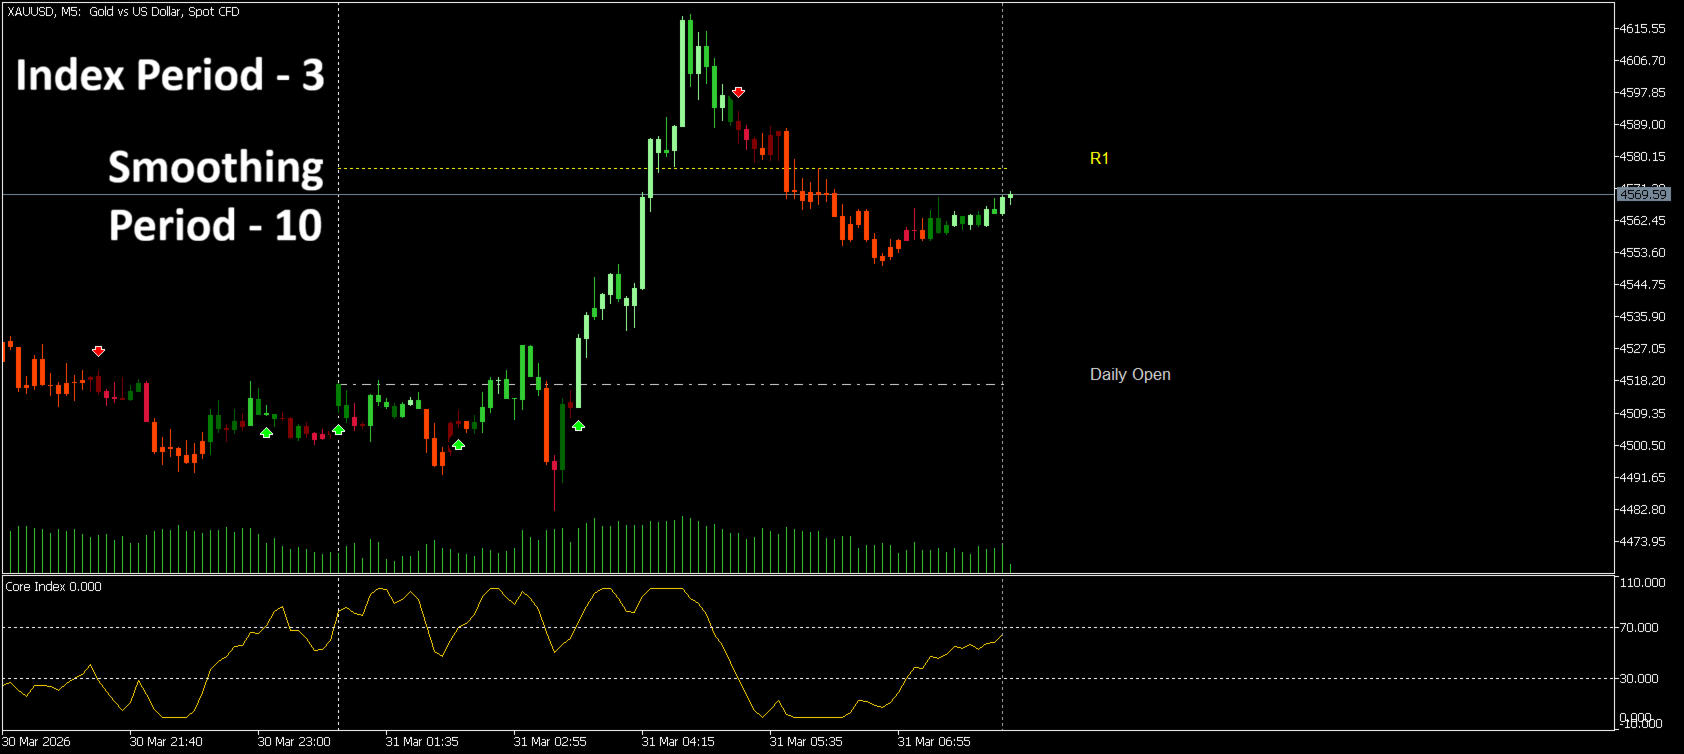
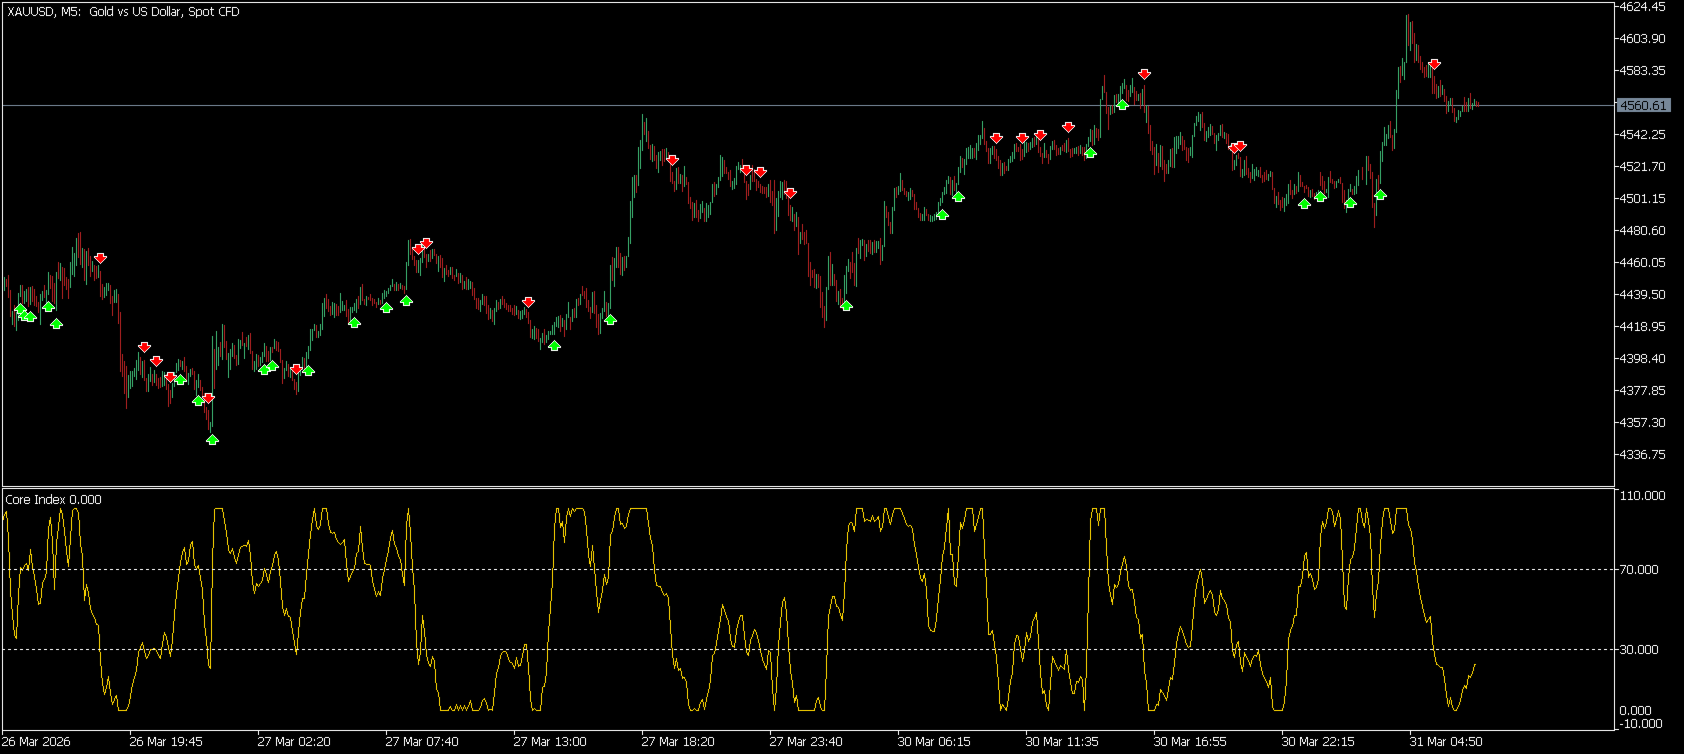
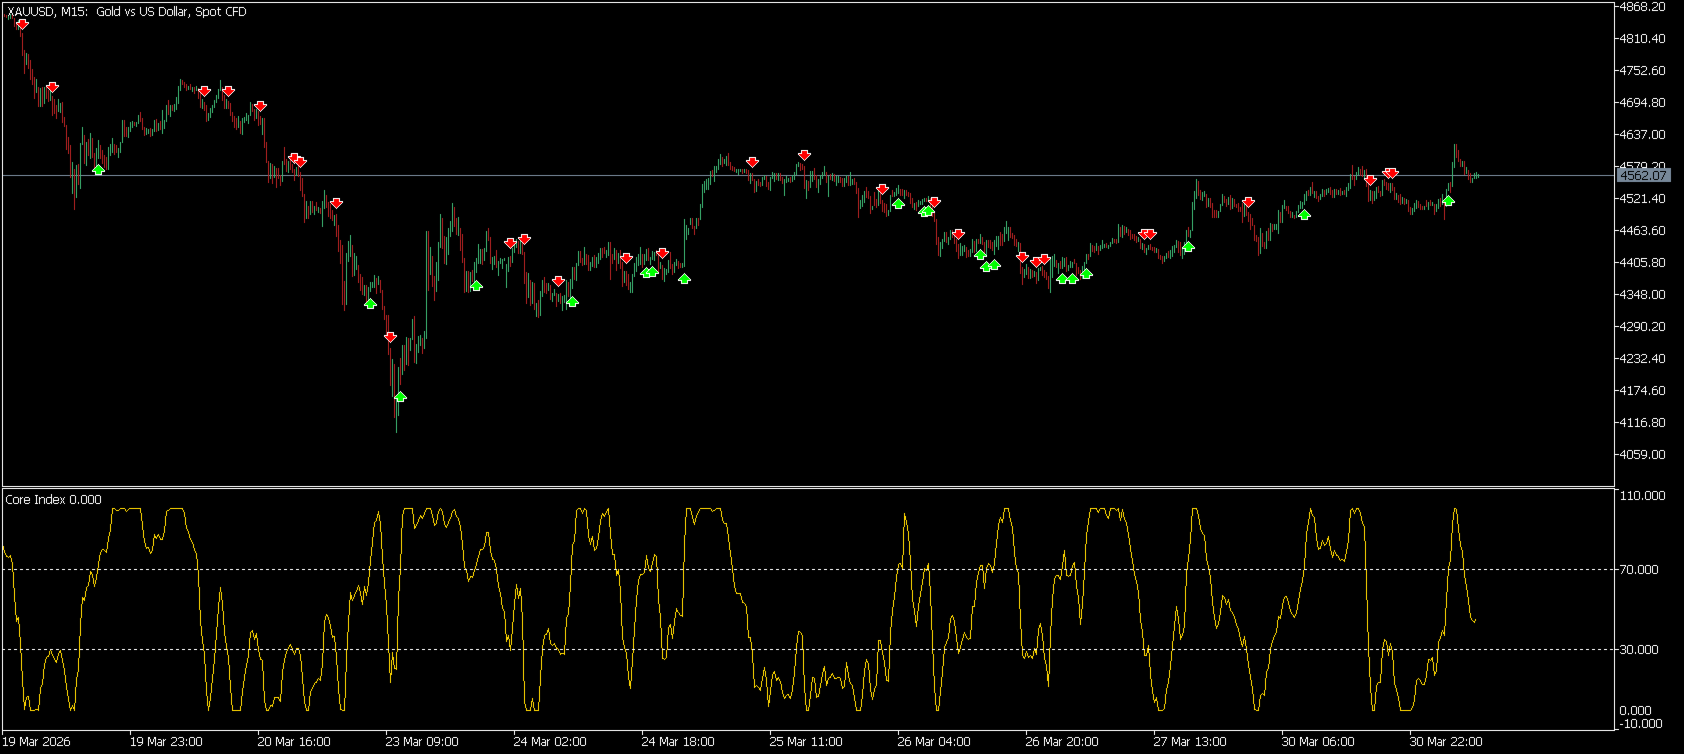
The Core Index revolves around two critical zones:

  • Above 70 → Strong bullish momentum
  • Below 30 → Strong bearish momentum

Trading signals are generated when the line crosses these key levels:

  • Buy Signal: When the Core Index crosses above 70
  • Sell Signal: When the Core Index crosses below 30

These signals are plotted directly on the main chart with arrows, allowing quick decision-making without needing to interpret the oscillator constantly.

For best results, use Core Index in trending or active market conditions. It can be applied across multiple timeframes, but performs best when aligned with overall market direction or combined with basic structure (support/resistance or trend bias).

Avoid treating it as a simple overbought/oversold tool—its strength lies in detecting momentum transitions, not static extremes.

Key Benefits

  • Stable, non-repainting behavior after candle close
  • Clear visual signals with minimal clutter
  • Adaptive to different market conditions
  • Built-in alerts for real-time opportunities

Core Index is ideal for traders who want a clean, responsive signal without overcomplicating their charts.


추천 제품
RBreaker
Zhong Long Wu
RBreaker Gold Indicators는 금 선물을 위한 단기 데이 트레이딩 전략으로, 추세 추종과 데이 내 반전의 두 가지 거래 방식을 결합합니다. 추세 장에서 수익을 포착할 수 있을 뿐만 아니라, 시장이 반전될 때 적시에 이익을 확정하고 추세에 맞춰 반대 포지션을 잡을 수 있습니다. 이 전략은 미국 잡지 Futures Truth에서 15년 연속으로 가장 수익성 높은 트레이딩 전략 상위 10위 안에 선정되었습니다. 긴 라이프사이클을 자랑하며, 현재까지 국내외에서 널리 사용되고 연구되고 있습니다. 본 지표는 2026년 금 선물의 움직임을 반영하여 14일 ATR 지표를 기반으로 돌파 계수 A, 관찰 계수 B, 반전 계수 R을 보다 합리적인 값으로 정의했습니다. 매우 훌륭한 지표이며, 안정적인 연간 수익성을 달성했습니다. 강력히 추천합니다~ 위 지표는 변동성이 높은 상품에 적합하며, 매개변수는 금 선물, 주가 지수 선물 등에 적합합니다. 다른 상품이 필요한 경우 돌파 계수 A
TrendDetect
Pavel Gotkevitch
The Trend Detect indicator combines the features of both trend indicators and oscillators. This indicator is a convenient tool for detecting short-term market cycles and identifying overbought and oversold levels. A long position can be opened when the indicator starts leaving the oversold area and breaks the zero level from below. A short position can be opened when the indicator starts leaving the overbought area and breaks the zero level from above. An opposite signal of the indicator can b
PZ Mean Reversion MT5
PZ TRADING SLU
3 (2)
평균 회귀 거래에 대한 전문적이고 정량적인 접근 방식을 구현하는 고유한 지표입니다. 이는 가격이 예측 가능하고 측정 가능한 방식으로 평균으로 전환되고 반환된다는 사실을 이용하여 비정량적 거래 전략을 훨씬 능가하는 명확한 진입 및 퇴장 규칙을 허용합니다. [ Installation Guide | Update Guide | Troubleshooting | FAQ | All Products ] 명확한 거래 신호 놀랍도록 쉬운 거래 사용자 정의 가능한 색상 및 크기 성능 통계 구현 대부분의 거래 전략을 능가합니다. 적절한 SL 및 TP 레벨을 표시합니다. 이메일/음향/시각 알림을 구현합니다. 작동 원리 이 지표는 더 높은 기간에서 완전히 사용자 정의 가능한 이동 평균 주변의 표준 편차를 측정하고 추세 추종 접근 방식을 사용하여 정확하게 거래를 찾습니다. 거래는 현재 차트의 가격 동작을 살펴보고 선택한 더 높은 기간에서 계산된 평균 가격대로 가격이 돌아오면 닫힙니다. 코딩 방식 때문에 지
Maximum Trend Arrows OT MT5
Mulweli Valdaz Makulana
STRICTLY FOR BOOM INDEX ONLY!!!!! Here I bring the Maximum Trend Arrows OT1.0 MT5 indicator. This indicator is made up of a combination of different trend indicators for entries and exits, for entries an orange arrow will paint on the chart below the current market and a red flag for closing of trades and it produces buy arrows only. When the orange arrow appears, it will appear along with it's sound to notify you. The 1H timeframe is recommended, don't use it anywhere else than on the 1H timefr
Divergent Stochastic Filter II Catch Reversals Early, Filter Noise, Trade with Confidence The Edge: Why This Stochastic is Different  Every trader knows the Stochastic oscillator. But knowing when to trust its signals, that's the real challenge. The Divergent Stochastic Filter II transforms this classic indicator into a precision reversal detection system by adding critical elements: divergence intelligence, signal filtering and exhaustion detection.  While standard Stochastic oscillators fire s
Visual Range Directional Force Indicator
AL MOOSAWI ABDULLAH JAFFER BAQER
Range Directional Force Indicator – Designed for You to Optimize! The Range Directional Force Indicator is a cutting-edge tool designed to empower traders by visualizing market dynamics and directional strength. Built to offer insights into market trends and reversals, this indicator is an invaluable asset for traders seeking precision in their strategies. However, it is important to note that this indicator is not optimized, leaving room for you to tailor it to your unique trading preferences.
Protocol
Vincent Georges David Ferrier
PROTOCOL - Institutional Liquidity Grab & SMC Elite Liquidity Grab & Advanced SMC Execution ( MT4 Available here ) Dynamic Trend Sniper MT5 (available here) LIMITED RELEASE & PRICING NOTICE Launch Special: Available for $299 USD for the first 7 days only . After this period, the price will strictly increase to $399 USD. Prop Firm Protection Protocol: Major Prop Firms enforce strict copy-trading and trade-crowding policies. To protect the statistical edge of this algorithm and ensure our
This trading indicator is non-repainting, non-redrawing, and non-lagging, making it an ideal choice for both manual and automated trading. It is a Price Action–based system that leverages price strength and momentum to give traders a real edge in the market. With advanced filtering techniques to eliminate noise and false signals, it enhances trading accuracy and potential. By combining multiple layers of sophisticated algorithms, the indicator scans the chart in real-time and translates comple
MT5용 Crypto_Forex 지표 "HTF 이동평균 교차" - MT5용 강력한 HTF 이동평균 교차 지표로 거래 방식을 업그레이드하세요. HTF는 더 높은 시간대를 의미합니다. - 이 지표는 가격 변동이 있는 추세 트레이더에게 매우 유용합니다. - 더 높은 시간대의 빠르고 느린 이동평균을 현재 차트에 추가할 수 있습니다. 이는 전문적인 방법입니다. - HTF 이동평균 교차는 모바일 및 PC 알림 기능을 내장하고 있습니다. - 이 지표는 낮은 위험으로 상당한 수익을 얻을 수 있는 기회를 제공합니다. .......................................................................... 여기를 클릭하여 고품질 트레이딩 로봇과 지표를 확인하세요! 이 제품은 MQL5 웹사이트에서만 제공되는 오리지널 제품입니다.
Identify precise entry and exit points with AB=CD patterns This indicator finds AB=CD retracement patterns. The AB=CD Retracement pattern is a 4-point price structure where the initial price segment is partially retraced and followed by an equidistant move from the completion of the pullback, and is the basic foundation for all harmonic patterns. [ Installation Guide | Update Guide | Troubleshooting | FAQ | All Products ] Customizable pattern sizes Customizable AC and BD ratios Customizable b
Price Magnet — Price Density and Attraction Levels Indicator Price Magnet is a professional analytical tool designed to identify key support and resistance levels based on statistical Price Density. The indicator analyzes a specified historical period and detects price levels where the market spent the most time. These zones act as “magnets,” attracting price action or forming a structural base for potential reversals. Unlike traditional Volume Profile tools, Price Magnet focuses on price-time d
Limitless MT5
Dmitriy Kashevich
Limitless MT5 is a universal indicator suitable for every beginner and experienced trader. works on all currency pairs, cryptocurrencies, raw stocks Limitless MT5 - already configured and does not require additional configuration And now the main thing Why Limitless MT5? 1 complete lack of redrawing 2 two years of testing by the best specialists in trading 3 the accuracy of correct signals exceeds 80% 4 performed well in trading during news releases Trading rules 1 buy signal - the ap
DYJ TradingView
Daying Cao
5 (1)
DYJ TRADINGVIEW는 등급 신호 카운트 및 분석 도구를 사용하여 글로벌 시장에서 진입 기회를 찾는 다중 지표 등급 시스템입니다. DYJ TRADINGVIEW에는 시장 분석을 위한 10가지 내장 지표가 있습니다. 지표 기반 분석은 많은 거래자가 수행할 거래와 거래를 시작하고 종료할 위치에 대한 결정을 내리는 데 사용합니다. 우리는 서로를 잘 보완할 수 있는 몇 가지 다른 유형을 사용합니다. 귀하의 시장을 추적하기 위해 저희를 사용하십시오. 더 정확한 거래를 찾을 수 있습니다. 등급에 참여하는 추세 지표에는 DYJ POWERSIGNAL, ADX, SMA, 볼린저 밴드가 있습니다. 등급에 참여하는 오실레이터에는 MACD, RSI, Stochastic, Alligator가 있습니다. 시그널의 개수가 3개 이상일 때 시그널을 매수 또는 매도하는 동일한 방향을 나타내는 3개의 지표가 있을 때 시장 거래에 진입하기 시작합니다. 입력 [일반] ViewName = "DYJ
Go Way TREND
Ywsf Hsyn Hmad Alrsh
추세와 함께 가십시오. 네, 15분 프레임에 매수든 매도든 진입 신호를 기다리고, 30분 프레임에 신호가 나타나는지 확인하세요(때때로 신호가 나타나는 데 1시간 이상이 소요됩니다. 돌아올 수 있습니다) 15분 프레임으로 갔다가 30분 프레임으로 돌아가서 메인 시그널이 나타날 때까지 이를 반복합니다. 30분 프레임에 시그널이 나타나면 가격을 가지고 진입하여 선이 바뀔 때 수익을 얻습니다. , 이익이 기록되거나 반대 신호가 나타나는 경우 매우 간단하며 모든 주요 통화에서 작동합니다.  금속, 표시기, 모든 프레임이지만 가장 좋은 결과는 30분 프레임입니다. 항상 캔들 바닥 아래에 스톱로스를 설정하고 자본 관리를 초과해서는 안 됩니다. 자본금의 10% 추세와 함께 가십시오. 네, 15분 프레임에 매수든 매도든 진입 신호를 기다리고, 30분 프레임에 신호가 나타나는지 확인하세요(때때로 신호가 나타나는 데 1시간 이상이 소요됩니다. 돌아올 수 있습니다) 15분 프레임으로 갔다가 30분 프
Universal Soul Reaper
Pieter Gerhardus Van Zyl
Universal Soul Reaper is an atmospheric market-flow oscillator designed to interpret price behavior as a cycle of spiritual energy. Instead of reacting to raw price alone, it visualizes the state of the market’s soul —revealing when momentum is awakening, stabilizing, or fading. The indicator operates in a separate window and presents three interwoven entities: the Ectoplasmic Veil , the Spirit Boundary , and the Soul Core . Together, they form a living framework that helps traders sense pressu
The new update makes this indicator a complete tool for studying, analyzing and operating probabilistic patterns. It includes: On-chart Multi-asset percentage monitor. Configurable martingales. Twenty-one pre-configured patterns, including Mhi patterns and C3. An advanced pattern editor to store up to 5 custom patterns. Backtest mode to test results with loss reports. Trend filter. Hit operational filter. Martingale Cycles option. Various types of strategies and alerts. Confluence between patter
Universal Trend
Maryna Shulzhenko
The Universal Trend indicator was created to detect trends in price movement and allows you to quickly determine not only the direction of the trend, but also understand the levels of interaction between buyers and sellers. The indicator works on all timeframes and currency pairs. The indicator gives fairly accurate signals and it is customary to use it both in trending and flat markets. It is advisable to use the indicator in combination with other tools for more reliable signals and making a
Introduction to the Manual Backtesting Indicator on MQL5 The MetaTrader platform provides an excellent backtesting tool for evaluating Expert Advisors (EAs). However, when it comes to manually backtesting a strategy to assess its effectiveness, this tool has some limitations: You cannot manually draw zones or trend lines while in backtesting mode. You cannot switch timeframes to check time alignment. For example, if my strategy requires additional confirmation from a higher timeframe (HTF), this
ATrend
Zaha Feiz
4.82 (17)
ATREND: 작동 방식 및 사용 방법 ### 작동 방식 MT5 플랫폼을 위한 "ATREND" 지표는 기술 분석 방법론의 조합을 활용하여 트레이더에게 강력한 매수 및 매도 신호를 제공하도록 설계되었습니다. 이 지표는 주로 변동성 측정을 위해 평균 진폭 범위(ATR)를 활용하며, 잠재적인 시장 움직임을 식별하기 위한 트렌드 탐지 알고리즘과 함께 사용됩니다. 구매 후 메시지를 남기면 특별 보너스 선물을 받게 됩니다. ### 주요 특징: - 동적 트렌드 탐지: 이 지표는 시장 트렌드를 평가하고 신호를 조정하여 트레이더가 현재 시장 상황에 맞춰 전략을 조정할 수 있도록 돕습니다. - 변동성 측정: ATR을 사용하여 시장의 변동성을 측정하며, 이는 최적의 손절매(SL) 및 이익 실현(TP) 수준을 결정하는 데 중요합니다. - 신호 시각화: 이 지표는 차트에 매수 및 매도 신호를 시각적으로 표시하여 트레이더의 의사 결정을 향상시킵니다. ### 운영 단계 #### 입력 및 설정 - TimeFr
Antique Trend
Nadiya Mirosh
The Antique Trend Indicator is a revolutionary trend trading and filtering solution with all the important features of a trend tool built into one tool! The Antique Trend indicator is good for any trader, suitable for any trader both for Forex and binary options. There is no need to configure anything, everything has been perfected by time and experience, it works great during flats and trends. The Antique Trend indicator is a tool for technical analysis of financial markets, reflecting curren
Adjustable Consecutive Fractals  looks for 2 or more fractals in one direction and sends out a on screen alert, sound alert and push notification, for strong reversal points . Adjustable Consecutive Fractals, shows the fractals on chart along with a color changing text for buy and sell signals when one or more fractals appear on one side of price. Adjustable Consecutive Fractals is based Bill Williams Fractals . The standard Bill Williams fractals are set at a non adjustable 5 bars, BUT withe th
Magic EA MT5
Kyra Nickaline Watson-gordon
Magic EA is an Expert Advisor based on Scalping, Elliot Waves and with filters such as RSI, Stochastic and 3 other strategies managed and decided with the robot smartly. Large number of inputs and settings are tested and optimized and embedded in the program thus inputs are limited and very simple. Using EA doesn't need any professional information or Forex Trading Knowledge. EA can trade on all symbols and all time frames, using special and unique strategies developed by the author. The EA w
평면 및 추세를 결정하기 위한 표시기. 가격이 2개의 히스토그램과 2개의 선(빨간색 및 파란색) 중 하나보다 낮으면 판매 영역입니다. 이 버전의 표시기를 구매할 때 하나의 실제 계정과 하나의 데모 계정에 대한 MT4 버전 - 선물로(수신하려면 개인 메시지를 작성하세요)! 가격이 2개의 히스토그램과 2개의 선(빨간색 및 파란색) 중 하나보다 높으면 구매 영역입니다. MT4 버전: https://www.mql5.com/en/market/product/3793 가격이 두 라인 사이 또는 히스토그램 영역에 있으면 시장에 명확한 추세가 없습니다. 간단히 말해서 시장은 평평합니다. 표시기의 작업은 스크린샷에 더 명확하게 표시됩니다. 지표는 선행 데이터를 얻는 데 사용할 수 있습니다. 또는 현재 추세의 상태를 확인합니다.
Gekko RSI Plus
Rodrigo Galeote
This is Gekko's Cutomized Relative Strength Index (RSI), a customized version of the famous RSI indicator. Use the regular RSI and take advantage two entry signals calculations and different ways of being alerted whenever there is potential entry or exit point. Inputs Period: Period for the RSI calculation; How will the indicator calculate entry (swing) signals: 1- Produces Exit Signals for Swings based on RSI entering and leaving Upper and Lower Levels Zones; 2- Produces Entry/Exit Signals for
Turn your chart into a professional trading dashboard that shows where price is flowing and when the next shock is coming —without loading a single extra window. This indicator combines a price-following MA ribbon with a live news radar directly on the chart, giving you both trend and event risk in one glance. Trend Ribbon – Read the market bias instantly A smooth, step-style moving average ribbon follows price action bar by bar. Color change shows the active trend: aqua for bullish flow , gold
Ultimate Boom and Crash Indicator The Ultimate Boom and Crash Indicator is a cutting-edge tool developed by  Coetsee Digital , designed to identify potential spike opportunities in the market. Crafted for traders focusing on Deriv and Weltrade synthetic markets, this indicator is optimized to operate exclusively on the 3-minute (M3), 5-minute (M5), 15-minute (M15), 30-minute (M30), and 1-hour (H1) timeframes and supports only the following pairs: PainX 1200, PainX 999, PainX 800, PainX 600, Pai
The ZigZag Buy Level is a specialized tool for traders who utilize market structure and classic ZigZag patterns to define key support and entry points. It automatically identifies "Main Highs"—significant highs confirmed by the subsequent price action—and then calculates a high-probability "Buy Level" based on a specified percentage pullback from that Main High to the last corrective low. This indicator helps you anticipate deep retracement entries, clearly marking them on the chart with labels
대칭 삼각형, 비대칭 삼각형 또는 직각 삼각형과 같은 삼각형 패턴, 상승 쐐기 또는 하강 쐐기와 같은 쐐기 패턴, 확장 패턴 및 추세 채널에 대한 패턴 탐색기 이 지표는 과거의 패턴과 현재의 패턴을 탐색하며, 수동으로 추세선이나 삼각형을 그려 시간을 절약하고 차트에 가장 좋은 패턴을 그리는 자동 분석에 사용하려는 사람들에게 가장 적합한 지표입니다. 특징 : - 최적의 패턴을 조정하고 찾기 위해 즉시 ZigZag 확장 깊이를 변경하는 패널 - 패턴을 지그재그의 이전 막대로 다시 이동하여 과거에 발생한 일을 탐색하고 추세선이 존중되는지 여부를 탐색하고 가격 동작을 이해할 수 있습니다. 이 지표를 사용하여 이전의 과거 패턴을 탐색하고 분석하고 학습하여 마스터 전략을 도출합니다. - 전환 버튼에서 추세 채널 또는 추세선에서 쐐기 또는 삼각형 모드로 즉시 전환 - 패턴이 변경되지 않도록 일시 중지하고 경고에 대한 가격 터치를 계속 확인합니다. - 레벨 터치에 대한 다양한 유형
KT Liquidity Sweep Filter MT5
KEENBASE SOFTWARE SOLUTIONS
KT Liquidity Sweep Filter는 핵심 유동성 스윕 영역을 식별하고 시각적으로 강조해주는 기술적 지표입니다. 이 지표는 명확한 가격 반응과 적응형 추세 필터를 결합하여, 시장 추세와 일치하는 정밀한 매수 및 매도 신호를 생성합니다. 주요 유동성 스윕 영역과 보조 영역을 구분하여, 주요 영역은 큰 화살표로, 보조 영역은 작은 화살표로 표시하여 빠르게 식별할 수 있도록 설계되었습니다. 큰 화살표: 주요 유동성 스윕 영역에서 발생하는 강한 추세 반전 신호를 나타냅니다. 작은 화살표: 보조 유동성 스윕 영역에서 발생하는 비교적 약한 반전 신호를 나타냅니다. 기능 소개 추세 친화적 신호: 특히 금(Gold)처럼 추세가 강한 종목에서 효과적이며, 여러 진입 기회를 제공합니다. 더 많은 트레이딩 기회: 강한 반전과 약한 반전을 모두 식별하여 추가 진입 포인트를 제공합니다. 사용자 설정 가능한 추세 필터: 자신의 종목 및 시간대에 맞게 신호를 정밀 조정할 수 있습니다. 조절 가능한
Fib Auto Trendline
Nhlanhla Brilliant Mashavha
INTRODUCTION The  Fib Autotrendline   is a basic tool that analysts use to find out when a security's trend is reversing. By determining the   support and resistance areas , it helps to identify significant changes in price while filtering out short-term fluctuations, thus eliminating the noise of everyday market conditions. It is an excellent tool for any trader who follows indicators that use   swing highs  and   swing lows . How to Use the fib Auto Trendline Indicator The Fib Auto Trendline
이 제품의 구매자들이 또한 구매함
SuperScalp Pro
Van Minh Nguyen
5 (14)
SuperScalp Pro – 고급 다중 필터 스캘핑 인디케이터 시스템 SuperScalp Pro는 클래식 Supertrend와 여러 지능형 확인 필터를 결합한 고급 스캘핑 인디케이터 시스템입니다. 해당 인디케이터는 M1부터 H4까지 모든 타임프레임에서 효율적으로 작동하며, 특히 XAUUSD, BTCUSD 및 주요 외환 통화쌍에 적합합니다. 독립형 시스템으로 사용하거나 기존 거래 전략에 유연하게 통합할 수 있습니다. 이 인디케이터는 11개 이상의 필터를 통합하며, 빠른/느린 EMA, 추세 판별용 3개의 EMA, EMA 기울기(EMA slope), RSI, ADX, 거래량(Volume), VWAP, 볼린저 밴드 돌파(Bollinger Bands Breakout) 및 MACD 다이버전스 필터 등을 포함합니다. 스마트 캔들 필터는 캔들 종가를 확인하여 약한 신호를 제거하고, 3 EMA와 MACD 다이버전스 필터를 결합한 추세 인식 메커니즘은 더 높은 승률의 신호를 선별하는 데 도움을 줍니
Azimuth Pro
Ottaviano De Cicco
5 (6)
LAUNCH PROMO Azimuth Pro price is initially set at 299$ for the first 100 buyers. Final price will be 499$ . THE DIFFERENCE BETWEEN RETAIL AND INSTITUTIONAL ENTRIES ISN'T THE INDICATOR — IT'S THE LOCATION. Most traders enter at arbitrary price levels, chasing momentum or reacting to lagging signals. Institutions wait for price to reach structured levels where supply and demand actually shift. Azimuth Pro maps these levels automatically: swing-anchored VWAP, multi-timeframe structure lines, an
Divergence Bomber
Ihor Otkydach
4.9 (86)
이 지표를 구매하신 분께는 다음과 같은 혜택이 무료로 제공됩니다: 각 거래를 자동으로 관리하고, 손절/익절 수준을 설정하며, 전략 규칙에 따라 거래를 종료하는 전용 도우미 툴 "Bomber Utility" 다양한 자산에 맞게 지표를 설정할 수 있는 셋업 파일(Set Files) "최소 위험", "균형 잡힌 위험", "관망 전략" 모드로 설정 가능한 Bomber Utility의 셋업 파일 이 전략을 빠르게 설치, 설정, 시작할 수 있도록 돕는 단계별 영상 매뉴얼 주의: 위의 모든 보너스를 받기 위해서는 MQL5 개인 메시지 시스템을 통해 판매자에게 연락해 주세요. 독창적인 커스텀 지표인 “Divergence Bomber(다이버전스 봄버)”를 소개합니다. 이 지표는 MACD 다이버전스(괴리) 전략을 기반으로 한 올인원(All-in-One) 거래 시스템입니다. 이 기술 지표의 주요 목적은 가격과 MACD 지표 간의 다이버전스를 감지하고, **향후 가격이 어느 방향으로 움직일지를 알려주는
Entry In The Zone and SMC Multi Timeframe is a real-time market analysis tool developed based on Smart Money Concepts (SMC). It is designed to analyze market structure, price direction, reversal points, and key zones across multiple timeframes in a systematic way. The system displays Points of Interest (POI) and real-time No Repaint signals, with instant alerts when price reaches key zones or when signals occur within those zones. It functions as both an Indicator and a Signal System (2-in-1), c
CGE Trading Suite
Carl Gustav Johan Ekstrom
5 (1)
CGE Trading Suite delivers the analytical edge typically reserved for professional trading desks. The platform integrates a full suite of analytical tools into one seamless workflow: dynamic grid mapping, liquidity behavior analysis, ECM, trend lines, MIDAS, trade cycles, and directional channel projections. Together, these provide a unified view of market structure and momentum. Directional clarity is further enhanced by the capital flow index, which measures currency basket strength to identif
이 지표를 구매하면 제 프로페셔널 트레이드 매니저를 무료로 드립니다. 우선 이 거래 시스템이 리페인팅, 리드로잉 및 레이그 인디케이터가 아니라는 점을 강조하는 것이 중요합니다. 이는 수동 및 로봇 거래 모두에 이상적인 것으로 만듭니다. 온라인 강좌, 설명서 및 프리셋 다운로드. "스마트 트렌드 트레이딩 시스템 MT5"은 새로운 및 경험이 풍부한 트레이더를 위해 맞춤형으로 제작된 종합적인 거래 솔루션입니다. 10개 이상의 프리미엄 인디케이터를 결합하고 7개 이상의 견고한 거래 전략을 특징으로 하여 다양한 시장 조건에 대한 다목적 선택이 가능합니다. 트렌드 추종 전략: 효과적인 트렌드 추이를 타기 위한 정확한 진입 및 손절 관리를 제공합니다. 반전 전략: 잠재적인 트렌드 반전을 식별하여 트레이더가 범위 시장을 활용할 수 있게 합니다. 스캘핑 전략: 빠르고 정확한 데이 트레이딩 및 단기 거래를 위해 설계되었습니다. 안정성: 모든 인디케이터가 리페인팅, 리드로잉 및 레이그가 아니므로 신뢰
Power Bar MT5
Daniel Stein
실제 자금을 투입하기 전에 어떤 전략이 내 심볼에서 효과적인지 확인하세요. Power Bar는 모든 심볼과 모든 타임프레임에서 극단적인 가격 바 를 감지한 다음, 3가지 다른 트레이딩 전략을 즉시 백테스트하여 승률, 수익 팩터, 손익을 나란히 비교할 수 있습니다. 모든 것이 하나의 인터랙티브 패널에 담겨 있습니다. 추측 없음. 커브 피팅 없음. 오직 데이터뿐입니다. Power Bar가 특별한 이유 대부분의 인디케이터는 신호를 주고 그것이 효과가 있는지는 추측에 맡깁니다. Power Bar는 한 걸음 더 나아갑니다 - 모든 신호를 세 가지 전략 에 대해 테스트하고 통계를 보여줍니다. FlipFlop, Momentum, Reversal을 원클릭으로 전환하고 숫자가 즉시 변하는 것을 확인하세요. FlipFlop - 항상 포지션 유지. 신호에 진입하고, 반대 신호에 청산. 당사의 연구에 따르면 US30, US500, DAX와 같은 추세가 있는 지수에서 가장 효과적입니다. Momentum
FX Trend MT5 NG
Daniel Stein
5 (4)
FX Trend NG: 차세대 멀티 마켓 트렌드 인텔리전스 개요 FX Trend NG 는 다중 시간 프레임 기반의 전문 트렌드 분석 및 시장 모니터링 도구입니다. 몇 초 만에 전체 시장 구조를 파악할 수 있도록 설계되었습니다. 여러 차트를 일일이 전환할 필요 없이, 어떤 종목이 추세에 있는지, 어디에서 모멘텀이 약화되고 있는지, 그리고 어떤 시간 프레임이 서로 정렬되어 있는지 즉시 확인할 수 있습니다. 출시 기념 특별 혜택 – FX Trend NG 를 $30 (6개월) 또는 $80 평생 라이선스 로 이용할 수 있습니다. 이미 Stein Investments 고객이신가요? -> 메시지를 보내 전용 고객 그룹에 참여하세요. 설정이나 사용 방법이 필요하신가요? -> Stein Investments 공식 페이지 를 방문하세요. 1. FX Trend NG가 특별한 이유 3단계 추세 로직 – 단순한 Buy / Sell이 아닙니다 • 대부분의 지표는 Buy 또는 Sell 두 가지 상태만 제
Trend Screener Pro MT5
STE S.S.COMPANY
4.84 (103)
트렌드 표시기, 트렌드 트레이딩 및 필터링을 위한 획기적인 고유 솔루션, 하나의 도구 안에 내장된 모든 중요한 트렌드 기능! Forex, 상품, 암호 화폐, 지수 및 주식과 같은 모든 기호/도구에 사용할 수 있는 100% 다시 칠하지 않는 다중 시간 프레임 및 다중 통화 표시기입니다. Trend Screener는 차트에 점이 있는 화살표 추세 신호를 제공하는 효율적인 지표 추세 추종 지표입니다. 추세 분석기 표시기에서 사용할 수 있는 기능: 1. 트렌드 스캐너. 2. 최대 이익 분석이 있는 추세선. 3. 추세 통화 강도 측정기. 4. 경고가 있는 추세 반전 점. 5. 경고가 있는 강력한 추세 점. 6. 추세 화살표 Trend Screener Indicator가 있는 일일 분석 예, 일일 신호 성능...등은 여기에서 찾을 수 있습니다. 여기를 클릭하십시오. LIMITED TIME OFFER : Trend Screener Indicator는 50$ 및 평생 동안만 사용할 수 있습니다.
RelicusRoad Pro MT5
Relicus LLC
5 (24)
RelicusRoad Pro: 퀀트 시장 운영 체제 70% 할인 평생 이용권 (한정 시간) - 2,000명 이상의 트레이더와 함께하세요 왜 대부분의 트레이더는 "완벽한" 지표를 가지고도 실패할까요? 진공 상태에서 단일 개념 만으로 거래하기 때문입니다. 문맥 없는 신호는 도박입니다. 지속적인 승리를 위해서는 컨플루언스(중첩) 가 필요합니다. RelicusRoad Pro는 단순한 화살표 지표가 아닙니다. 완전한 퀀트 시장 생태계 입니다. 독점적인 변동성 모델링을 사용하여 가격이 이동하는 "공정 가치 로드"를 매핑하고, 단순 노이즈와 실제 구조적 돌파를 구분합니다. 추측은 그만두세요. 기관급 로드 로직으로 거래를 시작하세요. 핵심 엔진: "Road" 알고리즘 시스템의 중심에는 시장 상황에 실시간으로 적응하는 동적 변동성 채널인 Road Algo 가 있습니다. 세이프 라인(평형) 과 가격이 수학적으로 반전될 가능성이 높은 확장 레벨 을 투영합니다. Simple Road: 일반적인 시장을 위
Power Candles MT5
Daniel Stein
5 (7)
Power Candles – 모든 시장을 위한 강도 기반 진입 신호 Power Candles 는 Stein Investments의 검증된 강도 분석을 가격 차트에 직접 제공합니다. 가격 움직임에만 반응하는 대신, 각 캔들은 실제 시장 강도를 기준으로 색상화되어 모멘텀 형성, 강도 가속, 명확한 추세 전환을 즉시 파악할 수 있습니다. 모든 시장을 위한 단일 로직 Power Candles는 모든 거래 심볼 에서 자동으로 작동합니다. 현재 심볼이 Forex인지 비-Forex 시장인지 자동으로 감지하여 내부적으로 적절한 강도 모델을 적용합니다. Forex 및 Gold 는 FX Power Delta 값을 사용합니다 (절대값 범위 최대 100) 지수, 크립토 및 CFD 는 IX Power Strength 값을 사용합니다 (절대값 범위 최대 50) 필요한 강도 계산은 Power Candles에 완전히 내장되어 있습니다. 캔들 색상이나 신호 로직을 위해 추가 인디케이터는 필요하지 않습니다. 가격
Currency Strength Dashboard Pro
Anastasia Danilova
5 (1)
Currency Strength Dashboard Pro MetaTrader 5 를 위한 실시간 통화 강도 분석 전문 대시보드 입니다. 이 지표는 8개의 주요 통화 (EUR, USD, GBP, JPY, CHF, AUD, CAD, NZD)의 강도를 계산하고, 28개의 통화쌍 을 동시에 여러 시간 프레임에서 분석하여 표시합니다. 이 대시보드는 트레이더가 추가 계산이나 여러 차트 간 전환 없이 한눈에 시장 전체 상황을 파악 할 수 있도록 해줍니다. 계산 방법 이 지표는 고급 수학적 통화 강도 분석 방법 을 기반으로 합니다. 이는 유사한 지표에서 널리 사용되는 RSI 기반 방법 보다 더 정확하고 객관적인 결과를 제공합니다. 이 방법은 28개의 모든 통화쌍 간의 관계를 동시에 분석 하여 시장에서 실제로 형성되는 힘의 균형을 보다 명확하고 편향 없이 보여줍니다. 실시간 대시보드 메인 테이블에는 8개의 통화 에 대한 전체 데이터가 표시됩니다. Rank (순위) — 전체 강도 기준 통화 순위, 1
Btmm state engine pro
Garry James Goodchild
5 (3)
BTMM State Engine Pro is a MetaTrader 5 indicator for traders who use the Beat The Market Maker approach: Asian session context, kill zone timing, level progression, peak formation detection, and a multi-pair scanner from a single chart. It combines cycle state logic with a built-in scanner dashboard so you do not need the same tool on many charts at once. What it does Draws the Asian session range; session times can follow broker server offset or be set in inputs. Tracks level progression (L
Meridian Pro
Ottaviano De Cicco
5 (1)
Meridian Pro: Professional Multi-Timeframe Trend Matrix for MT5 Overview Meridian Pro is a multi-timeframe trend matrix by Merkava Labs that compresses directional state, strength, momentum condition and matrix agreement into one compact panel. One adaptive engine, applied consistently from M1 to W1. No per-symbol tuning. No indicator stacking. One structured readout across every asset and every timeframe. Launch Offer — Get Meridian Pro for USD 99 (introductory). Regular price: USD 149. 1. Why
Atomic Analyst MT5
Issam Kassas
3.94 (31)
우선적으로 언급할 점은이 거래 지표가 다시 그리지 않고 지연되지 않으며 이를 통해 수동 및 로봇 거래 모두에 이상적이라는 점입니다. 사용자 매뉴얼: 설정, 입력 및 전략. Atomic Analyst는 가격의 강도와 모멘텀을 활용하여 시장에서 더 나은 이점을 찾는 PA Price Action Indicator입니다. 고급 필터를 장착하여 잡음과 거짓 신호를 제거하고 거래 잠재력을 높이는 데 도움이 됩니다. 복잡한 지표의 다중 레이어를 사용하여 Atomic Analyst는 차트를 스캔하고 복잡한 수학적 계산을 간단한 신호와 색상으로 변환하여 초보 트레이더가 이해하고 일관된 거래 결정을 내릴 수 있도록합니다. "Atomic Analyst"는 새로운 및 경험이 풍부한 트레이더를위한 종합적인 거래 솔루션입니다. 프리미엄 지표와 최고 수준의 기능을 하나의 거래 전략에 결합하여 모든 종류의 트레이더에 대한 다재다능한 선택지가되었습니다. 인트라데이 거래 및 스캘핑 전략 : 빠르고 정확한 일일
Quantum TrendPulse
Bogdan Ion Puscasu
5 (22)
SuperTrend   ,   RSI   ,   Stochastic   의 힘을 하나의 포괄적인 지표로 결합하여 트레이딩 잠재력을 극대화하는 궁극의 트레이딩 도구   인 Quantum TrendPulse를   소개합니다. 정밀성과 효율성을 추구하는 트레이더를 위해 설계된 이 지표는 시장 추세, 모멘텀 변화, 최적의 진입 및 종료 지점을 자신 있게 식별하는 데 도움이 됩니다. 주요 특징: SuperTrend 통합:   주요 시장 추세를 쉽게 따라가고 수익성의 물결을 타세요. RSI 정밀도:   매수 과다 및 매도 과다 수준을 감지하여 시장 반전 시점을 파악하는 데 적합하며 SuperTrend 필터로 사용 가능 확률적 정확도:   변동성이 큰 시장에서 숨겨진 기회를 찾기 위해 확률적 진동   을 활용하고 SuperTrend의 필터로 사용 다중 시간대 분석:   M5부터 H1 또는 H4까지 다양한 시간대에 걸쳐 시장을 최신 상태로 유지하세요. 맞춤형 알림:   맞춤형 거래 조건이 충족되면
Market Structure Order Block Dashboard MT5 는 MetaTrader 5용 MT5 인디케이터 로, 시장 구조 및 ICT / Smart Money Concepts에 기반합니다: HH/HL/LH/LL , BOS , ChoCH 뿐 아니라 Order Blocks , Fair Value Gaps (FVG) , 유동성 (EQH/EQL, sweeps), 세션 / Kill Zones , 그리고 Volume Profile 을 통합하여 콤팩트한 컨플루언스 대시보드를 제공합니다. 중요: 본 제품은 분석 도구 입니다. 자동 매매를 실행하지 않습니다( EA가 아님 ). 구매자 보너스 구매 후 제 스토어에서 보너스 인디케이터 2개 를 (선택하여) 무료로 받을 수 있습니다. 보너스 수령 방법: 1) 본 제품에 대한 솔직한 리뷰를 남겨주세요. 2) MQL5 메시지로 BONUS MSOB + 선택한 인디케이터 2개 이름 을 보내주세요. 주요 기능 시장 구조: HH/HL/LH/LL
FX Power MT5 NG
Daniel Stein
5 (31)
FX Power: 통화 강세 분석으로 더 스마트한 거래 결정을 개요 FX Power 는 어떤 시장 상황에서도 주요 통화와 금의 실제 강세를 이해하기 위한 필수 도구입니다. 강한 통화를 매수하고 약한 통화를 매도함으로써 FX Power 는 거래 결정을 단순화하고 높은 확률의 기회를 발견합니다. 트렌드를 따르거나 극단적인 델타 값을 사용해 반전을 예측하고자 한다면, 이 도구는 귀하의 거래 스타일에 완벽히 적응합니다. 단순히 거래하지 말고, FX Power 로 더 스마트하게 거래하세요. 1. FX Power가 거래자에게 매우 유용한 이유 통화와 금의 실시간 강세 분석 • FX Power 는 주요 통화와 금의 상대적 강세를 계산하고 표시하여 시장 역학에 대한 명확한 통찰력을 제공합니다. • 어떤 자산이 앞서고 있고 어떤 자산이 뒤처지는지 모니터링하여 보다 현명한 거래 결정을 내릴 수 있습니다. 포괄적인 멀티 타임프레임 뷰 • 단기, 중기 및 장기 타임프레임에서 통화와 금의 강세를
OmniSync Projection
Antonio-alin Teculescu
5 (1)
Chronos Fractal Engine is an innovative price projection indicator for MetaTrader 5, designed to transform your technical analysis by intelligently identifying and projecting historical price patterns. Built upon an advanced correlation algorithm and the fractal principles of the market, this powerful tool visualizes potential future price movements, giving you a unique edge in your trading decisions. What is Chronos Fractal Engine? At its core, the Chronos Fractal Engine employs a sophisticat
Gann Made Easy 는 mr.의 이론을 사용하여 최고의 거래 원칙을 기반으로 하는 전문적이고 사용하기 쉬운 Forex 거래 시스템입니다. W.D. 간. 이 표시기는 Stop Loss 및 Take Profit Levels를 포함하여 정확한 BUY 및 SELL 신호를 제공합니다. PUSH 알림을 사용하여 이동 중에도 거래할 수 있습니다. 구매 후 거래 방법 안내 및 유용한 추가 지표를 무료로 받으시려면 저에게 연락주세요! 아마도 Gann 거래 방법에 대해 이미 여러 번 들었을 것입니다. 일반적으로 Gann의 이론은 초보자 거래자뿐만 아니라 이미 거래 경험이 있는 사람들에게도 매우 복잡한 것입니다. Gann의 거래 방식은 이론적으로 적용하기 쉽지 않기 때문입니다. 나는 그 지식을 연마하고 Forex 지표에 최고의 원칙을 적용하기 위해 몇 년을 보냈습니다. 표시기는 적용하기가 매우 쉽습니다. 차트에 첨부하고 간단한 거래 권장 사항을 따르기만 하면 됩니다. 지표는 지속적으로 시장 분석
ARICoins
Temirlan Kdyrkhan
ARICoin is a powerful trading companion designed to generate high-probability entry signals with dynamic TP/SL/DP levels based on volatility. Built-in performance tracking shows win/loss stats, PP1/PP2 hits, and success rates all updated live. Key Features: Buy/Sell signals with adaptive volatility bands Real-time TP/SL/DP levels based on ATR Built-in MA Filter with optional ATR/StdDev volatility Performance stats panel (Success, Profit/Loss, PP1/PP2) Alerts via popup, sound, push, or email Cust
Grabber System MT5
Ihor Otkydach
4.83 (23)
탁월한 기술적 지표인 Grabber를 소개합니다. 이 도구는 즉시 사용 가능한 “올인원(All-Inclusive)” 트레이딩 전략으로 작동합니다. 하나의 코드 안에 강력한 시장 기술 분석 도구, 매매 신호(화살표), 알림 기능, 푸시 알림이 통합되어 있습니다. 이 인디케이터를 구매하신 모든 분들께는 다음의 항목이 무료로 제공됩니다: Grabber 유틸리티: 오픈 포지션을 자동으로 관리하는 도구 단계별 영상 매뉴얼: 설치, 설정, 그리고 실제 거래 방법을 안내 맞춤형 세트 파일: 인디케이터를 빠르게 자동 설정하여 최고의 성과를 낼 수 있도록 도와줍니다 다른 전략은 이제 잊어버리세요! Grabber만이 여러분을 새로운 트레이딩의 정점으로 이끌어 줄 수 있습니다. Grabber 전략의 주요 특징: 거래 시간 프레임: M5부터 H4까지 거래 가능한 자산: 어떤 자산이든 사용 가능하지만, 제가 직접 테스트한 종목들을 추천드립니다 (GBPUSD, GBPCAD, GBPCHF, AUDCAD, AU
Smart Stop Indicator – 차트 위에서 직접 작동하는 지능형 스톱로스 시스템 개요 Smart Stop Indicator는 감이나 추측이 아닌 명확하고 체계적인 방식으로 스톱로스를 설정하고 싶은 트레이더를 위한 맞춤형 솔루션입니다. 이 도구는 클래식 프라이스 액션 논리(고점, 저점 구조)와 현대적인 브레이크아웃 인식을 결합하여 실제로 가장 논리적인 다음 스톱 레벨을 정확히 식별합니다. 추세, 박스권, 빠른 브레이크아웃 상황 등 어떤 시장에서도 인디케이터는 최적의 SL 구역과 상태(“new”, “broken”, “valid”)를 차트에 직접 표시합니다. 새로운 기능으로 SL 거리의 %ADR 표시가 추가되었습니다. 핵심 기능 자동 시장구조 기반 스톱 설정 • 시장 구조와 실시간 가격 움직임을 기반으로 의미 있는 스톱로스 레벨을 자동으로 탐지합니다. 스마트 브레이크아웃 감지 • 빠른 방향 변화나 돌파 상황에서도 불필요한 조기 스톱 조정을 강요하지 않으며 유연하게 반응합
Market Structure Patterns
Samuel Manoel De Souza
4.47 (19)
Available for   MT4   and   MT5 . Join the Market Structure Patterns channel to download materials available for study and/or additional informations. Related posts: Market Structure Patterns - Introduction Beyond Fancy Order Blocks: Using True Volumetric Analysis with Market Structure Patterns & Timeless Charts Market Structure Patterns   is an indicator based on   smart money concepts   that displays   SMC/ICT   elements that can take your trading decisions to the next level. Take advantage
RFI levels PRO MT5
Roman Podpora
3.67 (3)
이 지표는 추세 반전 지점과 가격 반등 영역을 정확하게 보여줍니다.       주요 투자자들   . 새로운 트렌드가 형성되는 곳을 파악하고 최대한 정확하게 의사결정을 내리며 모든 거래를 완벽하게 통제합니다. TREND LINES PRO   지표와 함께 사용할 때 최대의 잠재력을 발휘합니다.  VERSION MT4 지표가 보여주는 내용: 새로운 추세의 시작 시 활성화되는 반전 구조 및 반전 수준. 최소한의 위험 대비 수익률을 갖는 이익 실현   (TAKE PROFIT)   및   손절매(STOP LOSS)   레벨 표시       RR 1:2   . 지능형 손실 감소 로직이 적용된 손절매 기능. 지정된 지표에서 두 가지 추세 유형에 대한 반전 패턴을 표시합니다. 지표: 트렌드를 따라   트렌드 라인 프로   (글로벌 트렌드 변화) 트렌드 프로   (빠른 트렌드 변화) 간단하고 효과적입니다       스캐너       실시간 추세 (신규). 다중 시간 프레임 도구 필터링. 표시하다  
ARIPoint
Temirlan Kdyrkhan
ARIPoint is a powerful trading companion designed to generate high-probability entry signals with dynamic TP/SL/DP levels based on volatility. Built-in performance tracking shows win/loss stats, PP1/PP2 hits, and success rates all updated live. Key Features: Buy/Sell signals with adaptive volatility bands Real-time TP/SL/DP levels based on ATR Built-in MA Filter with optional ATR/StdDev volatility Performance stats panel (Success, Profit/Loss, PP1/PP2) Alerts via popup, sound, push, or email Cu
Crystal Heikin Ashi Signals
Muhammad Jawad Shabir
5 (1)
Crystal Heikin Ashi Signals - Professional Trend & Signal Detection Indicator Advanced Heikin Ashi Visualization with Intelligent Signal System for Manual & Automated Trading Final Price: $149 ---------> Price goes up $10 after every 10 sales . Limited slots available — act fast . Overview Crystal Heikin Ashi Signals is a professional-grade MetaTrader 5 indicator that combines pure Heikin Ashi candle visualization with an advanced momentum-shift detection system. Designed for both manual traders
Pips Stalker mt5
Abdulkarim Karazon
5 (2)
핍스 스토커는 롱 숏 화살표 유형의 지표로, 모든 수준의 트레이더들이 더 나은 시장 결정을 내릴 수 있도록 돕습니다. 이 지표는 절대 재도색되지 않고 RSI를 주요 신호 로직으로 사용합니다. 화살표가 주어지면 절대 다시 도색되거나 다시 도색되지 않고, 화살표 지연도 없습니다. MT4 버전 <---- PIPS STALKER ARROW 기능 : 통계 패널 전체 승률 %와 연속 최대 승리 및 패배 거래 등 유용한 통계, 기타 유용한 정보를 보여주는 독특한 정보 대시보드입니다. TP와 SL, 내장된 자금 관리 이 지표는 각 화살표마다 TP와 SL 객체를 제공하므로, 거래자는 자금 및 위험 관리를 내장하고 있으며, SL은 ATR을 기반으로 하며, TP는 현재 ATR SL 가치를 기반으로 한 위험 대비 보상 비율을 기반으로 합니다. 재도색 없음, 높은 조정 가능성 이 인디케이터는 신호 품질 개선을 위한 다양한 옵션을 제공하여 어떤 쌍에서도 약간의 기간 조정만으로 작동하며, 패널은
중국천기 글로벌 시장 상태 분석 시스템은 어떤 종목과 어떤 시간 주기에도 사용할 수 있는 MT5 시장 상태 분석 지표입니다. 현재 시장이 박스권인지 추세장인지 더 명확하게 판단할 수 있도록 도와주며, 어떤 가격 구간이 더 주목할 가치가 있고 어떤 구간은 매력적으로 보이지만 실제로는 위험이 더 높은지 판단하는 데 도움을 줍니다. 중국천기 글로벌 시장 상태 분석 시스템은 시장 상태, 가격 구조, 방향 변화를 더 명확하게 이해할 수 있도록 설계된 분석형 지표 시스템입니다. 단순히 매수나 매도 신호만 보여주기 위한 도구가 아닙니다. 현재 시장이 박스권인지 추세장인지, 그리고 지금의 가격 구간이 기회에 더 가까운지 아니면 위험에 더 가까운지를 더 분명하게 이해하도록 돕는 것이 핵심입니다. 많은 트레이더들은 매일 같은 질문을 반복합니다. 이미 가격이 많이 떨어졌는데 여기서 반등할까? 지금 매수해야 할까? 이 자리가 진짜 저점일까, 아니면 가짜 저점일까? 이 반등 이후에도 시장은 다시 더 내려갈
Trend Hunter MT5
Andrey Tatarinov
5 (4)
Trend Hunter 는 Forex, 암호화폐 및 CFD 시장에서 작업하기 위한 추세 지표입니다. 이 지표의 특별한 특징은 가격이 추세선을 약간 돌파할 때 신호를 변경하지 않고 자신있게 추세를 따른다는 것입니다. 표시기는 다시 그려지지 않으며 막대가 닫힌 후에 시장 진입 신호가 나타납니다. 추세를 따라 이동할 때 표시기는 추세 방향에 대한 추가 진입점을 표시합니다. 이러한 신호를 바탕으로 작은 StopLoss로 거래할 수 있습니다. Trend Hunter 는 정직한 지표입니다. 표시 신호 위로 마우스를 가져가면 신호의 잠재적 이익과 가능한 중지가 표시됩니다. 새로운 신호가 나타나면 다음 알림을 받을 수 있습니다. 알리다 푸시 알림 이메일로 알림 텔레그램 알림 차트 스크린샷도 텔레그램으로 전송되므로 거래 결정을 내리기 위해 단말기를 열 필요가 없습니다. 표시 신호는 텔레그램 채널 https://www.mql5.com/ko/market/product/11085#!tab=com
제작자의 제품 더 보기
Phase Angle Cycle
Pieter Gerhardus Van Zyl
Check out my German Pro Signal - https://www.mql5.com/en/signals/2354346 Phase Angle Cycle   is a precision timing oscillator designed to reveal the underlying rhythm of price movement. Instead of relying on traditional momentum or overbought/oversold logic, it focuses on identifying the market’s internal phase progression and dominant cycle structure. Displayed in a separate window, it blends phase positioning with adaptive frequency smoothing to help traders recognize where price is within it
Phase Angle Cycle Mt5
Pieter Gerhardus Van Zyl
Check out my German Pro Signal -   https://www.mql5.com/en/signals/2354346 Phase Angle Cycle Mt5   is a precision timing oscillator designed to reveal the underlying rhythm of price movement. Instead of relying on traditional momentum or overbought/oversold logic, it focuses on identifying the market’s internal phase progression and dominant cycle structure. Displayed in a separate window, it blends phase positioning with adaptive frequency smoothing to help traders recognize where price is wit
Quantum Core Phase Shift
Pieter Gerhardus Van Zyl
Check out my German Pro Signal - https://www.mql5.com/en/signals/2354346 Quantum Core – Phase Shift is a neural synchronization engine designed for intermarket phase diagnostics. Harnessing temporal displacement algorithms and flux harmonics, it decodes the hidden oscillatory behavior of market energy fields. The NeuroLink Trace renders the core stability vector, while the Quantum Phase Core tracks phase divergence through a smoothed temporal conduit. Anchored to a central gravity threshold,
Reversal Spiker
Pieter Gerhardus Van Zyl
5 (1)
Reversal Spiker is a dynamic momentum–volatility fusion indicator designed to highlight extreme market conditions where price is statistically stretched and prone to reversal. It operates in a separate window, displaying a normalized histogram that expands toward high values when multiple internal forces align. A dynamic threshold line adapts in real time to changing market volatility, helping distinguish ordinary movement from true exhaustion spikes. At its core, the indicator blends several mo
Spinosaurus
Pieter Gerhardus Van Zyl
Check out my German Pro Signal -  https://www.mql5.com/en/signals/2354346 The indicator is a histogram that is great for showing when to enter the market When the hump moves above the median go long and when it moves below the median go short The colors can be adjusted as preferred  Suitable for any timeframe Test in demo before purchase Enjoy -------------------------------------------------------------------------------
Non Repaint Diamonds
Pieter Gerhardus Van Zyl
Non Repaint Diamonds is a precision-engineered MT5 indicator designed to provide traders with highly reliable chart signals that remain stable once confirmed. Unlike repainting tools that shift or vanish after the fact, this indicator locks its signals in place, allowing traders to analyze with confidence. It marks the chart with distinct diamond-shaped signals that highlight potential turning points in market structure. The tool offers flexible customization of signal appearance, offsets, an
Pullback Arrows
Pieter Gerhardus Van Zyl
5 (1)
i pyosigineun EMAleul giban-eulo han idong pyeong-gyun mich magdae saegsang-eulo maesu mich maedo hwasalpyoleul jegonghabnida. idongpyeong-gyunseon wieneun maesu hwasalpyoman pyosidoego idongpyeong-gyunseon alaeeneun maedo hwasalpyoman pyosidoebnida. hwasalpyoneun banjeon algolijeum-eul giban-eulo hameulo pulbaeg jijeom-eul chaj-eulyeogo habnida. wonhaneun daelo allim-eul hwalseonghwahal su issseubnida.  seontaeghan gigan-ina dogue jeoghab gumaehagi jeon-e demo-eseo teseuteuhae b
Arrow Wizard
Pieter Gerhardus Van Zyl
Check out my German Pro Signal -  https://www.mql5.com/en/signals/2354346 Arrow Wizard v1.1 – The Spellcaster of Precision Signals Step into the mystical world of technical sorcery with Arrow Wizard , your trusted arcane companion for revealing buy and sell portals on any price chart. Powered by a fusion of ATR incantations , Fibonacci alignments , and pivot-based foresight , this indicator weaves price action and volatility into clear directional arrows – each one a magical glyph pointi
Gold Strength Index Pro
Pieter Gerhardus Van Zyl
Check out my German Pro Signal -  https://www.mql5.com/en/signals/2354346 Gold Strength Index Pro (GSI Pro)   is an indicator designed to analyze gold's strength across multiple currency pairs. It aggregates weighted price data from 7 XAU pairs (e.g., XAUUSD, XAUEUR) over a user-defined lookback period, calculating a composite strength value. Key features include: Color-Coded Histogram : Displays bullish (green) and bearish (red) - momentum based on a threshold zone (±0.2 default). Smoothed L
Dragons Pulse Oracle
Pieter Gerhardus Van Zyl
Check out my German Pro Signal -  https://www.mql5.com/en/signals/2354346 The Dragon's Pulse Oracle - A Mystical Market Divination Tool In the ancient halls of trading lore, where fortunes rise and fall like the breath of dragons, the   Dragon's Pulse Oracle   emerges—a powerful indicator forged from the wisdom of seers and the primal energy of the markets. This mystical tool reveals the hidden currents of price action, transforming raw data into prophetic visions of bullish fire and bearish s
AlienCore Oscillator
Pieter Gerhardus Van Zyl
AlienCore Oscillator is a futuristic market momentum analyzer inspired by intergalactic signal processing. Based on the enhanced MACD concept, it measures the energy flux between fast and slow warp fields, then decodes the telepathic sync signal to reveal alien-level insights into trend strength and shifts. Quantum Surges (strong bullish moves) and Void Collapses (strong bearish moves) are visualized through vibrant histograms, while Nebula Drifts and Gravity Pulls signal moderate momentum. Des
USD Macro Strength Index
Pieter Gerhardus Van Zyl
Check out my German Pro Signal -  https://www.mql5.com/en/signals/2354346 The USD Macro Strength Index is a custom indicator designed to assess and visualize the overall strength or weakness of the US Dollar (USD) across major currency pairs. It achieves this by calculating a weighted average of USD-related price changes over a defined lookback period and displaying the results as a color-coded histogram with optional smoothed index and signal lines. Key Features: Macro USD Sentiment Analy
Dragonfire Arrows
Pieter Gerhardus Van Zyl
Check out my German Pro Signal - https://www.mql5.com/en/signals/2354346 Dragonfire Arrows is a mythical-themed arrow signal indicator that blends adaptive trend-following logic with multiple types of moving averages—reimagined as “Dragon Breaths.” It generates Buy (Ice Arrow ↑) and Sell (Fire Arrow ↓) signals directly on the chart using a multi-layered pulse system inspired by fantasy creatures, each with its own moving average logic. The system uses three magical “pulse” layers: Dragon’s Quic
XauUsd Net Strength
Pieter Gerhardus Van Zyl
Check out my German Pro Signal -  https://www.mql5.com/en/signals/2354346 The XauUsd Net Strength indicator is a professional-grade market strength tool designed to track and compare the relative performance of Gold (XAU) against the U.S. Dollar (USD) across a diversified basket of currency pairs. Instead of relying on a single chart, it aggregates information from multiple gold- and dollar-based pairs, applies weighting factors, and translates the results into an easy-to-read strength compari
Multi Currency Strength Index
Pieter Gerhardus Van Zyl
The Multi-Currency Strength Index is a professional analytical tool designed to reveal relative strength and weakness across major currencies and Gold in a single, unified view. Instead of focusing on one symbol at a time, the indicator evaluates multiple instruments simultaneously and plots smooth strength lines in a separate window, making cross-market comparison fast and intuitive. Each colored line represents a currency’s aggregated performance over the selected analysis period. Values above
Non Repaint Dots
Pieter Gerhardus Van Zyl
Check out my German Pro Signal -  https://www.mql5.com/en/signals/2354346 The indicator is designed to highlight potential buy and sell opportunities on the chart using green and red dots . A green dot suggests that price has broken upward past a calculated threshold, signaling a possible bullish move. A red dot suggests that price has broken downward past a calculated threshold, signaling a possible bearish move. It adapts to market conditions by factoring in both trend movement and volatilit
Wavelet Pro
Pieter Gerhardus Van Zyl
Wavelet Pro is a precision-engineered market analysis indicator designed for traders who demand clarity in complex price movement. It blends wavelet-style trend detection , quantum momentum shifts , and adaptive candle visualization into a unified trading framework. The system’s goal is to provide a refined visual representation of trend strength, phase changes, and market balance without lag or repainting behavior. At its core, Wavelet Pro constructs a dynamic dual-line wave structure that rea
NeuroSlope
Pieter Gerhardus Van Zyl
Check out my German Pro Signal -  https://www.mql5.com/en/signals/2354346 NeuroSlope is a precision-tuned market strength indicator that enhances RSI analysis using adaptive neuro-style smoothing. It intelligently filters out noise and volatility spikes while maintaining the RSI’s natural rhythm, creating a clean, flowing signal that better reflects underlying price momentum. The dual-histogram structure — the smart smoothed RSI (blue) and its advanced slope curve (yellow) — provides a clear v
Astral Energy
Pieter Gerhardus Van Zyl
Check out my German Pro Signal -  https://www.mql5.com/en/signals/2354346 Astral Energy (MT4) From the Astral Mechanics Lab – Ptr777 Overview Astral Energy is an advanced subwindow indicator designed to visualize the directional “flow” of market energy through a harmonic dual-stream histogram. It interprets the balance of internal strength and weakness within price movement — revealing when the market’s astral momentum is aligning for expansion (ascending phase) or contraction (descending p
Cosmic Flow
Pieter Gerhardus Van Zyl
Check out my German Pro Signal -  https://www.mql5.com/en/signals/2354346 Cosmic Flow  From the Astral Mechanics Lab – Ptr777 , Cosmic Flow is the harmonic oscillator at the heart of astral motion and energetic balance. It visualizes the subtle rhythm between celestial expansion and contraction — the hidden pulse that governs the market’s energetic tides. Each bar in the histogram represents the phase alignment between astral momentum and harmonic strength, capturing the invisible ebb and
Goldin Line
Pieter Gerhardus Van Zyl
Check out my German Pro Signal - https://www.mql5.com/en/signals/2354346 Goldin Line is a precision momentum oscillator designed to reveal hidden shifts in market pressure. It plots a dynamic Gold Line together with a Signal Line inside a normalized 0–100 scale, allowing traders to quickly identify momentum transitions and potential trend opportunities. The indicator blends market activity with a gold-influenced component to create a unique view of price strength and weakness. Horizontal guide
Gold Ripper Oscillator
Pieter Gerhardus Van Zyl
Check out my German Pro Signal -  https://www.mql5.com/en/signals/2354346 The Gold Ripper Oscillator is a specialized momentum-pressure gauge designed for XAUUSD. It visualizes the real-time tug-of-war between bullish gold strength (“GoldRush”) and opposing USD pressure (“USDCrush”). The indicator displays two color-coded histogram streams that expand or contract based on shifting market drive. When the gold side dominates, golden bars rise above the baseline, reflecting strong upward energy.
Cosmic Nexus
Pieter Gerhardus Van Zyl
Check out my German Pro Signal -  https://www.mql5.com/en/signals/2354346 Cosmic Nexus is a pure momentum-direction histogram designed to show the dominant force in the market with instant visual clarity. Instead of plotting fluctuating values, it simplifies momentum into two clean states: Cosmic Ascension (green) when upward pressure dominates, and Celestial Descent (violet) when downside energy takes control. This makes trend recognition fast and intuitive, even during volatile periods. You
Cosmic Nebula
Pieter Gerhardus Van Zyl
Check out my German Pro Signal -  https://www.mql5.com/en/signals/2354346 Cosmic Nebula is an advanced MT4 momentum and trend-state oscillator that transforms classical ADX directional flow into a multi-state market structure model. By combining directional pressure, triple-EMA (TEMA) smoothing, and weighted signal comparison, it visualizes market conditions as distinct “cosmic phases,” allowing traders to instantly recognize trend strength, transitions, and exhaustion. The indicator runs in a
Neuro Lines
Pieter Gerhardus Van Zyl
Check out my German Pro Signal -  https://www.mql5.com/en/signals/2354346 Neuro Lines is an advanced visual momentum-mapping indicator designed to overlay intelligent oscillation lines directly onto the price chart. Instead of working in a separate sub-window, it transforms internal market rhythm into dynamic, price-scaled lines that move with the chart itself. This creates a highly intuitive view of momentum shifts, trend bias, and timing without cluttering your workspace. The indicator plots
Gold Force Index
Pieter Gerhardus Van Zyl
Check out my German Pro Signal -  https://www.mql5.com/en/signals/2354346 Gold Force Index is a relative strength oscillator designed to compare Gold and the US Dollar in a clean, intuitive way. It visualizes which side of the market currently holds dominance by transforming multi-market data into two normalized strength curves displayed in a separate indicator window. The focus is clarity: instead of reacting to short-term price noise, the indicator highlights sustained shifts in strength tha
Gold Oscillator Pro
Pieter Gerhardus Van Zyl
Check out my German Pro Signal -  https://www.mql5.com/en/signals/2354346 Gold Oscillator Pro is a professional momentum and strength oscillator designed to give a clear, structured view of gold market conditions across multiple related instruments. It condenses complex market behavior into a single, easy-to-read histogram with an adaptive signal line, helping traders identify bullish and bearish phases, momentum shifts, and potential continuation or exhaustion zones. The indicator is displaye
Wavelet Energy Pro
Pieter Gerhardus Van Zyl
Check out my German Pro Signal -  https://www.mql5.com/en/signals/2354346 Wavelet Energy Pro is an advanced momentum and pressure-analysis oscillator designed to reveal how much directional “energy” is present in the market, not just which way price is moving. Instead of focusing on raw price alone, it highlights the balance between bullish and bearish force, how strong that force is, and—most importantly—when that strength begins to fade. The indicator is displayed in a separate window and co
Gold Bands
Pieter Gerhardus Van Zyl
Check out my German Pro Signal -  https://www.mql5.com/en/signals/2354346 Gold Bands is a precision chart indicator designed to highlight cyclical price behavior while adapting to changing market volatility. The indicator plots a dynamic central line that follows a smoothed price rhythm derived from market structure rather than simple price averaging. This core line represents the underlying oscillation of price movement and helps traders visually identify shifts between expansion and contracti
Bitcoin Barometer
Pieter Gerhardus Van Zyl
Check out my German Pro Signal - https://www.mql5.com/en/signals/2354346 Bitcoin Barometer   is a dual-strength oscillator designed to measure the relative momentum of Bitcoin versus the US Dollar in one clear view. It plots two smoothed lines in a separate window:   BTC Strength   (orange) and   USD Strength   (blue), both normalized on a 0–100 scale with a central equilibrium level at 50. The indicator calculates percentage return over a customizable lookback period (minutes, hours, or days),
필터:
리뷰 없음
리뷰 답변