Ultimate MTF Moving Average Pro

Ultimate MTF Moving Average Pro와 함께 추세 매매의 진정한 힘을 경험해 보세요. 모든 시장 상황에서 명확하고 신뢰할 수 있으며 즉각 실행 가능한 신호를 제공하도록 설계된 차세대 인지표입니다.

이것은 단순한 이동평균선 도구가 아닙니다. 멀티 타임프레임(MTF) 분석, 고급 MA 알고리즘, 정밀 크로스오버 감지가 결합된 종합 추세 지능 시스템으로, 더 빠른 진입과 더 긴 추세 유지, 그리고 자신감 있는 청산을 도와줍니다.

M1 차트에서 골드 스캘핑을 하든, 외환 인트라데이 거래를 하든, 혹은 스윙 포지션을 보유하든 — 이 지표는 귀하의 전략에 맞춰 차트 위에 기관급 명확성을 직접 제공합니다.

더 이상의 추측은 필요 없습니다. 지연되는 신호도 없습니다. 깔끔한 추세, 스마트한 진입, 그리고 자신감 있는 결정만이 남습니다.

  1. 주요 기능 ✅ 멀티 타임프레임 (MTF) 분석 더 강한 신호를 위해 상위 타임프레임의 확증을 받아 거래하세요. ✅ 8가지 고급 이동평균선 유형 SMA, EMA, WMA, Hull, VWMA, RMA, TEMA, Tilson T3 포함. ✅ 다이내믹 추세 컬러링 불(Bull)과 베어(Bear) 방향을 즉각적으로 확인. ✅ 듀얼 이동평균 시스템 추세 강도와 모멘텀 변화를 식별. ✅ 정밀 크로스 신호 MA 크로스오버 및 가격 돌파 이벤트를 감지. ✅ 스마트 진입 알림 (EA용 버퍼 지원) 9개의 버퍼를 통해 전문가 시스템(EA)과 완벽하게 호환. ✅ 노이즈 감소 스무딩 변동성이 큰 시장에서 가짜 신호를 방지. ✅ 고도의 사용자 맞춤 설정 어떤 전략이나 매매 스타일에도 최적화 가능.

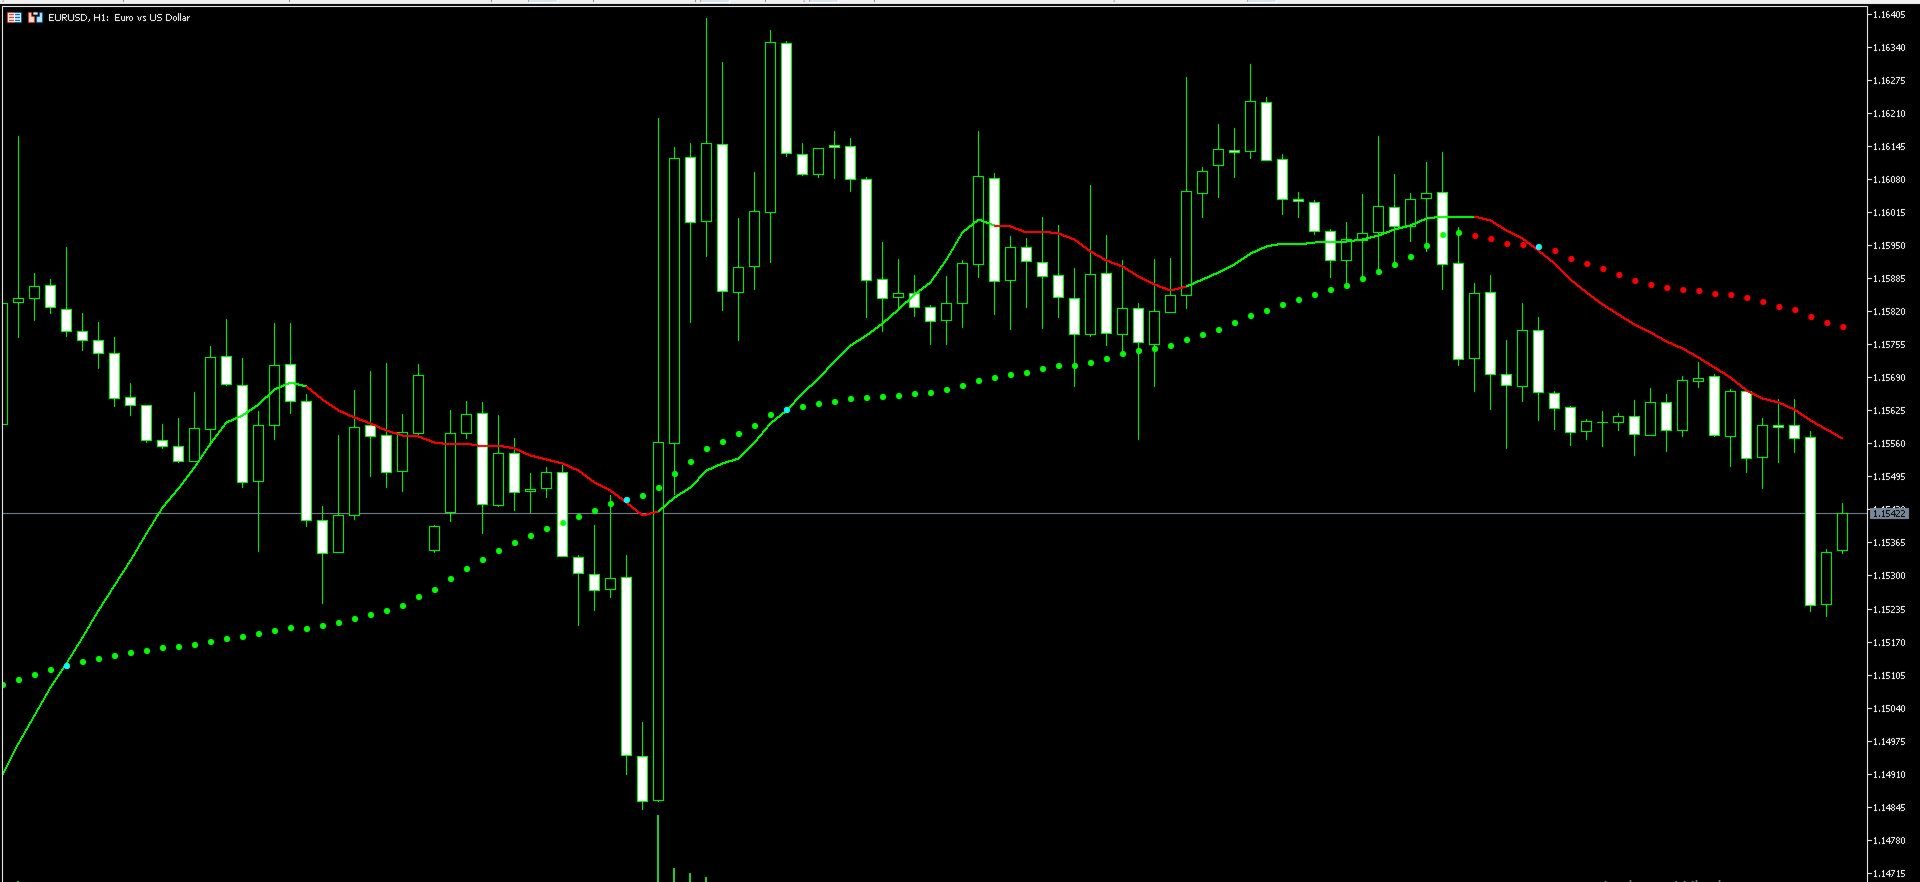
  2. 작동 원리 이 지표는 **주 이동평균선 (MA1)**을 사용하여 주요 추세 방향을 정의하며, 컬러 기반 모멘텀 감지 기능으로 강화되었습니다. 선택 사항인 **보조 이동평균선 (MA2)**은 더욱 깊은 확증을 더해주어 트레이더가 다음을 식별할 수 있게 합니다:

추세 지속

추세 반전

모멘텀 가속

신호는 다음을 통해 생성됩니다:

MA 크로스오버 (추세 변화)

가격의 MA 돌파 (진입 트리거)

색상 변경 (모멘텀 확증)

멀티 타임프레임 기능을 통해 하위 타임프레임에서 거래하면서도 상위 타임프레임의 추세와 일치시킬 수 있습니다. 이는 전문 트레이더들이 사용하는 핵심적인 우위(Edge)입니다.

  1. 이 지표가 특별한 이유 기본적인 MA 지표들과 달리, 이 도구는 완성된 매매 프레임워크를 제공합니다: 🔥 하나의 도구에 MTF + 멀티 MA 로직 결합 🔥 8가지 다양한 MA 알고리즘 지원 (MT5에서 보기 드문 기능) 🔥 EA 통합을 염두에 둔 설계 (버퍼 시스템) 🔥 빠른 진입을 위한 설계 (공격적인 매매 스타일) 🔥 깔끔한 시각화 — 복잡함 없이 명확함만 제공

이것은 단순한 지표가 아니라 의사결정 엔진입니다.

  1. 권장 설정 🔹 스캘핑 (M1–M5)

MA 기간: 10–20

MA 유형: EMA 또는 Hull

MA2 활성화: 예 (30–50 정도의 짧은 기간)

타임프레임: 현재 (Current)

🔹 인트라데이 거래 (M15–H1)

MA 기간: 20–50

MA 유형: EMA 또는 TEMA

MTF 활성화: H1 또는 H4

크로스 신호 사용: 예

🔹 스윙 트레이딩 (H4–D1)

MA 기간: 50–100

MA 유형: Tilson T3 또는 SMA

MTF 설정: Daily / Weekly

중점: 추세 방향 + 풀백(눌림목) 진입

  1. 권장 사용자 이 지표는 다음과 같은 분들께 완벽합니다: ✔️ 빠르고 깔끔한 진입을 원하는 스캘퍼 ✔️ 확증 신호가 필요한 인트라데이 트레이더 ✔️ 강한 추세를 추종하는 스윙 트레이더 ✔️ 신뢰할 수 있는 버퍼 데이터가 필요한 EA 개발자 ✔️ 단순하고 직관적인 시각 가이드가 필요한 초보 트레이더 ✔️ 정밀한 도구를 요구하는 숙련된 트레이더

추천 제품
Institutional Tick Engine Pro: 틱 속도 및 히트맵 분석 Institutional Tick Engine Pro는 원시 틱 데이터를 처리하도록 설계된 기술적 분석 제품군입니다. 레벨 2 데이터 없이 속도(Velocity), 히트맵 및 미세 구조 패턴을 포함한 주문 흐름 지표를 합성합니다. 주요 기능 1. 틱 속도 모니터 시장 속도(초당 틱 수)를 측정하여 가격 움직임의 강도를 분석합니다. 2. 합성 유동성 히트맵 높은 거래량에도 불구하고 가격이 정체되는 "흡수 구역"을 시각화하여 숨겨진 지정가 주문을 식별합니다. 3. 미세 구조 반전 신호 형성 중인 캔들 내에서 틱 비율 불균형을 분석하여 잠재적인 반전 신호를 감지합니다. 4. 오디오 트레이딩 어시스턴트 (가이거 모드) 시장 변동성에 따라 소리 빈도를 조절하는 "가이거 계수기" 모드를 포함합니다. 기술 사양 데이터 소스: 브로커 틱 데이터. 알림: 푸시 알림, 이메일, 사운드 및 화면 경고. 내보내기: CSV 내
Pull It Back MT5
Salvatore Caligiuri
PROMOTIONAL PERIOD - ONLY 2 COPIES LEFT OF FIRST 10 BUYERS AT PRICE 300,00$!!! CHECK SCREENSHOTS AND COMMENTS FOR OUR STRATEGY RULES AND LIVE TRADES SIGNALS PULL IT BACK  is a revolutionary trading system and a complete strategy with advanced algorithm developed to detect the trend direction after a  PULLBACK , a  RETREACEMENT  or a  KEY LEVEL BOUNCE . The goal of this indicator is to get as many pips as possible from market trend. Following strictly the rules of the strategy, you can become a
Phase Accumulation Adaptive Market Mode
Mahmoud Helmy Sedik Mohamed Mansour
Phase accumulation adaptive bandpass filter MT5 Indicator is a Metatrader 5 (MT5) indicator and the essence of this technical indicator is to transform the accumulated history data. Phase accumulation adaptive bandpass filter MT5 Indicator provides for an opportunity to detect various peculiarities and patterns in price dynamics which are invisible to the naked eye. Based on this information, traders can assume further price movement and adjust their strategy accordingly.
Explosion Trend MT5 is a momentum and volatility based indicator designed to detect strong market activity and filter low energy conditions. The indicator combines: MACD based momentum acceleration Volatility expansion using standard deviation A dynamic dead zone filter based on market range Signals are generated when trend strength, volatility expansion and market activity align. Core Logic Trend strength is calculated from the difference between fast and slow exponential moving averages. The c
AlgoKing Chandelier Exit Indicator (MT5) The Chandelier Exit Indicator is a volatility based indicator that maximizes returns using the Average True Range (ATR) value and the highest high or lowest low of a period. Benefits Should be used as a trailing stop. Helps you exit a position when you have a respectable profit. Identifies a high probability of a trend reversal when the price moves against the prevailing trend by a distance equal to 3x the average volatility. Join the AlgoKing Lightning
Phoenix ATR Volatility Meter
PHOENIX GLOBAL INVESTMENTS LTD
피닉스 ATR 변동성 측정기 (MT5) 메타트레이더 5용 실시간 변동성 모니터링 도구입니다. 평균 진폭 범위(ATR)를 활용하여 차트에 현재 시장 변동성을 표시합니다. 목적 시장 변동성은 스탑 배치, 포지션 크기, 슬리피지, 전략 효과성에 직접적인 영향을 미칩니다. 변동성을 인지하지 못한 채 거래할 경우, 급변하는 시장에서는 과도한 위험을 감수하게 되고, 정체된 시장에서는 기회를 놓치게 됩니다. 피닉스 ATR 변동성 측정기는 현재 차트 데이터를 활용해 ATR을 계산하고 해당 값을 차트에 명확히 표시합니다. 측정기는 실시간으로 업데이트되며 심볼 및 시간대 변경에 자동으로 적응하여 트레이더가 시장이 안정적인지, 활발한지, 아니면 매우 변동성이 높은지 평가할 수 있도록 합니다. 설치 방법 MQL5 마켓에서 다운로드하여 원하는 차트에 부착하세요. 미터는 즉시 표시되며 별도의 설정이 필요하지 않습니다. 요구 사항 MetaTrader 5 빌드 3280 이상. 이 지표는 사용자 정
FREE
Buy Sell Visual MTF
Naththapach Thanakulchayanan
This MT5 indicator, Bull Bear Visual MTF (21 Time Frames), summarize the strength color graphic and percentages of power for both  Bull and Bear in current market emotion stage which will show you in multi time frames and sum of the total Bull and Bear power strength which is an important information for traders especially you can see all Bull and Bear power in visualized graphic easily, Hope it will be helpful tool for you for making a good decision in trading.
DeMarker (DeM) indicator is another member of the Oscillator family of technical indicators. Traders use the index to determine overbought and oversold conditions, assess risk levels, and time when price exhaustion is imminent. This indicator shows DeMarker data from 9 currency pairs of your choice for all 9 timeframes. If a digital value of DeM is less or equal to DnLevel = 0.3 (or whatever number you decided to put), Green square appears. This is potentially an oversold condition and may be a
Trix TURBO
Anderson De Assis
3 지표가 힘을 합칩니다! Trix TURBO는 오실레이터 계열의 지표로, MetaTrader 5용으로 커스터마이징되어 Triple Exponential Moving Average (TRIX) 오실레이터를 Parabolic SAR (SAR)과 결합하여 동적 색상을 적용하고, 간단한 이동 평균 (MA)을 통해 부드럽게 만듭니다. 이 도구는 별도의 창에서 모멘텀과 추세 방향의 시각적 표현을 제공합니다. TRIX 선(또는 히스토그램)은 SAR의 가격 대비 위치에 따라 색상이 지정됩니다: 잠재적 상승 추세를 위한 아쿠아(SAR이 가격 아래)와 잠재적 하락 추세를 위한 코랄(SAR이 가격 위). 포함된 MA는 잠재적 크로스오버를 식별하여 진입/퇴장 신호를 돕습니다. 주요 기능: TRIX 기간, 적용 가격 및 MA 매개변수 사용자 정의 가능. 추세 민감도를 조정하기 위한 SAR의 스텝 및 최대 값. 강도와 다이버전스를 더 잘 시각화하기 위한 색상 선 또는 히스토그램 표시 옵션. 상승 및 하락
MT5용 Crypto_Forex 지표 "추세 진입 히스토그램", 리페인트 없음. - 추세 진입 히스토그램 지표는 Entry_bar가 나타나면 추세 방향 진입 신호를 찾는 데 사용할 수 있습니다. - 이 지표는 가격과 거래량을 모두 고려하여 계산하는 고유한 특징을 가지고 있습니다. - 추세 진입 히스토그램은 두 가지 색상으로 제공됩니다. 빨간색은 약세 추세, 파란색은 강세 추세입니다. - 안정적인 추세(동일한 색상의 히스토그램 막대가 최소 10개 연속 표시)가 나타나면 Entry_bar가 표시될 때까지 기다리세요. - 진입 신호는 히스토그램에서 반대 색상의 열 하나와 초기 추세 색상의 다음 열입니다(그림 참조). - 숏 목표가를 사용하세요. 현재 추세에 따라 차트에서 가장 가까운 고가/저가를 사용하세요. - 지표에는 모바일 및 PC 알림 기능이 내장되어 있습니다. 사용 방법: - 매수 신호: 안정적인 강세 추세(파란색 히스토그램 막대) + 히스토그램의 빨간색 막대 1개 + 파란색
ENGLISH DESCRIPTION (MQL5 Standard Optimized) Product Name: Prime Alloy Thinker AI (MT5) [Subtitle: Thinker Regression | Alloy Stochastic | Sanctum Shield Safety] Introduction Prime Alloy Thinker AI is a calculated intelligence system designed to trade with the precision of a master thinker. It calculates the "Thinker Slope" using Linear Regression , aligns with the Prime Axis (EMA) , and executes trades only when the Alloy Oscillators (Stochastic + RSI) confirm a high-probability reversal. This
There is a strong correlation between tick volume and real volume.  This is important for 2 reasons: Real volume is a very important indicator because, among many other benefits, it provides strong confirmations of the emergence/dissipation of trends. Real volume is not available in Forex, instead, one has to make do with tick volume. Unfortunately, tick volume is highly broker dependent.  Additionally, it is often not used effectively to define indicators.  Virtually all indicators that use
Volume Profile SAF - Institutional-Grade Volume-informed Market Structure Indicator     Unlock Professional Market Intelligence with less Effort   Stop guessing. Start seeing. The Volume Profile SAF (Set and Forget) transforms complex market structure analysis into crystal-clear, actionable trading signals that institutional traders pay thousands for. Experience the power of real-time volume profiling, value area tracking, and precision POC cross alerts - all in one lightweight, EA-ready indicat
Session Volume Profile  is an advanced graphical representation that displays trading activity during Forex trading sessions at specified price levels. The Forex market can be divided into four main trading sessions: the Australian session, the Asian session, the European session and the favorite trading time - the American (US) session. POC  - profile can be used as a support and resistance level for intraday trading. VWAP  - Volume Weighted Average Price. ATTENTION  ! For the indicator to w
이 표시기는 간단한 선형 평활화 프로세스를 구현합니다. 지수 평활화의 단점 중 하나는 신호의 급격한 감쇠입니다. 이것은 가격대의 장기적인 추세를 완전히 추적하는 것을 불가능하게 만듭니다. 선형 평활화를 사용하면 신호 필터링을 보다 정확하고 미세하게 조정할 수 있습니다. 표시기는 매개변수를 선택하여 구성됩니다. LP - 이 매개변수를 사용하여 평활 기간을 선택할 수 있습니다. 값이 클수록 표시기는 더 장기적인 추세를 표시합니다. 유효한 값은 0 - 255입니다. SP -이 매개 변수는 표시기의 감도에 영향을 미칩니다. 이 매개 변수가 클수록 가격 시리즈의 마지막 값의 영향이 커집니다. 이 매개변수의 값이 0이면 표시기는 LP+1과 같은 기간으로 단순 이동 평균을 표시합니다. 유효한 값은 0 - 255입니다.
titoincV11 – Advanced Trend Detection and Tracking Module titoincV11 is a custom-built algorithm that dynamically analyzes price movements and determines market direction based on average values and volatility thresholds. It: Clearly identifies the current directional bias, Continuously tracks the relationship between price and algorithmic threshold, Detects directional shifts without delay, Produces a filtered signal line to act as a precise trigger for automated systems. When the price r
Bullhouse MarketFrequency
Luiz Vinicius Pereira Rocha -
Bullhouse MarketFrequency Description The MarketFrequency indicator displays color-coded histograms that reflect the market’s frequency and momentum over a chosen period. How it helps in trading It helps traders identify buying and selling momentum as well as neutral zones, providing a quick visual reference for potential market shifts. ️ How to use Simply set the desired period (default: 14 candles). The histogram will plot automatically in a separate window, showing momentum with fou
DYNAMIC SR TREND CHANNEL Dynamic SR Trend Channel is a simple indicator for trend detection as well as resistance/support levels on the current timeframe. It shows you areas where to expect possible change in trend direction and trend continuation. It works with any trading system (both price action and other trading system that use indicators) and is also very good for renko charting system as well. In an uptrend, the red line (main line) serves as the support and the blue line serves as the r
Session separator indicator draws boxes for each trading session to show the trader open and close hours with its high and low. Key features: Option to set hours and colours for 3 trading sessions. Boxes update immediately when breaking out of high/low. Hour shift or auto time zone. Choose the amount of days to draw session boxes. Indicator works on H1 and lower for visibility. Choose border style
VTC Volatility
Ricardo Almeida Branco
The VTC Volatility indicator was written to support a Brazilian stock market strategy in the WDO (USDBRL), but it can be adapted to other strategies and markets. In the new indicator update, it is now allowed to choose up to 4 levels to determine the range, and thus be more versatile. The Brazilian stock exchange (B3) has the VTC which is a "Structured Exchange Rate Volatility Transaction" (more information on the B3 website). At around 10:00 am, the VTC "Call" comes out and Brazilian broker
Fire Venom – The Ultimate Spike-Catching Weapon for Boom & Crash Traders   Fire Venom is a next-generation automated trading system engineered specifically for the Deriv Boom & Crash Indices, where precision, speed, and timing determine profit. This expert advisor is built to detect the exact micro-conditions that form before a spike, entering the market with split-second accuracy—no hesitation, no missed opportunities. Whether you trade a small account or a funded account, Fire Venom is opt
GRat Clusters  is an indicator that shows various data in the form of clusters on a price chart: volume, delta, ratio of sales and purchases, etc. It allows you to visually see the market profile in real time and on history at a given depth. Capabilities 1.8 types of cluster data: volume, delta, purchases   and sales , volume and delta, imbalance between sales and purchases , volume profile, delta profile, buy and sell profile. 2. A cluster period can be either any available in MT5 timeframe or
FOREX Alligator Robot EA ALLIGATOR was developed to achieve specific and highly accurate goals, which is key to guaranteeing significant returns in the world Forex market, works only in the EURUSD currency pair, and only in the time frame 15m It runs in the year 2016 onwards only. Be a predator in the most hostile market in the world. IMPORTANT -   - Outside of this scenario it breaks your account. HOW IT WORKS Our team has taken care to optimize your Forex market experience to the maximum, cre
Momentum Explosion Pro is an advanced trading indicator designed to help traders identify and capitalize on powerful market movements. By analyzing momentum and volatility dynamics, this tool provides clear buy and sell signals, empowering traders to make precise and timely decisions. Key Features: Momentum and Explosion Signals:   Accurately detects shifts in market momentum and explosive price movements to highlight profitable opportunities. Customizable Alerts:   Stay informed with notificati
TurboGain EA
Sabrina Hellal
5 (2)
TurboGain EA  //////////// Don't go to the market, let the market come to you.////////// OLD PRICE 1400$  promo price 300$ We’ve taken the ultimate leap! This major update fully integrates the 6 elite trading strategies from the powerful Quantum 6 Shadow EA directly into the core of TurboGain. Combined with advanced AI analytics and strict risk management features, this system is specifically designed to help you conquer challenges and scale with Prop Firms! Advanced Automated Expert Advi
ADX Vision
Rachid El Jaafari
Pro ADX Histogram: Visual Momentum & Trend Strength Indicator Elevate your technical analysis with ADX Histogram, an innovative MetaTrader 5 tool that transforms the classic Average Directional Index (ADX) into an intuitive, visual powerhouse. This indicator combines trend strength and momentum direction into a single, easy-to-read histogram, allowing you to assess market conditions and spot potential trading opportunities faster and with greater clarity. Trading Idea & Core Logic The indicator
FREE
Pressure Book
Rafael Melo Da Silva
Find out in real time which side, buy or sell, is putting the most pressure through a simple and efficient visualization of Depth of Market. The indicator calculates the amount of offers at the specified depths and displays the percentage on each side in relation to the total. PressureBook Indicator is fully customizable, in which you can: Select which symbol you want to track. By default, the selected symbol is the same as the graph in which the indicator was inserted; Define the amount of pri
Boom 600 Precision Spike Detector The Boom 600 Precision Spike Detector is your ultimate tool for trading the Boom 600 market with precision and confidence. Equipped with advanced features, this indicator helps you identify potential buy opportunities and reversals, making it an essential tool for traders aiming to capture spikes with minimal effort. Key Features: Non-Repainting Signals: Accurate, non-repainting signals that you can trust for reliable trading decisions. Audible Alerts: Stay on t
Fully Customizable 6 Band VWAP
Eduardo Fernando Teixeira
6-BAND VWAP (Volume Weighted Average Price) Fully customized and EA-friendly VWAP Bands Indicator. Main Features: Choose the period of VWAP calculation reset (Daily, Weekly or Monthly): For day trading use the Daily VWAP, and for longer term analysis use the Weekly or Monthly calculations. Choose how many bands (deviations) you want to show, up to 6. Choose zero to display only the main VWAP line. Fine adjustment of the deviation of the bands: Find the best band’s deviation for the instrum
RoboTick Signal
Mahir Okan Ortakoy
Hello, In this indicator, I started with a simple moving average crossover algorithm. However, in order ot get more succesfull results, I created different scenarios by basin the intersections and aptimized values of the moving averages on opening, closing, high and low values. I am presenting you with the most stable version of the moving averages that you have probably seen in any environment. We added a bit of volume into it. In my opinion, adding the Bollinger Band indicator from the ready-
이 제품의 구매자들이 또한 구매함
SuperScalp Pro
Van Minh Nguyen
5 (14)
SuperScalp Pro – 고급 다중 필터 스캘핑 인디케이터 시스템 SuperScalp Pro는 클래식 Supertrend와 여러 지능형 확인 필터를 결합한 고급 스캘핑 인디케이터 시스템입니다. 해당 인디케이터는 M1부터 H4까지 모든 타임프레임에서 효율적으로 작동하며, 특히 XAUUSD, BTCUSD 및 주요 외환 통화쌍에 적합합니다. 독립형 시스템으로 사용하거나 기존 거래 전략에 유연하게 통합할 수 있습니다. 이 인디케이터는 11개 이상의 필터를 통합하며, 빠른/느린 EMA, 추세 판별용 3개의 EMA, EMA 기울기(EMA slope), RSI, ADX, 거래량(Volume), VWAP, 볼린저 밴드 돌파(Bollinger Bands Breakout) 및 MACD 다이버전스 필터 등을 포함합니다. 스마트 캔들 필터는 캔들 종가를 확인하여 약한 신호를 제거하고, 3 EMA와 MACD 다이버전스 필터를 결합한 추세 인식 메커니즘은 더 높은 승률의 신호를 선별하는 데 도움을 줍니
Azimuth Pro
Ottaviano De Cicco
5 (6)
LAUNCH PROMO Azimuth Pro price is initially set at 299$ for the first 100 buyers. Final price will be 499$ . THE DIFFERENCE BETWEEN RETAIL AND INSTITUTIONAL ENTRIES ISN'T THE INDICATOR — IT'S THE LOCATION. Most traders enter at arbitrary price levels, chasing momentum or reacting to lagging signals. Institutions wait for price to reach structured levels where supply and demand actually shift. Azimuth Pro maps these levels automatically: swing-anchored VWAP, multi-timeframe structure lines, an
Entry In The Zone and SMC Multi Timeframe is a real-time market analysis tool developed based on Smart Money Concepts (SMC). It is designed to analyze market structure, price direction, reversal points, and key zones across multiple timeframes in a systematic way. The system displays Points of Interest (POI) and real-time No Repaint signals, with instant alerts when price reaches key zones or when signals occur within those zones. It functions as both an Indicator and a Signal System (2-in-1), c
ARICoins
Temirlan Kdyrkhan
ARICoin is a powerful trading companion designed to generate high-probability entry signals with dynamic TP/SL/DP levels based on volatility. Built-in performance tracking shows win/loss stats, PP1/PP2 hits, and success rates all updated live. Key Features: Buy/Sell signals with adaptive volatility bands Real-time TP/SL/DP levels based on ATR Built-in MA Filter with optional ATR/StdDev volatility Performance stats panel (Success, Profit/Loss, PP1/PP2) Alerts via popup, sound, push, or email Cust
Divergence Bomber
Ihor Otkydach
4.89 (85)
이 지표를 구매하신 분께는 다음과 같은 혜택이 무료로 제공됩니다: 각 거래를 자동으로 관리하고, 손절/익절 수준을 설정하며, 전략 규칙에 따라 거래를 종료하는 전용 도우미 툴 "Bomber Utility" 다양한 자산에 맞게 지표를 설정할 수 있는 셋업 파일(Set Files) "최소 위험", "균형 잡힌 위험", "관망 전략" 모드로 설정 가능한 Bomber Utility의 셋업 파일 이 전략을 빠르게 설치, 설정, 시작할 수 있도록 돕는 단계별 영상 매뉴얼 주의: 위의 모든 보너스를 받기 위해서는 MQL5 개인 메시지 시스템을 통해 판매자에게 연락해 주세요. 독창적인 커스텀 지표인 “Divergence Bomber(다이버전스 봄버)”를 소개합니다. 이 지표는 MACD 다이버전스(괴리) 전략을 기반으로 한 올인원(All-in-One) 거래 시스템입니다. 이 기술 지표의 주요 목적은 가격과 MACD 지표 간의 다이버전스를 감지하고, **향후 가격이 어느 방향으로 움직일지를 알려주는
이 지표를 구매하면 제 프로페셔널 트레이드 매니저를 무료로 드립니다. 우선 이 거래 시스템이 리페인팅, 리드로잉 및 레이그 인디케이터가 아니라는 점을 강조하는 것이 중요합니다. 이는 수동 및 로봇 거래 모두에 이상적인 것으로 만듭니다. 온라인 강좌, 설명서 및 프리셋 다운로드. "스마트 트렌드 트레이딩 시스템 MT5"은 새로운 및 경험이 풍부한 트레이더를 위해 맞춤형으로 제작된 종합적인 거래 솔루션입니다. 10개 이상의 프리미엄 인디케이터를 결합하고 7개 이상의 견고한 거래 전략을 특징으로 하여 다양한 시장 조건에 대한 다목적 선택이 가능합니다. 트렌드 추종 전략: 효과적인 트렌드 추이를 타기 위한 정확한 진입 및 손절 관리를 제공합니다. 반전 전략: 잠재적인 트렌드 반전을 식별하여 트레이더가 범위 시장을 활용할 수 있게 합니다. 스캘핑 전략: 빠르고 정확한 데이 트레이딩 및 단기 거래를 위해 설계되었습니다. 안정성: 모든 인디케이터가 리페인팅, 리드로잉 및 레이그가 아니므로 신뢰
CGE Trading Suite
Carl Gustav Johan Ekstrom
5 (1)
CGE Trading Suite delivers the analytical edge typically reserved for professional trading desks. The platform integrates a full suite of analytical tools into one seamless workflow: dynamic grid mapping, liquidity behavior analysis, ECM, trend lines, MIDAS, trade cycles, and directional channel projections. Together, these provide a unified view of market structure and momentum. Directional clarity is further enhanced by the capital flow index, which measures currency basket strength to identif
RelicusRoad Pro MT5
Relicus LLC
5 (24)
RelicusRoad Pro: 퀀트 시장 운영 체제 70% 할인 평생 이용권 (한정 시간) - 2,000명 이상의 트레이더와 함께하세요 왜 대부분의 트레이더는 "완벽한" 지표를 가지고도 실패할까요? 진공 상태에서 단일 개념 만으로 거래하기 때문입니다. 문맥 없는 신호는 도박입니다. 지속적인 승리를 위해서는 컨플루언스(중첩) 가 필요합니다. RelicusRoad Pro는 단순한 화살표 지표가 아닙니다. 완전한 퀀트 시장 생태계 입니다. 독점적인 변동성 모델링을 사용하여 가격이 이동하는 "공정 가치 로드"를 매핑하고, 단순 노이즈와 실제 구조적 돌파를 구분합니다. 추측은 그만두세요. 기관급 로드 로직으로 거래를 시작하세요. 핵심 엔진: "Road" 알고리즘 시스템의 중심에는 시장 상황에 실시간으로 적응하는 동적 변동성 채널인 Road Algo 가 있습니다. 세이프 라인(평형) 과 가격이 수학적으로 반전될 가능성이 높은 확장 레벨 을 투영합니다. Simple Road: 일반적인 시장을 위
FX Trend MT5 NG
Daniel Stein
5 (4)
FX Trend NG: 차세대 멀티 마켓 트렌드 인텔리전스 개요 FX Trend NG 는 다중 시간 프레임 기반의 전문 트렌드 분석 및 시장 모니터링 도구입니다. 몇 초 만에 전체 시장 구조를 파악할 수 있도록 설계되었습니다. 여러 차트를 일일이 전환할 필요 없이, 어떤 종목이 추세에 있는지, 어디에서 모멘텀이 약화되고 있는지, 그리고 어떤 시간 프레임이 서로 정렬되어 있는지 즉시 확인할 수 있습니다. 출시 기념 특별 혜택 – FX Trend NG 를 $30 (6개월) 또는 $80 평생 라이선스 로 이용할 수 있습니다. 이미 Stein Investments 고객이신가요? -> 메시지를 보내 전용 고객 그룹에 참여하세요. 설정이나 사용 방법이 필요하신가요? -> Stein Investments 공식 페이지 를 방문하세요. 1. FX Trend NG가 특별한 이유 3단계 추세 로직 – 단순한 Buy / Sell이 아닙니다 • 대부분의 지표는 Buy 또는 Sell 두 가지 상태만 제
Meridian Pro
Ottaviano De Cicco
5 (1)
Meridian Pro: Professional Multi-Timeframe Trend Matrix for MT5 Overview Meridian Pro is a multi-timeframe trend matrix by Merkava Labs that compresses directional state, strength, momentum condition and matrix agreement into one compact panel. One adaptive engine, applied consistently from M1 to W1. No per-symbol tuning. No indicator stacking. One structured readout across every asset and every timeframe. Launch Offer — Get Meridian Pro for USD 99 (introductory). Regular price: USD 149. 1. Why
AriX
Temirlan Kdyrkhan
1 (4)
AriX Indicator for MT5 A powerful trend-following and signal-evaluation tool AriX is a custom MT5 indicator that combines Moving Averages and ATR-based risk/reward logic to generate clear buy/sell signals. It visualizes dynamic SL/TP levels, evaluates past trade outcomes, and displays win/loss statistics in a clean on-chart panel. Key features include: Buy/Sell signals based on MA crossovers ATR-based SL/TP1/TP2/TP3 levels with visual lines and labels Signal outcome tracking with real-time stat
Atomic Analyst MT5
Issam Kassas
3.94 (31)
우선적으로 언급할 점은이 거래 지표가 다시 그리지 않고 지연되지 않으며 이를 통해 수동 및 로봇 거래 모두에 이상적이라는 점입니다. 사용자 매뉴얼: 설정, 입력 및 전략. Atomic Analyst는 가격의 강도와 모멘텀을 활용하여 시장에서 더 나은 이점을 찾는 PA Price Action Indicator입니다. 고급 필터를 장착하여 잡음과 거짓 신호를 제거하고 거래 잠재력을 높이는 데 도움이 됩니다. 복잡한 지표의 다중 레이어를 사용하여 Atomic Analyst는 차트를 스캔하고 복잡한 수학적 계산을 간단한 신호와 색상으로 변환하여 초보 트레이더가 이해하고 일관된 거래 결정을 내릴 수 있도록합니다. "Atomic Analyst"는 새로운 및 경험이 풍부한 트레이더를위한 종합적인 거래 솔루션입니다. 프리미엄 지표와 최고 수준의 기능을 하나의 거래 전략에 결합하여 모든 종류의 트레이더에 대한 다재다능한 선택지가되었습니다. 인트라데이 거래 및 스캘핑 전략 : 빠르고 정확한 일일
Meravith MT5
Ivan Stefanov
마켓 메이커를 위한 도구. Meravith는 다음과 같은 기능을 제공합니다: 모든 타임프레임을 분석하고 현재 유효한 추세를 표시합니다. 강세와 약세 거래량이 동일한 유동성 구간(거래량 균형 구간)을 강조 표시합니다. 서로 다른 타임프레임의 모든 유동성 레벨을 차트에 직접 표시합니다. 텍스트 기반 시장 분석을 생성하여 참고용으로 제공합니다. 현재 추세를 기반으로 목표가, 지지선 및 손절가를 계산합니다. 거래의 위험 대비 보상 비율(Risk/Reward)을 계산합니다. 계좌 잔고에 따라 포지션 크기를 산출하고 잠재 수익을 추정합니다. 시장에 중대한 변화가 발생할 경우 경고도 제공합니다. 지표의 주요 라인: 강세/약세 거래량 소진 라인 — 목표가로 사용됩니다. 시장 추세를 나타내는 라인. 시장이 강세인지 약세인지에 따라 색상이 변경되며 추세 지지선 역할을 합니다. 색상은 주로 시장 심리를 보여줍니다. 거래량 균형선(Eq). Eq(Volume Equilibrium) 라인은 시스템의 핵심입니
FX Power MT5 NG
Daniel Stein
5 (31)
FX Power: 통화 강세 분석으로 더 스마트한 거래 결정을 개요 FX Power 는 어떤 시장 상황에서도 주요 통화와 금의 실제 강세를 이해하기 위한 필수 도구입니다. 강한 통화를 매수하고 약한 통화를 매도함으로써 FX Power 는 거래 결정을 단순화하고 높은 확률의 기회를 발견합니다. 트렌드를 따르거나 극단적인 델타 값을 사용해 반전을 예측하고자 한다면, 이 도구는 귀하의 거래 스타일에 완벽히 적응합니다. 단순히 거래하지 말고, FX Power 로 더 스마트하게 거래하세요. 1. FX Power가 거래자에게 매우 유용한 이유 통화와 금의 실시간 강세 분석 • FX Power 는 주요 통화와 금의 상대적 강세를 계산하고 표시하여 시장 역학에 대한 명확한 통찰력을 제공합니다. • 어떤 자산이 앞서고 있고 어떤 자산이 뒤처지는지 모니터링하여 보다 현명한 거래 결정을 내릴 수 있습니다. 포괄적인 멀티 타임프레임 뷰 • 단기, 중기 및 장기 타임프레임에서 통화와 금의 강세를
OmniSync Projection
Antonio-alin Teculescu
5 (1)
Chronos Fractal Engine is an innovative price projection indicator for MetaTrader 5, designed to transform your technical analysis by intelligently identifying and projecting historical price patterns. Built upon an advanced correlation algorithm and the fractal principles of the market, this powerful tool visualizes potential future price movements, giving you a unique edge in your trading decisions. What is Chronos Fractal Engine? At its core, the Chronos Fractal Engine employs a sophisticat
Currency Strength Dashboard Pro
Anastasia Danilova
5 (1)
Currency Strength Dashboard Pro MetaTrader 5 를 위한 실시간 통화 강도 분석 전문 대시보드 입니다. 이 지표는 8개의 주요 통화 (EUR, USD, GBP, JPY, CHF, AUD, CAD, NZD)의 강도를 계산하고, 28개의 통화쌍 을 동시에 여러 시간 프레임에서 분석하여 표시합니다. 이 대시보드는 트레이더가 추가 계산이나 여러 차트 간 전환 없이 한눈에 시장 전체 상황을 파악 할 수 있도록 해줍니다. 계산 방법 이 지표는 고급 수학적 통화 강도 분석 방법 을 기반으로 합니다. 이는 유사한 지표에서 널리 사용되는 RSI 기반 방법 보다 더 정확하고 객관적인 결과를 제공합니다. 이 방법은 28개의 모든 통화쌍 간의 관계를 동시에 분석 하여 시장에서 실제로 형성되는 힘의 균형을 보다 명확하고 편향 없이 보여줍니다. 실시간 대시보드 메인 테이블에는 8개의 통화 에 대한 전체 데이터가 표시됩니다. Rank (순위) — 전체 강도 기준 통화 순위, 1
Grabber System MT5
Ihor Otkydach
4.83 (23)
탁월한 기술적 지표인 Grabber를 소개합니다. 이 도구는 즉시 사용 가능한 “올인원(All-Inclusive)” 트레이딩 전략으로 작동합니다. 하나의 코드 안에 강력한 시장 기술 분석 도구, 매매 신호(화살표), 알림 기능, 푸시 알림이 통합되어 있습니다. 이 인디케이터를 구매하신 모든 분들께는 다음의 항목이 무료로 제공됩니다: Grabber 유틸리티: 오픈 포지션을 자동으로 관리하는 도구 단계별 영상 매뉴얼: 설치, 설정, 그리고 실제 거래 방법을 안내 맞춤형 세트 파일: 인디케이터를 빠르게 자동 설정하여 최고의 성과를 낼 수 있도록 도와줍니다 다른 전략은 이제 잊어버리세요! Grabber만이 여러분을 새로운 트레이딩의 정점으로 이끌어 줄 수 있습니다. Grabber 전략의 주요 특징: 거래 시간 프레임: M5부터 H4까지 거래 가능한 자산: 어떤 자산이든 사용 가능하지만, 제가 직접 테스트한 종목들을 추천드립니다 (GBPUSD, GBPCAD, GBPCHF, AUDCAD, AU
Bill Williams Advanced
Siarhei Vashchylka
5 (11)
Bill Williams Advanced is designed for automatic chart analysis using Bill Williams' "Profitunity" system. The indicator analyzes four timeframes at once. Manual (Be sure to read before purchasing) Advantages 1. Analyzes the chart using Bill Williams' "Profitunity" system. Signals are displayed in a table in the corner of the screen and on the price chart. 2. Finds all known AO and AC signals, as well as zone signals. Equipped with a trend filter based on the Alligator. 3. Finds "Divergence Bar
Quantum TrendPulse
Bogdan Ion Puscasu
5 (22)
SuperTrend   ,   RSI   ,   Stochastic   의 힘을 하나의 포괄적인 지표로 결합하여 트레이딩 잠재력을 극대화하는 궁극의 트레이딩 도구   인 Quantum TrendPulse를   소개합니다. 정밀성과 효율성을 추구하는 트레이더를 위해 설계된 이 지표는 시장 추세, 모멘텀 변화, 최적의 진입 및 종료 지점을 자신 있게 식별하는 데 도움이 됩니다. 주요 특징: SuperTrend 통합:   주요 시장 추세를 쉽게 따라가고 수익성의 물결을 타세요. RSI 정밀도:   매수 과다 및 매도 과다 수준을 감지하여 시장 반전 시점을 파악하는 데 적합하며 SuperTrend 필터로 사용 가능 확률적 정확도:   변동성이 큰 시장에서 숨겨진 기회를 찾기 위해 확률적 진동   을 활용하고 SuperTrend의 필터로 사용 다중 시간대 분석:   M5부터 H1 또는 H4까지 다양한 시간대에 걸쳐 시장을 최신 상태로 유지하세요. 맞춤형 알림:   맞춤형 거래 조건이 충족되면
소개       Quantum Breakout PRO   , 브레이크아웃 존 거래 방식을 변화시키는 획기적인 MQL5 지표! 13년 이상의 거래 경험을 가진 숙련된 트레이더 팀이 개발한       퀀텀 브레이크아웃 PRO       혁신적이고 역동적인 브레이크아웃 존 전략으로 거래 여정을 새로운 차원으로 끌어올리도록 설계되었습니다. Quantum Breakout Indicator는 5개의 이익 목표 영역이 있는 브레이크아웃 영역의 신호 화살표와 브레이크아웃 상자를 기반으로 한 손절 제안을 제공합니다. 초보자 거래자와 전문 거래자 모두에게 적합합니다. Quantum EA 채널:       여기를 클릭하세요 중요한! 구매 후 설치 매뉴얼을 받으려면 개인 메시지를 보내주십시오. 추천: 기간: M15 통화쌍: GBPJPY, EURJPY, USDJPY,NZDUSD, XAUUSD 계정 유형: 스프레드가 매우 낮은 ECN, Raw 또는 Razor 브로커 시간: GMT +3 중개인 :
Trend Screener Pro MT5
STE S.S.COMPANY
4.84 (102)
트렌드 표시기, 트렌드 트레이딩 및 필터링을 위한 획기적인 고유 솔루션, 하나의 도구 안에 내장된 모든 중요한 트렌드 기능! Forex, 상품, 암호 화폐, 지수 및 주식과 같은 모든 기호/도구에 사용할 수 있는 100% 다시 칠하지 않는 다중 시간 프레임 및 다중 통화 표시기입니다. Trend Screener는 차트에 점이 있는 화살표 추세 신호를 제공하는 효율적인 지표 추세 추종 지표입니다. 추세 분석기 표시기에서 사용할 수 있는 기능: 1. 트렌드 스캐너. 2. 최대 이익 분석이 있는 추세선. 3. 추세 통화 강도 측정기. 4. 경고가 있는 추세 반전 점. 5. 경고가 있는 강력한 추세 점. 6. 추세 화살표 Trend Screener Indicator가 있는 일일 분석 예, 일일 신호 성능...등은 여기에서 찾을 수 있습니다. 여기를 클릭하십시오. LIMITED TIME OFFER : Trend Screener Indicator는 50$ 및 평생 동안만 사용할 수 있습니다.
Crystal Heikin Ashi Signals
Muhammad Jawad Shabir
5 (1)
Crystal Heikin Ashi Signals - Professional Trend & Signal Detection Indicator Advanced Heikin Ashi Visualization with Intelligent Signal System for Manual & Automated Trading Final Price: $149 ---------> Price goes up $10 after every 10 sales . Limited slots available — act fast . Overview Crystal Heikin Ashi Signals is a professional-grade MetaTrader 5 indicator that combines pure Heikin Ashi candle visualization with an advanced momentum-shift detection system. Designed for both manual traders
Trend Forecaster
Alexey Minkov
5 (7)
The Trend Forecaster indicator utilizes a unique proprietary algorithm to determine entry points for a breakout trading strategy. The indicator identifies price clusters, analyzes price movement near levels, and provides a signal when the price breaks through a level. The Trend Forecaster indicator is suitable for all financial assets, including currencies (Forex), metals, stocks, indices, and cryptocurrencies. You can also adjust the indicator to work on any time frames, although it is recommen
Advanced Supply Demand MT5
Bernhard Schweigert
4.53 (15)
현재 33% 할인! 초보자나 전문 트레이더를 위한 최고의 솔루션! 이 보조지표는 우리가 다수의 독창적 기능과 새로운 공식을 통합한 독특하고 고품질이며 저렴한 거래 도구입니다. 이 업데이트를 통해 이중 시간대를 표시할 수 있습니다. 더 높은 TF를 표시할 수 있을 뿐만 아니라 차트 TF와 더 높은 TF 모두를 표시할 수 있습니다: 중첩 영역 표시. 모든 Supply Demand 트레이더들이 좋아할 것입니다. :) 중요한 정보 공개 Advanced Supply Demand의 잠재력을 극대화하려면 다음을 방문하십시오. https://www.mql5.com/ko/blogs/post/720245   진입 또는 목표의 명확한 트리거 포인트를 정확히 찾아냄으로 해서 거래가 어떻게 개선될지 상상해 보십시오. 새로운 알고리즘을 기반으로 매수자와 매도자 간의 잠재적인 불균형을 훨씬 더 쉽게 분간할 수 있습니다. 왜냐하면 가장 강한 공급영역과 가장 강한 수요 영역과 과거에 어떻게 진행 되었는지를(이전
RFI levels PRO MT5
Roman Podpora
3.67 (3)
이 지표는 추세 반전 지점과 가격 반등 영역을 정확하게 보여줍니다.       주요 투자자들   . 새로운 트렌드가 형성되는 곳을 파악하고 최대한 정확하게 의사결정을 내리며 모든 거래를 완벽하게 통제합니다. TREND LINES PRO   지표와 함께 사용할 때 최대의 잠재력을 발휘합니다.  VERSION MT4 지표가 보여주는 내용: 새로운 추세의 시작 시 활성화되는 반전 구조 및 반전 수준. 최소한의 위험 대비 수익률을 갖는 이익 실현   (TAKE PROFIT)   및   손절매(STOP LOSS)   레벨 표시       RR 1:2   . 지능형 손실 감소 로직이 적용된 손절매 기능. 지정된 지표에서 두 가지 추세 유형에 대한 반전 패턴을 표시합니다. 지표: 트렌드를 따라   트렌드 라인 프로   (글로벌 트렌드 변화) 트렌드 프로   (빠른 트렌드 변화) 간단하고 효과적입니다       스캐너       실시간 추세 (신규). 다중 시간 프레임 도구 필터링. 표시하다  
Matrix Arrow Indicator MT5
Juvenille Emperor Limited
5 (19)
매트릭스 화살표 표시기 MT5 는 외환, 상품, 암호 화폐, 지수, 주식과 같은 모든 기호/도구에 사용할 수 있는 100% 다시 칠하지 않는 다중 기간 표시기를 따르는 고유한 10 in 1 추세입니다.  Matrix Arrow Indicator MT5 는 다음과 같은 최대 10개의 표준 지표에서 정보와 데이터를 수집하여 초기 단계에서 현재 추세를 결정합니다. 평균 방향 이동 지수(ADX) 상품 채널 지수(CCI) 클래식 하이켄 아시 캔들 이동 평균 이동 평균 수렴 발산(MACD) 상대 활력 지수(RVI) 상대 강도 지수(RSI) 포물선 SAR 스토캐스틱 오실레이터 윌리엄스의 백분율 범위 모든 지표가 유효한 매수 또는 매도 신호를 제공하면 강력한 상승/하락 추세를 나타내는 다음 캔들/막대가 시작될 때 해당 화살표가 차트에 인쇄됩니다. 사용자는 사용할 표시기를 선택하고 각 표시기의 매개변수를 개별적으로 조정할 수 있습니다. 매트릭스 화살표 표시기 MT5는 선택한 표시기에서만 정보를 수
Gann Made Easy 는 mr.의 이론을 사용하여 최고의 거래 원칙을 기반으로 하는 전문적이고 사용하기 쉬운 Forex 거래 시스템입니다. W.D. 간. 이 표시기는 Stop Loss 및 Take Profit Levels를 포함하여 정확한 BUY 및 SELL 신호를 제공합니다. PUSH 알림을 사용하여 이동 중에도 거래할 수 있습니다. 구매 후 거래 방법 안내 및 유용한 추가 지표를 무료로 받으시려면 저에게 연락주세요! 아마도 Gann 거래 방법에 대해 이미 여러 번 들었을 것입니다. 일반적으로 Gann의 이론은 초보자 거래자뿐만 아니라 이미 거래 경험이 있는 사람들에게도 매우 복잡한 것입니다. Gann의 거래 방식은 이론적으로 적용하기 쉽지 않기 때문입니다. 나는 그 지식을 연마하고 Forex 지표에 최고의 원칙을 적용하기 위해 몇 년을 보냈습니다. 표시기는 적용하기가 매우 쉽습니다. 차트에 첨부하고 간단한 거래 권장 사항을 따르기만 하면 됩니다. 지표는 지속적으로 시장 분석
Gold Sniper Scalper Pro
Ich Khiem Nguyen
3.78 (9)
Gold Sniper Scalper Pro는 XAUUSD에서 허위 돌파 (false breakout) 패턴을 감지하기 위해 특별히 설계된 MetaTrader 5 지표입니다. 가격이 레인지 경계를 돌파하여 돌파 트레이더를 유인한 후 반전하는 4봉 트랩 구조를 식별합니다. 지표는 각 셋업을 17개 품질 요소로 평가하고, 4계층 합류 파이프라인을 통해 처리하며, 7타임프레임 추세 합의 엔진으로 검증하고, 금 변동성 상태 분류기로 필터링합니다. 이 모든 과정이 신호가 차트에 표시되기 전에 완료됩니다. 자세한 사용자 가이드는 작성자의   MQL5 블로그 에서 확인할 수 있습니다. 추가 업데이트는 작성자의   MQL5 채널 을 통해 제공됩니다. 현재 지원 정책에 따라 구매자는 저자가 개발한 선별된 보조 도구에 대한 추가 접근 권한을 받을 수 있습니다. Forex 쌍, 지수 및 암호화폐에서도 작동하지만, 감지 매개변수, 변동성 처리 및 필터 로직은 XAUUSD 특성에 최적화되어 있습니다.
ARIPoint
Temirlan Kdyrkhan
ARIPoint is a powerful trading companion designed to generate high-probability entry signals with dynamic TP/SL/DP levels based on volatility. Built-in performance tracking shows win/loss stats, PP1/PP2 hits, and success rates all updated live. Key Features: Buy/Sell signals with adaptive volatility bands Real-time TP/SL/DP levels based on ATR Built-in MA Filter with optional ATR/StdDev volatility Performance stats panel (Success, Profit/Loss, PP1/PP2) Alerts via popup, sound, push, or email Cu
Btmm state engine pro
Garry James Goodchild
5 (3)
Get the user guide here  https://g-labs.software/guides/BTMM_State_Engine_Welcome_Pack.html BTMM State Engine Pro — the   all-in-one Banks   & Institutions Market Maker indicator for Meta Trader 5. Built for   BTMM traders who follow the Asian   session breakout methodology with Kill Zone timing , level stacking, peak formation detection , and multi-pair scanning — all   from a single chart. Combines   a full BTMM State Engine   with a built-in multi-pair Scanner dashboard, eliminating the need
제작자의 제품 더 보기
Fibonacci Auto Levels Pro MT5 – 되돌림, 확장 및 피봇 포인트 (Pivot Points) Fibonacci Auto Levels Pro MT5는 시장의 스윙 포인트를 자동으로 감지하고 차트에 완전한 피보나치 되돌림 (Retracement), 확장 (Extension) 및 피봇 포인트 (Pivot Point) 구조를 그리는 고급 기술 분석 도구입니다. 이 지표는 여러 독립적인 시스템을 하나의 통합된 분석 도구로 결합합니다. 피봇 포인트 (피보나치 모드) 피봇 포인트는 이전 기간의 가격 범위를 기반으로 잠재적인 지지 및 저항 영역을 식별하는 데 사용됩니다. 이 지표는 이전 고가 (High), 저가 (Low), 종가 (Close)에 피보나치 비율을 적용하여 계산되는 피보나치 피봇 포인트 를 사용합니다. 피봇 포인트의 시간대는 수동으로 설정하거나 다음 로직을 사용하여 자동으로 설정할 수 있습니다. 일중 거래 ≤ 5분 → 4시간 5–45분 → 1일 45분–4시간 →
Ultimate MACD MTF Pro 는 고전적인 MACD의 강력한 업그레이드 버전으로, 현대 트레이딩을 위해 재설계되었습니다. 이 지표는 멀티 타임프레임(MTF) MACD, 다이내믹 히스토그램 색상, 신호 교차 마커, 모멘텀 기반의 스마트 라인 색상 변경 기능을 제공합니다. 깔끔한 신호, 조기 추세 감지 및 전문적인 시각적 명확성을 원하는 트레이더를 위해 제작되었습니다. 주요 기능 멀티 타임프레임 MACD (MTF) 현재 차트 타임프레임 또는 상위 타임프레임(H1, H4, D1 등) 간에 쉽게 전환할 수 있습니다. 탑다운(Top-down) 추세 확인에 매우 적합합니다. 깔끔한 MACD 및 신호선 – 라인 두께 조절 가능 – MACD가 신호선을 교차할 때 자동 색상 변경 – 부드럽고 시각적으로 명확한 디자인 5가지 색상 스마트 히스토그램 히스토그램은 다음 조건에 따라 5가지 색상으로 변경됩니다: 모멘텀 증가 모멘텀 감소 0선 위 또는 아래 추세 전
FREE
이치모쿠 다층 트렌드 오실레이터 프로 (Ichimoku Multi-Layer Trend Oscillator Pro) 이치모쿠 다층 트렌드 오실레이터 프로는 이치모쿠(Ichimoku) 계산을 네 가지 강력한 오실레이터 레이어로 변환하는 고급 추세 읽기 및 진입/청산 시스템입니다. 이 레이어들은 추세 강도, 모멘텀, 그리고 가장 안전한 진입/청산 지점을 명확하게 시각적으로 보여줍니다. 이 지표는 또한 완벽한 거래 결정 세트를 형성하기 위해 선택적 RSI , MACD , EMA , 및 ATR 확인을 포함합니다. 고유한 다층 오실레이터 구조 이 시스템은 가격 움직임의 다른 측면을 나타내는 네 가지 이치모쿠 기반 오실레이터 레이어 를 생성합니다: 1️⃣ 첫 번째 레이어 – 가격과 구름의 거리: 종가와 이치모쿠 구름 사이의 거리를 측정합니다 (주요 추세 방향에 따라 최소 또는 최대). 진행 중인 추세의 강도를 식별하는 데 도움이 됩니다. 2️⃣ 두 번째 레이어 – 지연 스팬 vs 구름:
FREE
RSI 볼린저 밴드 화살표 전략 (RSI Bollinger Bands Arrow Strategy) RSI 볼린저 밴드 화살표 전략은 RSI와 볼린저 밴드의 조합을 사용하여 높은 확률의 반전 지점을 식별하도록 설계된 깔끔하고 효과적인 기술 지표입니다. 이 전략은 RSI 지표를 볼린저 밴드와 함께 사용하여 다음을 수행합니다. 가격이 볼린저 밴드 상단 위에 있을 때 매도합니다. 가격이 볼린저 밴드 하단 아래에 있을 때 매수합니다. 두 지표가 동일한 시장 상황을 동시에 확인할 때만 신호가 생성되어 정확도를 높이고 잘못된 진입을 줄입니다. 작동 방식 매수 신호: 가격이 볼린저 밴드 하단 아래에서 위로 교차합니다. RSI가 정의된 과매도 수준을 위로 교차합니다. 차트에 녹색 매수 화살표가 나타납니다. 매도 신호: 가격이 볼린저 밴드 상단 위에서 아래로 교차합니다. RSI가 정의된 과매수 수준을 아래로 교차합니다. 차트에 빨간색 매도 화살표가 나타납니다. 이 간단한 전략은 RSI와
Breakout Finder Pro MT5 는 동적 지지 및 저항 구조를 기반으로 높은 확률의 시장 움직임을 식별하도록 설계된 강력하고 정밀한 돌파(Breakout) 감지 지표입니다. 이 지표는 고급 피벗 기반 로직을 사용하여 횡보 구간(Consolidation zones)을 자동으로 감지하고, 확인된 상방 돌파(불리시) 및 하방 이탈(베어리시)을 표시합니다. 차트에 깔끔한 브레이크아웃 박스를 직접 그려주며 실시간 알림을 제공하여 기회를 놓치지 않게 도와줍니다. 확인 후 조기 진입을 원하는 트레이더를 위해 제작된 이 도구는 신호를 보내기 전 주요 레벨에 대한 여러 차례의 테스트를 거치도록 설계되어 가짜 돌파(False breakout)를 필터링합니다. 주요 기능 상방 돌파 및 하방 이탈 구역 자동 감지 스마트 피벗 기반 구조 분석 동적 지지 및 저항(레벨) 시각적 브레이크아웃 박스(채널 스타일 구역) 확인 후 리페인팅 없는(Non-repainting) 신호
MACD SMA Pro Trend Signal MT5 는 추세 분석, 모멘텀 확인 및 구조적 필터링을 결합하여 고확률 시장 진입 시점을 식별하도록 설계된 전문가급 트레이딩 지표입니다. 정교화된 MACD + Multi-SMA 전략을 기반으로 제작된 이 도구는 추세 방향, 모멘텀 변화, 가격 구조 및 확인 로직 을 하나의 깔끔하고 강력한 시스템으로 결합함으로써 기존 지표의 한계를 뛰어넘습니다. 노이즈가 심하거나 신호가 늦게 발생하는 일반적인 지표와 달리, 이 시스템은 약한 셋업을 걸러내고 고품질 돌파 및 반전 기회 에만 집중합니다. 추세 방향을 시각적으로 강조하고, 모멘텀 변화를 감지하며, 다층 조건을 사용하여 진입을 확정합니다. 낮은 타임프레임에서의 빠른 스캘핑이든 스윙 포지션 유지든, 이 지표는 귀하의 트레이딩 스타일에 적응하여 명확하고 실행 가능한 신호 를 제공합니다. 추측 배제 차트 혼란 제거 오직 깔끔하고 스마트한 트레이딩 신호 4. 주요 특징 다층 SMA 로직을
필터:
리뷰 없음
리뷰 답변