AstroMap

AstroCycles: Advanced Financial Astronomy Indicator

Overview

AstroCycles is a sophisticated technical analysis tool developed for the MetaTrader 4 (MQL4) platform. It bridges the gap between orbital mechanics and financial market analysis by calculating precise astronomical cycles and visualizing them directly on your trading chart.

Unlike standard indicators that rely on past price data, AstroMaster utilizes high-precision astronomical algorithms (Keplerian Elements and Brown’s Lunar Theory) to determine the exact position of celestial bodies. It identifies critical cosmic events—such as planetary retrogrades, zodiac changes, and lunar phases—that are often correlated with market turning points, volatility, and trend reversals.

This tool operates entirely within the terminal (Native MQL4) without requiring external libraries or internet connectivity, ensuring speed, privacy, and reliability.

Key Features

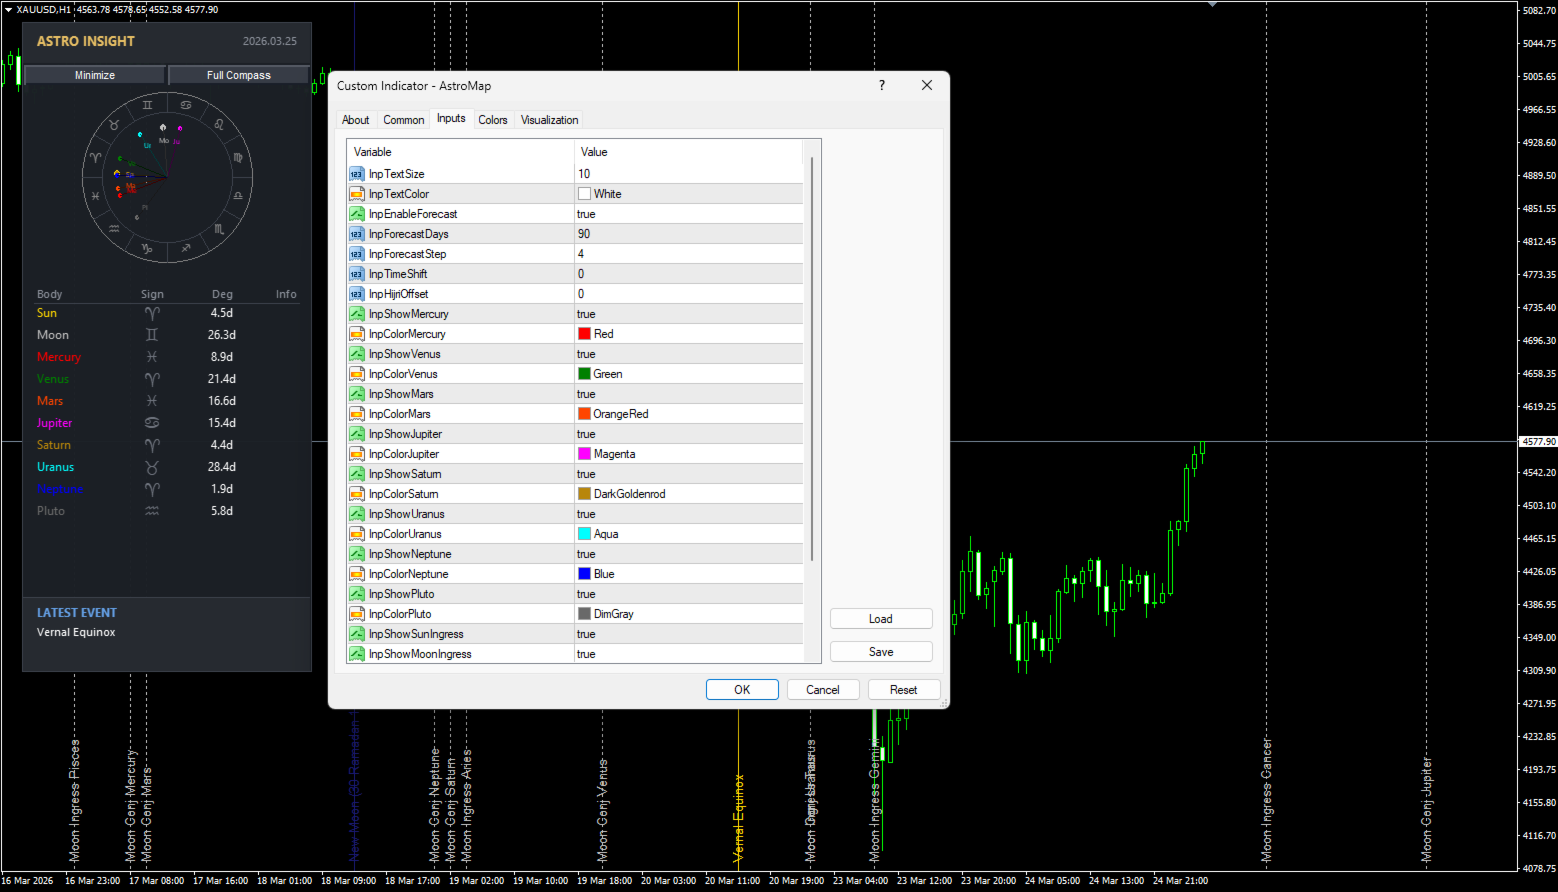
1. Comprehensive Planetary Tracking

The indicator tracks the movement of major celestial bodies from  Mercury to Pluto, including the Sun and Moon. It monitors their geocentric positions and alerts the trader to specific events:

  • Zodiac Ingress: Marks the exact moment a planet moves from one Zodiac sign to another (e.g., Mars entering Taurus). This is often interpreted as a shift in market "sentiment" or energy.

  • Retrograde Motion: Identifies when a planet appears to move backward in the sky (Retrograde) and when it returns to forward motion (Direct). These periods are historically associated with market corrections or reversals.

  • Sun Conjunctions: Highlights moments when a planet aligns perfectly with the Sun.

2. Advanced Lunar & Hijri Analysis

AstroMaster provides a deep dive into lunar cycles, which are essential for short-term market timing:

  • Moon Phases: Clearly marks  New Moon and  Full Moon phases.

  • Hijri Calendar Integration: Unique to this tool, it calculates and displays the estimated  Hijri (Islamic) Date for every lunar event, aiding traders who follow lunar-based calendar cycles.

  • Eclipse Detection: Automatically detects and highlights  Solar and Lunar Eclipses with distinct visual markers, signaling potential high-volatility windows.

  • Moon-Planet Conjunctions: Identifies when the Moon aligns with other planets (e.g., Moon conjunct Jupiter).

3. Solar Events & Seasonality

The indicator tracks the Earth's relationship with the Sun to identify major seasonal shifts:

  • Equinoxes: Vernal (Spring) and Autumnal Equinoxes.

  • Solstices: Summer and Winter Solstices.

  • These events are significant for long-term commodity and index traders as they mark seasonal transition points.

4. Predictive Forecasting Module

AstroMaster does not just analyze the past; it projects into the future.

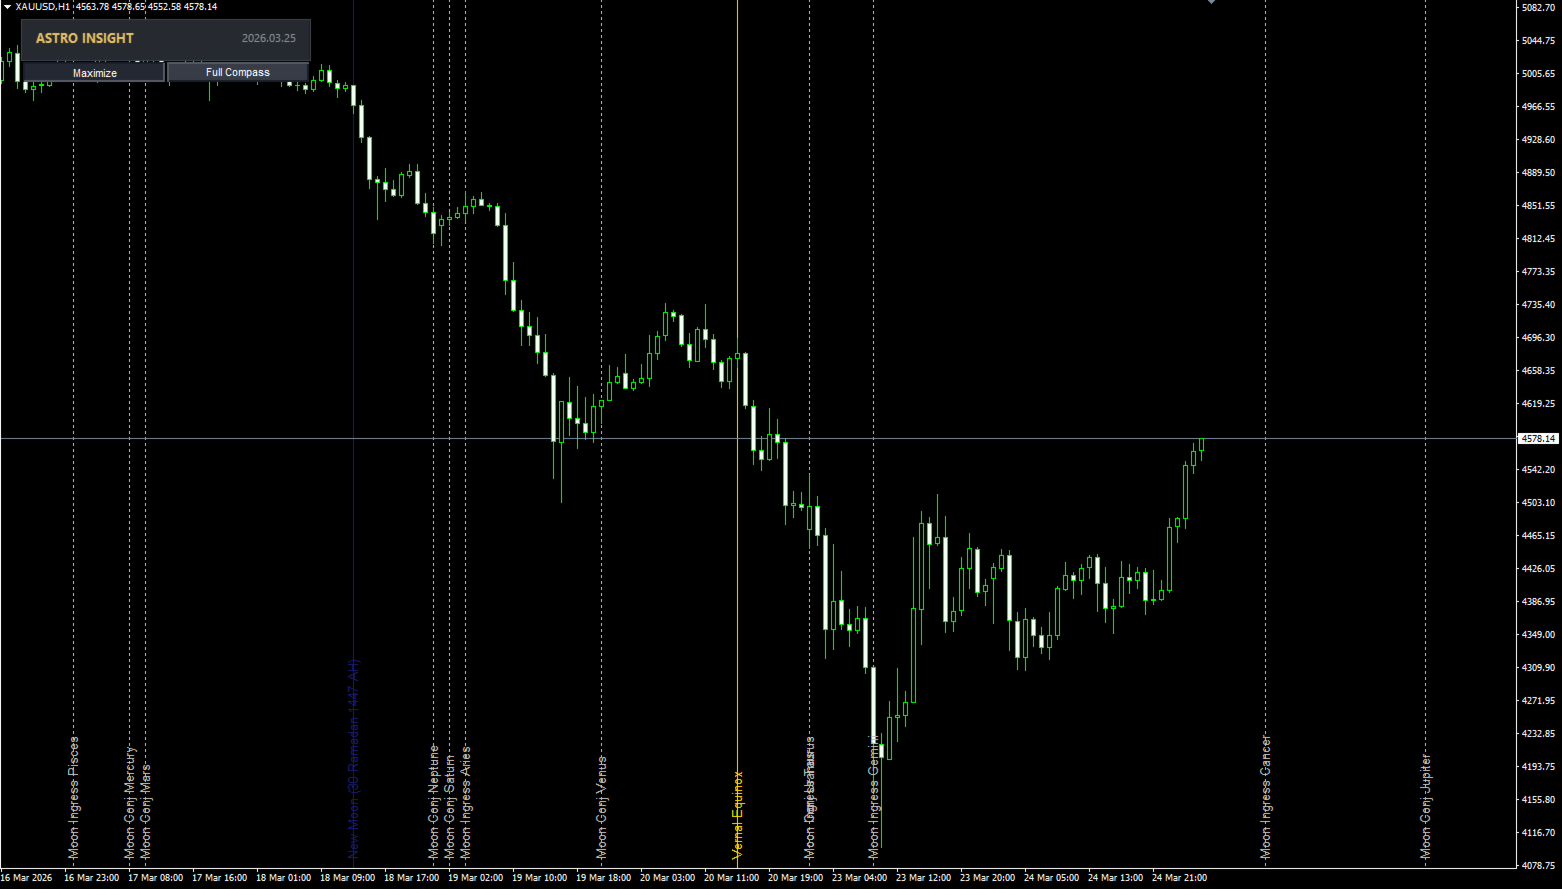
  • Future Cycle Projection: The indicator draws vertical lines into the empty space on the right side of the chart (up to 90 days ahead).

  • Strategic Planning: This allows traders to anticipate upcoming time clusters and potential turning points before price action arrives.

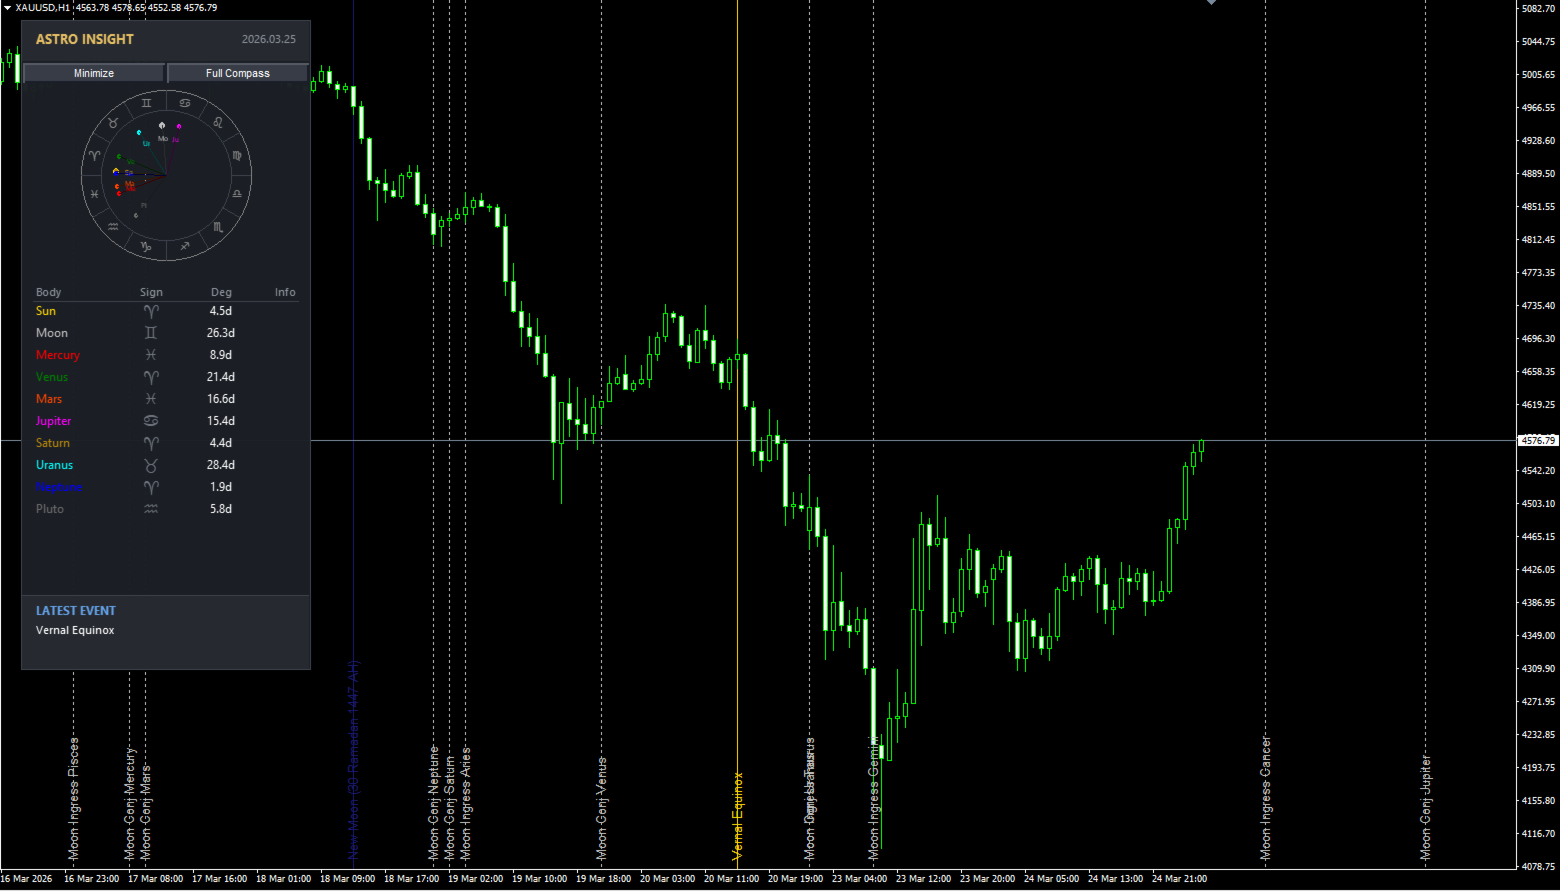
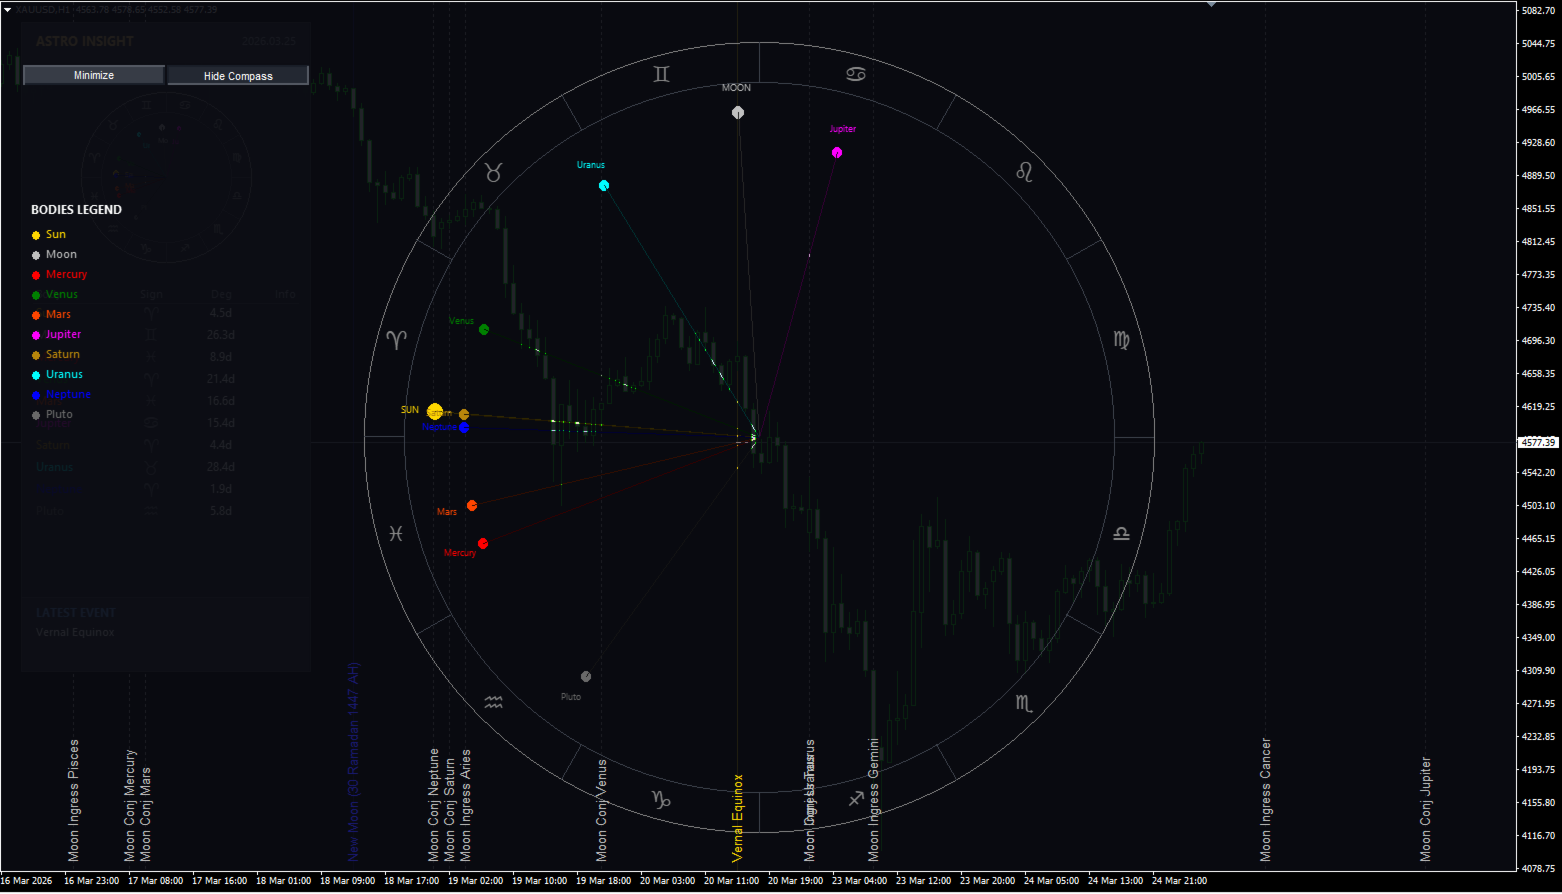
5. Modern Information Dashboard

A sleek, semi-transparent dashboard is displayed on the chart, providing a real-time "Cockpit View" of the cosmos:

  • Real-Time Position: Displays the current Zodiac sign and exact degree for the Sun, Moon, and all planets.

  • Retrograde Status: Instantly flags planets currently in retrograde motion with a distinct  [R] marker.

  • Momentum Tracker: A dedicated footer section displays the most recent astronomical event that occurred, ensuring you never miss a signal.

6. Optimized User Experience

  • Vertical Labels: Every line on the chart includes a vertical text label describing the event (e.g.,  "Mercury Ingress Aries"), making the chart easy to read without hovering.

  • Dynamic Rendering: The system uses smart optimization to only draw objects currently visible on the screen. This ensures the chart remains fast and responsive, even when zooming, scrolling, or switching timeframes.

How to Use

  1. Installation: Place the indicator in your MQL5 Indicators folder and the library in the Include folder.

  2. Visualization: Attach it to any chart (Forex, Crypto, Stocks, Commodities).

  3. Navigation: Enable "Chart Shift" (the arrow icon in the toolbar) to see the  Future Forecast lines in the empty space to the right.

  4. Analysis: Look for clusters of lines (multiple astronomical events happening closely together). These clusters often indicate high-probability time windows for market reversals or increased volatility.


추천 제품
Cool volumes
Yerzhan Satov
화살표 표시기"쿨 볼륨"은 틱 볼륨을 기반으로합니다. 표시기 자체는 특정 기간(기간 선택)에 구매 또는 판매 할 볼륨 수를 추적합니다. 판매자 또는 구매자의 볼륨의 비정상적인 초과가있을 때,그것은 판매 또는 구매 신호를 제공합니다. 색상 히스토그램은 아래 창에 그려져 있는데,녹색은 현재 구매자의 우위를 나타냅니다.이는 이 가격 범위에서 증가할 수 있는 잠재적 즉각적인 반전을 의미합니다. 반대로 붉은 색은 판매자의 우위를 나타내며 이는 잠재적 인 즉각적인 하향 반전을 의미합니다. 또한 시각적 인식의 편의를 위해 주 차트 창에 화살표가 직접 추가되었습니다. 사용자의 편의를 위해 외부 변수에는 신호의 주파수와 히스토리(히스토리 바)에 대한 설정 변수가 포함되어 있습니다. 그러나 값을 1000 이상으로 설정하지 않는 것이 좋습니다. 이 더 터미널의 성능이 느려집니다. 또한"===<<화살표 설정>>>==="섹션에서 화살표 및 히스토그램 매개 변수를 직접 설정할 수 있습니다. 히스토
Rira Renko
Vitor Palmeira Abbehusen
RENKO on Time Chart This indicator is an enhanced Renko, so you can watch the Renko bricks on the chart to understand price movement more clearly the other improvement is automated box size according to ATR (Average True Range) period you can set the ATR number as you want and the box size of Renko changes automatically based on price movement Inputs Mode: Box size is the input to specify the size of the Renko box you want to print on the chart. This input lets you choose the fixed box siz
MT4용 Crypto_Forex 지표 "추세 진입 히스토그램", 리페인트 없음. - 추세 진입 히스토그램 지표는 Entry_bar가 나타나면 추세 방향 진입 신호를 찾는 데 사용할 수 있습니다. - 이 지표는 가격과 거래량을 모두 고려하여 계산하는 고유한 특징을 가지고 있습니다. - 추세 진입 히스토그램은 두 가지 색상으로 제공됩니다. 빨간색은 약세 추세, 파란색은 강세 추세입니다. - 안정적인 추세(동일한 색상의 히스토그램 막대가 최소 10개 연속 표시)가 나타나면 Entry_bar가 표시될 때까지 기다리세요. - 진입 신호는 히스토그램에서 반대 색상의 열 하나와 초기 추세 색상의 다음 열입니다(그림 참조). - 숏 목표가를 사용하세요. 현재 추세에 따라 차트에서 가장 가까운 고가/저가를 사용하세요. - 지표에는 모바일 및 PC 알림 기능이 내장되어 있습니다. 사용 방법: - 매수 신호: 안정적인 강세 추세(파란색 히스토그램 막대) + 히스토그램의 빨간색 막대 1개 + 파란색
TimeToBarEnd
Ilia Stavrov
Indicator "Time to Bar End" (TimeToBarEnd) This technical indicator is designed to accurately track the time remaining until the current candle closes on the chart. It displays a countdown in minutes:seconds format, which is particularly useful for intraday traders and scalpers who need to know the exact closing time of the current candle. The indicator updates in real-time and offers flexible customization of its appearance. The settings include: choice of position from four chart corners, adj
FREE
Graphic shapes
Alexandr Lapin
5 (1)
Graphic Shapes -using history, it projects four types of graphical shapes at the moment, allowing you to determine the main ranges of price movement in the future, as well as gives an understanding of the main market reversals, while giving entry points by priority!The panel contains three types of figure sizes expressed by timeframes. They allow you to conduct a complete market analysis without using additional tools! The indicator is a powerful tool for forecasting price movements in the forex
FREE
Power Renko MT4
Pierce Vallieres
Power Renko is an indicator which plots Renko bricks underneath the chart using a histogram. You can select the brick size and the timeframe of the Renko bricks as well as whether or not to use the close price or the high/low price of the candles. Renko bricks are based on price alone, not time, therefor the Renko bricks will not be aligned with the chart's time. They are extremely useful for trend trading and many different strategies can be formed from them. Buffers are provided allowing you t
Introduction It is common practice for professional trades to hide their stop loss / take profit from their brokers. Either from keeping their strategy to the themselves or from the fear that their broker works against them. Using this indicator, the stop loss / take profit points will be drawn on the product chart using the bid price. So, you can see exactly when the price is hit and close it manually.  Usage Once attached to the chart, the indicator scans the open orders to attach lines for t
Full Forex Market View Dashboard
Opengates Success International
5 (2)
전체 외환 시장 보기 대시보드 표시기 이것은 거래자에게 시장에서 일어나는 일에 대한 전체 보기를 제공하기 위해 만들어진 사용자 지정 지표입니다. 실시간 데이터를 사용하여 시장에 액세스하고 성공적인 거래에 필요한 모든 정보를 표시합니다. 설치: 이 지표를 창 차트에 첨부하기 전에 MT4의 Market Watch 패널로 이동하여 필요하지 않거나 거래하지 않는 모든 통화 쌍을 숨기고 나머지는 그대로 두십시오. 그 이유는 FFMV 대시보드가 MT4의 Market Watch에 나타나는 모든 통화 쌍을 표시하기 때문입니다. 최대 30개 이하의 통화 쌍을 표시할 수 있습니다. MT4의 Market Watch에서 그 이상이면 FFMV 대시보드의 글꼴과 이미지가 흐려지고 변형됩니다! 제대로 표시되지 않습니다. 용법:      솔로 트레이딩      바구니 거래의 경우(방법에 대한 스크린샷 참조)      다중 주문 거래에도 사용할 수 있습니다.      자신의 거래 시스템 등에서 수신한 신
Mr Pip Scalping Indicator is a momentum indicator that measures the magnitude of recent price changes to evaluate overbought or oversold conditions in the price of a stock or other asset with few major tweaks. This is NOT RSI. Features V2: Added Supply/Demand Filter You can select which zone to see on the chart ( Important Resistance/Support; Verified Resistance/Support; etc ).  You get alerts when prices is entering on a specific supply/demand zone. How to use? When the signal comes, you will
The Magic MA Moving Average Indicator is a market analysis tool that has more than 30 types of moving averages that the trader can use to gauge the market trend. Among the types of moving averages that the trader can visualize are the most common MAs (SMA, EMA and SMMA), adaptive moving averages such as FRAMA and KAMA and other MAs based on innovative calculation and analysis methods such as LSMA, ZLEMA and others. The indicator is designed to display all these moving averages on a single cha
Indicator developed with precision algorithm that seeks moments of strong trend in the markets. Reconciled with an algorithm that seeks high volume moments in the market. I recommend using timeframes M15 to H1. I also recommend an optimization to your liking for your best currency pairs. Any questions, do not hesitate to ask. Buy EA based on this indicator CLICKING HERE This is an excellent trigger indicator for your trading system. If you already operate a trend and want an indicator to show y
Block Master Pro
Stanislav Konin
5 (3)
The Block Master Pro indicator is designed to visually identify areas on the chart where significant volumes from major market participants are likely concentrated. These areas, known as order blocks, represent price ranges where large players place their orders, potentially signaling a price reversal and movement in the opposite direction. Key Features: Order Block Identification: Block Master Pro effectively identifies order blocks by pinpointing price ranges where large orders are placed. Th
VR Cub
Vladimir Pastushak
VR Cub 은 고품질 진입점을 얻는 지표입니다. 이 지표는 수학적 계산을 용이하게 하고 포지션 진입점 검색을 단순화하기 위해 개발되었습니다. 지표가 작성된 거래 전략은 수년 동안 그 효율성을 입증해 왔습니다. 거래 전략의 단순성은 초보 거래자라도 성공적으로 거래할 수 있다는 큰 장점입니다. VR Cub은 포지션 개시 지점과 이익 실현 및 손절매 목표 수준을 계산하여 효율성과 사용 편의성을 크게 높입니다. 간단한 거래 규칙을 이해하려면 아래 전략을 사용한 거래 스크린샷을 살펴보세요. 설정, 세트 파일, 데모 버전, 지침, 문제 해결 등은 다음에서 얻을 수 있습니다. [블로그] 다음에서 리뷰를 읽거나 작성할 수 있습니다. [링크] 버전 [MetaTrader 5] 진입점 계산 규칙 포지션 개설 진입점을 계산하려면 VR Cub 도구를 마지막 최고점에서 마지막 최저점까지 늘려야 합니다. 첫 번째 지점이 두 번째 지점보다 빠른 경우, 거래자는 막대가 중간선 위에서 마감될 때까지 기다립니다
The new update makes this indicator a complete tool for studying, analyzing and operating probabilistic patterns. It includes: On-chart Multi-asset percentage monitor. Configurable martingales. Twenty-one pre-configured patterns , including Mhi patterns and C3. An advanced pattern editor to store up to 5 custom patterns. Backtest mode to test results with loss reports. Trend filter. Hit operational filter. Martingale Cycles option. Various types of strategies and alerts. Confluence between patte
Trend Teller MT4
Ian Nganga Comba
Trend Teller는 모든 주요 통화쌍과 모든 시간대(M1부터 MN1까지)의 시장 트렌드를 한눈에 파악할 수 있는 강력하고 직관적인 대시보드 도구입니다. 트레이더가 직접 만든 이 도구는 시장 트렌드 분석에서 추측을 제거하고, 더 큰 흐름에 맞춰 거래할 수 있도록 도와줍니다. 대부분의 초보 트레이더는 시장 방향을 파악하는 데 어려움을 겪으며, 심지어 숙련된 전문가들조차도 방향을 잘못 판단할 때가 있습니다. 그래서 Trend Teller는 초보자부터 전문가까지 모든 트레이더에게 이상적인 도구입니다. 주요 기능: 다중 시간대 분석 모든 주요 통화쌍의 강도와 방향을 즉시 스캔합니다. 스캘핑이든 스윙 트레이딩이든, Trend Teller는 모두를 지원합니다. 사용자 맞춤형 표시 데이터가 너무 많다고 느껴진다면? 걱정 마세요. 숫자만 표시하거나 색상 신호만 표시하거나, 원한다면 특정 시간대를 숨길 수도 있습니다. 내장 알림 기능 하루 종일 화면을 바라볼 필요 없습니다! 강한 추세나 거래 아
Price Grid Navigator
Dora Nafwa Mwabini
프라이스 그리드 네비게이터 지표 프라이스 그리드 네비게이터는 트레이더가 주요 지지선과 저항선을 동적으로 파악할 수 있도록 설계된 강력하고 직관적인 거래 도구입니다. 잠재적 진입점, 청산점, 그리고 반전 구간을 명확하게 시각적으로 표시하여 모든 경험 수준의 트레이더에게 필수적인 도구입니다. 이 지표는 이러한 구간을 동적으로 계산하고 표시하여 트레이더에게 잠재적 진입점, 청산점, 그리고 반전 구간을 명확하게 시각적으로 보여줍니다. 외환, 지수 또는 상품 거래 등 어떤 상품을 거래하든 이 도구는 동적 원리를 적용하는 과정을 간소화하여 정확하고 확신을 가지고 정보에 기반한 거래 결정을 내릴 수 있도록 도와줍니다. 장점 및 특징 1. 정확한 지지선 및 저항선: 이 지표는 현재 가격 범위를 기반으로 주요 가격선을 동적으로 계산하고 표시하여 정확성과 관련성을 보장합니다. 2. 사용자 정의 기간: P 매개변수를 사용하면 최고가와 최저가를 계산하는 기간을 조정할 수 있으므로 다양한 거래 스타일
FREE
Smart Moving Average MT4
Mostafa Saad Saeed Shawara
제품 제목 Smart Moving Averages (MT4) – SmartView 시리즈의 일부 간단한 설명 MetaTrader 플랫폼에서 독특한 사용자 경험을 제공하는 Moving Averages 지표입니다. 이전에 사용할 수 없었던 고급 기능을 제공하며, 더블 클릭으로 설정 열기, 삭제하지 않고 지표 숨기기/표시하기, 지표 창을 전체 차트 크기로 표시하기 등의 기능을 포함합니다. SmartView Indicators 시리즈의 나머지 부분과 원활하게 작동하도록 설계되었습니다. 개요 SmartView 시리즈는 혁신적인 기능을 통해 MetaTrader 플랫폼의 지표에 독특하고 독특한 사용자 경험을 제공하여 지표 관리를 더 빠르고 쉽게 만듭니다. 각 지표는 차트에 스마트 제어 패널이 장착되어 있어 필수 정보를 표시하고 모든 중요한 기능에 빠르게 액세스할 수 있습니다. 이전에 사용할 수 없었던 고유한 기능 SmartView 시리즈는 지표 작업을 더 쉽고 빠르게 만드는 고급 기능을 제공합니
FREE
Introduction This indicator detects volume spread patterns for buy and sell opportunity. The patterns include demand and supply patterns. You might use each pattern for trading. However, these patterns are best used to detect the demand zone (=accumulation area) and supply zone (=distribution area). Demand pattern indicates generally potential buying opportunity. Supply pattern indicates generally potential selling opportunity. These are the underlying patterns rather than direct price action. T
PW Oscillator
Svyatoslav Kucher
5 (1)
PW Oscillator   - индикатор предназначенный для поиска локальных экстремумов, определения текущей тенденции. В расчетах индикатора используется авторская методика. С помощью индикатора можно определять места возможного разворота цены желательно в направлении тенденции, но также с достаточной точностью и против нее. Также с помощью индикатора можно определять текущую тенденцию. Индикатор подходит для любых валютных пар, но для адекватного отображения показания необходимо, чтобы было достаточно ис
Delta Fusion Pro
Francesco Secchi
5 (2)
Delta Fusion Pro – 인트라데이 트레이딩을 위한 고급 주문 흐름 분석 Delta Fusion Pro는 MetaTrader 4용 전문 지표로, 공격적인 주문 흐름을 드러내고 기관 압력의 강도와 방향을 실시간으로 보여줍니다. 기존의 거래량 지표와 달리, Ask와 Bid 거래량 간의 델타를 분석하여 반전 예측, 추세 확인 및 전문 관심 영역을 식별합니다. 주요 특징 지능형 자동 조정 시스템 다음 조건에 따라 모든 매개변수를 자동으로 조정합니다: 상품 유형 (외환, 암호화폐, 지수, 원자재, 주식) 운영 타임프레임 시장 변동성 (ATR) 최근 평균 거래량 초보 트레이더를 위한 수동 설정 없음 – 지표가 자동으로 보정됩니다! 기능 NetDelta 및 누적 델타 Ask/Bid 공격적 거래량 차이 계산, 사용자 지정 EMA 스무딩 실시간 방향 압력 시각화 히스토그램 색상 사용자 지정 (매수/매도) 가격/거래량 다이버전스 일반 및 숨겨진 다이버전스 자동 감지 강도 분류: 강/중/
This is an original, agile, and excellent trending system. Whether you are a beginner trading novice or a professional trader, this set of indicators can help you quickly and timely track the latest changes in market trends. It has the following characteristics: The method of use is extremely simple, plug and play, and the display of all trend analysis results is clear at a glance; There is no need to configure any functional parameters, the trend tracking indicator will automatically analyze th
MicroMini FFMV Dashboard and CSM
Opengates Success International
MicroMini FFMV Dashboard+CSM This is a custom indicator created to give Traders a full view of what is going on in the market. It uses a real time data to access the market and display every bit of information needed to make successful trading. To add value to the trading operation, Currency Strength Meter is added to it in order to consolidate the effective work of this indicator. THIS IS A MicroMini size of the FULL FOREX MARKET VIEW DASHBOARD INDICATOR with CSM added. This is for those who d
MT4 버전: https://www.mql5.com/en/market/product/157433 MT5 버전: https://www.mql5.com/en/market/product/167286 볼륨 불균형(Volume Imbalance)은 가벼운 볼륨 프로파일과 델타 불균형 시각화 도구로, 설정 가능한 조회 범위 내에서 거래량이 많은 가격대, 방향성 압력, 그리고 거래량이 적은 가격대를 파악하는 데 도움을 줍니다. 총 거래량만 보여주는 기존 볼륨 프로파일과 달리, 이 지표는 각 가격대를 다음과 같이 구분합니다. 매수 거래량(매수 압력) – 상승 캔들(종가 > 시가)을 기준으로 추정 매도 거래량(매도 압력) – 하락 캔들(종가 ≤ 시가)을 기준으로 추정 결과적으로 차트 오른쪽에는 TradingView 스타일의 깔끔한 프로파일이 표시되고, 델타 요약 패널에는 가격대별 불균형 비율(Δ%)이 표시되어 매수자와 매도자가 우세했던 지점을 쉽게 확인할 수 있습니다. 또한, 선택한 기간 내
Telegram Ultimate Manager MT4 Use Cases: Manager Order (open, close, modify order) Publish open and close order to Telegram Channel Open trade based on Forex Factory News Requirement: Telegram Chat ID Telegram Bot API Token Telegram Channel ID Please read the guide This tools can not be backtested Free n8n workflow template to : 1. Import Forex Factory news to Google Calendar 2. Send chat to Telegram bot about news release. Is it good or bad for the currency Inputs: Telegram Bot Token : your T
Attraverso l'indicatore Savius Zone potrai finalmente: Definire delle zone oggettive da attenzionare Ridurre la discrezionalità Filtrare i tuoi pattern operativi Avvalerti di un metodo comprovato Qui di seguito alcune funzioni dell'indicatore Savius Zone: Zone Buy & Sell L’indicatore fornisce delle zone buy e sell ogni giorno dopo l’apertura del mercato cash sui seguenti mercati: DAX, S&P500, Nasdaq, Russel2000, Dow Jones Occasioni giornaliere Savius Zone fornisce occasioni di trading tutti i
Symbol Cost Info MT4
Opeyemi Fuad Anokwu
Introducing the   “Symbol Cost Info MT4”   indicator – your ultimate tool for staying ahead in the forex market! This innovative indicator is designed to empower traders with real-time cost information, directly on their charts. Here’s why every trader needs the “Symbol Cost Info MT4” in their arsenal: Real-Time Spread Monitoring : Keep a close eye on the spread for any currency pair, ensuring you enter the market at the most cost-effective times. Pip Value at Your Fingertips : Instantly know t
FREE
Price Magnets
Ivan Simonika
Price Magnet — Price Density and Attraction Levels Indicator Price Magnet is a professional analytical tool designed to identify key support and resistance levels based on statistical Price Density. The indicator analyzes a specified historical period and detects price levels where the market spent the most time. These zones act as “magnets,” attracting price action or forming a structural base for potential reversals. Unlike traditional Volume Profile tools, Price Magnet focuses on price-time d
Magic Balance
Daniil Evstratenko
The indicator shows which trading pairs, strategies, robots and signals that you use are profitable and which are not. The statistic of trades and balance graph are displayed in the account currency and pips - to switch simply click on the graph. button "$"(top left) - minimize/expand and move the indicator panel button ">"(bottom right) - stretching and resetting to the original size Statistic of trades 1 line - account balance, current profit and lot of open trades; 2 line - the number of all
Alpha Trend sign has been a very popular trading tool in our company for a long time. It can verify our trading system and clearly indicate trading signals, and the signals will not drift. Main functions: Based on the market display of active areas, indicators can be used to intuitively determine whether the current market trend belongs to a trend market or a volatile market. And enter the market according to the indicator arrows, with green arrows indicating buy and red arrows indicating se
Signal From Level
Yaroslav Varankin
Binary Options Support Resistance Indicator This indicator is designed for binary options trading and effectively shows retracements from support and resistance levels. Signals appear on the current candle. A red arrow pointing downwards indicates a potential selling opportunity, while a blue arrow pointing upwards suggests buying opportunities. All that needs adjustment is the color of the signal arrows. It is recommended to use it on the M1-M5 timeframes as signals are frequent on these timef
이 제품의 구매자들이 또한 구매함
Gann Made Easy
Oleg Rodin
4.83 (157)
Gann Made Easy 는 mr.의 이론을 사용하여 최고의 거래 원칙을 기반으로 하는 전문적이고 사용하기 쉬운 Forex 거래 시스템입니다. W.D. 간. 이 표시기는 Stop Loss 및 Take Profit Levels를 포함하여 정확한 BUY 및 SELL 신호를 제공합니다. PUSH 알림을 사용하여 이동 중에도 거래할 수 있습니다. 구매 후 거래 방법 안내 및 유용한 추가 지표를 무료로 받으시려면 저에게 연락주세요! 아마도 Gann 거래 방법에 대해 이미 여러 번 들었을 것입니다. 일반적으로 Gann의 이론은 초보자 거래자뿐만 아니라 이미 거래 경험이 있는 사람들에게도 매우 복잡한 것입니다. Gann의 거래 방식은 이론적으로 적용하기 쉽지 않기 때문입니다. 나는 그 지식을 연마하고 Forex 지표에 최고의 원칙을 적용하기 위해 몇 년을 보냈습니다. 표시기는 적용하기가 매우 쉽습니다. 차트에 첨부하고 간단한 거래 권장 사항을 따르기만 하면 됩니다. 지표는 지속적으로 시장 분석
Scalper Inside PRO
Alexey Minkov
4.74 (69)
An exclusive indicator that utilizes an innovative algorithm to swiftly and accurately determine the market trend. The indicator automatically calculates opening, closing, and profit levels, providing detailed trading statistics. With these features, you can choose the most appropriate trading instrument for the current market conditions. Additionally, you can easily integrate your own arrow indicators into Scalper Inside Pro to quickly evaluate their statistics and profitability. Scalper Inside
M1 Sniper
Oleg Rodin
5 (19)
M1 SNIPER 는 사용하기 쉬운 거래 지표 시스템입니다. M1 시간대에 맞춰 설계된 화살표 지표입니다. 이 지표는 M1 시간대 스캘핑을 위한 단독 시스템으로 사용할 수 있으며, 기존 거래 시스템의 일부로도 사용할 수 있습니다. 이 거래 시스템은 M1 시간대 거래용으로 특별히 설계되었지만, 다른 시간대에도 사용할 수 있습니다. 원래는 XAUUSD와 BTCUSD 거래를 위해 이 방법을 설계했지만, 다른 시장 거래에도 유용하다는 것을 알게 되었습니다. 이 지표의 신호는 추세 방향과 반대로 거래될 수 있습니다. 저는 지표의 신호를 활용하여 양방향으로 거래할 수 있도록 돕는 특별한 거래 기법을 알려드립니다. 이 방법은 특별한 동적 지지선과 저항선 가격 영역을 활용하는 것을 기반으로 합니다. 구매하시면 M1 SNIPER 화살표 지표를 바로 다운로드하실 수 있습니다. 또한, 아래 스크린샷에 표시된 Apollo Dynamic SR 지표는 M1 SNIPER 도구를 사용하는 모든 사용자에게 무료로
Dynamic Forex28 Navigator
Bernhard Schweigert
4.43 (7)
Dynamic Forex28 Navigator - 차세대 외환 거래 도구. 현재 49% 할인. Dynamic Forex28 Navigator는 오랫동안 인기 있는 지표의 진화형으로, 세 가지의 힘을 하나로 결합했습니다. 고급 통화 Strength28 지표(695개 리뷰) + 고급 통화 IMPULSE with ALERT(520개 리뷰) + CS28 콤보 신호(보너스). 지표에 대한 자세한 정보 https://www.mql5.com/en/blogs/post/758844 차세대 Strength 지표는 무엇을 제공합니까?  원래 지표에서 좋아했던 모든 것이 새로운 기능과 더 높은 정확도로 강화되었습니다. 주요 기능: 독점적인 통화 Strength 공식.  모든 시간대에 걸쳐 부드럽고 정확한 강도선. 추세와 정확한 진입을 식별하는 데 이상적입니다. 역동적인 시장 피보나치 수준(시장 피보나치).  이 지표에만 있는 고유한 기능. 가격 차트가 아닌 통화 강도에 피보나치가 적용됩니다.
현재 40% 할인 ! 초보자 또는 전문가 트레이더를 위한 최고의 솔루션! 이 대시보드 소프트웨어는 28개의 통화 쌍에서 작동합니다. 2가지 주요 지표(Advanced Currency Strength 28 및 Advanced Currency Impulse)를 기반으로 합니다. 전체 Forex 시장에 대한 훌륭한 개요를 제공합니다. 고급 통화 강도 값, 통화 이동 속도 및 모든(9) 시간대의 28 Forex 쌍에 대한 신호를 보여줍니다. 추세 및/또는 스캘핑 기회를 정확히 파악하기 위해 차트의 단일 지표를 사용하여 전체 시장을 볼 수 있을 때 거래가 어떻게 개선될지 상상해 보십시오! 잠재적인 거래를 식별하고 확인하면서 강력한 통화와 약한 통화를 더욱 쉽게 식별할 수 있도록 이 지표에 기능을 내장했습니다. 이 표시기는 통화의 강세 또는 약세가 증가 또는 감소하는지 여부와 모든 시간대에서 수행되는 방식을 그래픽으로 보여줍니다. 추가된 새로운 기능은 현재 시장 조건 변화에 적응하는
CRT Multi-Timeframe Market Structure & Liquidity Sweep Indicator Non-Repainting | Multi-Asset | MT5 Version Available MT5 Version:   https://www.mql5.com/en/market/product/162075 Full User Guide — explains what each feature does and why:   https://www.mql5.com/en/blogs/post/767525 Quick Start User Guide  — explains how to configure and in what order:  https://www.mql5.com/en/blogs/post/767540 Indicator Overview CRT Ghost Candle HTF Fractal is a complete institutional-grade market structure too
Scalper Vault
Oleg Rodin
5 (36)
Scalper Vault 는 성공적인 스캘핑에 필요한 모든 것을 제공하는 전문 스캘핑 시스템입니다. 이 표시기는 외환 및 바이너리 옵션 거래자가 사용할 수 있는 완전한 거래 시스템입니다. 권장 시간 프레임은 M5입니다. 시스템은 추세 방향으로 정확한 화살표 신호를 제공합니다. 또한 상단 및 하단 신호와 Gann 시장 수준을 제공합니다.  이 시스템은 사용하기가 매우 쉽습니다. 원하는 시장 지역의 화살표만 따라가면 됩니다. 엑시트는 가격이 적정 수준에 도달하거나 시장의 고점 또는 저점 신호가 나타날 때 수행됩니다.  표시기는 PUSH 알림을 포함한 모든 유형의 경고를 제공합니다. 인디케이터 구매 후 연락주세요. 내 개인 거래 권장 사항과 훌륭한 보너스 지표를 무료로 공유합니다! 나는 당신에게 행복하고 유익한 거래를 기원합니다!
Trend indicator AI
Ramil Minniakhmetov
4.49 (84)
트렌드 인공 지능 지표는 실행 가능한 진입 점 및 반전 경고와 추세 식별을 결합하여 상인의 시장 분석을 향상시킬 훌륭한 도구입니다. 이 표시기는 사용자가 자신감과 정밀도로 외환 시장의 복잡성을 탐색 할 수 있도록 지원합니다 기본 신호 외에도 트렌드 인공 지능 지표는 풀백 또는 되돌림 중에 발생하는 2 차 진입 점을 식별하여 거래자가 기존 트렌드 내에서 가격 수정을 활용할 수 있도록합니다. 중요한 장점: ·작동 4 및 5 *명확한 구매 또는 판매 신호 *다시 칠하지 않습니다 *모든 자산에서 작동 나는 전보 사기에 개 또는 세트를 판매하지 않도록주의. 모든 설정은 블로그에 여기에 무료.  중요! 지침 및 보너스를 얻기 위해 구입 후 즉시 저에게 연락! 진짜 가동 감시는 뿐 아니라 나의 다른 제품 여기에서 찾아낼 수 있습니다: https://www.mql5.com/en/users/mechanic/seller&nbsp ; 설정 및 입력: 모든 자산에 대해 기본 설정을 권
Atomic Analyst
Issam Kassas
5 (3)
우선적으로 언급할 점은이 거래 지표가 다시 그리지 않고 지연되지 않으며 이를 통해 수동 및 로봇 거래 모두에 이상적이라는 점입니다. 사용자 매뉴얼: 설정, 입력 및 전략. Atomic Analyst는 가격의 강도와 모멘텀을 활용하여 시장에서 더 나은 이점을 찾는 PA Price Action Indicator입니다. 고급 필터를 장착하여 잡음과 거짓 신호를 제거하고 거래 잠재력을 높이는 데 도움이 됩니다. 복잡한 지표의 다중 레이어를 사용하여 Atomic Analyst는 차트를 스캔하고 복잡한 수학적 계산을 간단한 신호와 색상으로 변환하여 초보 트레이더가 이해하고 일관된 거래 결정을 내릴 수 있도록합니다. "Atomic Analyst"는 새로운 및 경험이 풍부한 트레이더를위한 종합적인 거래 솔루션입니다. 프리미엄 지표와 최고 수준의 기능을 하나의 거래 전략에 결합하여 모든 종류의 트레이더에 대한 다재다능한 선택지가되었습니다. 인트라데이 거래 및 스캘핑 전략 : 빠르고 정확한 일일
FX Power MT4 NG
Daniel Stein
4.95 (21)
FX Power: 통화 강세 분석으로 더 스마트한 거래 결정을 개요 FX Power 는 어떤 시장 상황에서도 주요 통화와 금의 실제 강세를 이해하기 위한 필수 도구입니다. 강한 통화를 매수하고 약한 통화를 매도함으로써 FX Power 는 거래 결정을 단순화하고 높은 확률의 기회를 발견합니다. 트렌드를 따르거나 극단적인 델타 값을 사용해 반전을 예측하고자 한다면, 이 도구는 귀하의 거래 스타일에 완벽히 적응합니다. 단순히 거래하지 말고, FX Power 로 더 스마트하게 거래하세요. 1. FX Power가 거래자에게 매우 유용한 이유 통화와 금의 실시간 강세 분석 • FX Power 는 주요 통화와 금의 상대적 강세를 계산하고 표시하여 시장 역학에 대한 명확한 통찰력을 제공합니다. • 어떤 자산이 앞서고 있고 어떤 자산이 뒤처지는지 모니터링하여 보다 현명한 거래 결정을 내릴 수 있습니다. 포괄적인 멀티 타임프레임 뷰 • 단기, 중기 및 장기 타임프레임에서 통화와 금의 강세를
The Nihilist 5.0 Indicator includes Forexalien and Nihilist Easy Trend trading strategies and systems. It is composed of an MTF Dashboard where you can analyze the different input possibilities of each strategy at a glance. It has an alert system with different types of configurable filters. You can also configure which TF you want to be notified on your Metatrader 4 platform and Mobile application The indicator has the option to view how could be a TP and SL by using ATR or fixed points, even w
GOLD Impulse with Alert
Bernhard Schweigert
4.67 (12)
이 지표는 Advanced Currency IMPULSE with ALERT  +   Currency Strength Exotics  의 2가지 제품의 슈퍼 조합입니다. 그것은 모든 시간 프레임에 대해 작동하며 8개의 주요 통화와 하나의 기호에 대한 강약의 충동을 그래픽으로 보여줍니다! 이 표시기는 금, 이국적인 쌍, 상품, 지수 또는 선물과 같은 기호에 대한 통화 강도 가속을 표시하는 데 특화되어 있습니다. 금, 은, 오일, DAX, US30, MXN, TRY, CNH 등의 진정한 통화 강도 가속(충동 또는 속도)을 표시하기 위해 9번째 줄에 모든 기호를 추가할 수 있습니다. 새로운 기본 알고리즘을 기반으로 구축되어 잠재적인 거래를 훨씬 더 쉽게 식별하고 확인할 수 있습니다. 이는 통화의 강세 또는 약세가 가속되는지 여부를 그래픽으로 표시하고 가속 속도를 측정하기 때문입니다. 자동차의 속도계처럼 생각하면 됩니다. 가속화할 때 Forex 시장에서 동일한 일이 분명히 더 빠르
Advanced Supply Demand
Bernhard Schweigert
4.91 (299)
현재 40% 할인! 초보자나 전문 트레이더를 위한 최고의 솔루션! 이 보조지표는 우리가 다수의 독창적 기능과 새로운 공식을 통합한 독특하고 고품질이며 저렴한 거래 도구입니다. 이 업데이트를 통해 이중 시간대를 표시할 수 있습니다. 더 높은 TF를 표시할 수 있을 뿐만 아니라 차트 TF와 더 높은 TF 모두를 표시할 수 있습니다: 중첩 영역 표시. 모든 Supply Demand 트레이더들이 좋아할 것입니다. :) 중요한 정보 공개 Advanced Supply Demand의 잠재력을 극대화하려면 다음을 방문하십시오. https://www.mql5.com/ko/blogs/post/720245   진입 또는 목표의 명확한 트리거 포인트를 정확히 찾아냄으로 해서 거래가 어떻게 개선될지 상상해 보십시오. 새로운 알고리즘을 기반으로 매수자와 매도자 간의 잠재적인 불균형을 훨씬 더 쉽게 분간할 수 있습니다. 왜냐하면 가장 강한 공급영역과 가장 강한 수요 영역과 과거에 어떻게 진행 되었는지를(이전
GEM Signal MT4
Shengzu Zhong
GEM Signal Pro - 전문 트레이딩 인디케이터 정밀한 진입. 리페인트 없음. 한 번에 하나의 결정. GEM Signal Pro는 MetaTrader 4 및 MetaTrader 5를 위해 구축된 전문가급 추세추종형 인디케이터입니다. 대부분의 리테일 인디케이터에 흔한 노이즈, 지연, 과장된 약속 없이, 깔끔하고 실행 가능한 신호를 요구하는 트레이더를 위해 설계되었습니다. 모든 신호는 독자적인 다층 확인 엔진을 통해 평가됩니다. GEM Signal Pro가 다른 이유 대부분의 인디케이터는 색깔 화살표 하나만 보여주고 나머지는 사용자가 추측하게 만듭니다. GEM Signal Pro는 완전한 거래 셋업을 제공합니다. 유효한 기회가 감지되면, 인디케이터는 시드 신호를 표시하고, 구조적 확인을 기다리며, 캔들 패턴 인식을 통해 최적의 진입 타이밍을 식별한 뒤, 차트에 정확한 리스크 관리 레벨을 그려줍니다. 진입가, 손절가, 그리고 각기 대응하는 손익비와 함께 3개의 목표가를 한눈에 볼
FX Volume
Daniel Stein
4.63 (38)
FX Volume: 브로커 시각에서 바라보는 진짜 시장 심리 간단 요약 트레이딩 접근 방식을 한층 더 향상시키고 싶으신가요? FX Volume 는 소매 트레이더와 브로커의 포지션을 실시간으로 파악할 수 있게 해 줍니다. 이는 COT 같은 지연된 보고서보다 훨씬 빠릅니다. 꾸준한 수익을 추구하는 분이든, 시장에서 더 깊은 우위를 원하시는 분이든, FX Volume 을 통해 대규모 불균형을 찾아내고, 돌파 여부를 확인하며 리스크 관리를 정교화할 수 있습니다. 지금 시작해 보세요! 실제 거래량 데이터가 의사결정을 어떻게 혁신할 수 있는지 직접 경험해 보시기 바랍니다. 1. 트레이더에게 FX Volume이 매우 유익한 이유 탁월한 정확도를 지닌 조기 경보 신호 • 다른 사람들보다 훨씬 앞서, 각 통화쌍을 매수·매도하는 트레이더 수를 거의 실시간으로 파악할 수 있습니다. • FX Volume 은 여러 리테일 브로커에서 추출한 실제 거래량 데이터를 종합해 명확하고 편리한 형태로 제공하는
MetaBands M4
Vahidreza Heidar Gholami
3.5 (6)
MetaBands uses powerful and unique algorithms to draw channels and detect trends so that it can provide traders with potential points for entering and exiting trades. It’s a channel indicator plus a powerful trend indicator. It includes different types of channels which can be merged to create new channels simply by using the input parameters. MetaBands uses all types of alerts to notify users about market events. Features Supports most of the channel algorithms Powerful trend detection algorith
RFI levels PRO
Roman Podpora
5 (1)
이 지표는 추세 반전 지점과 가격 반등 영역을 정확하게 보여줍니다.       주요 투자자들   . 새로운 트렌드가 형성되는 곳을 파악하고 최대한 정확하게 의사결정을 내리며 모든 거래를 완벽하게 통제합니다. TREND LINES PRO   지표와 함께 사용할 때 최대의 잠재력을 발휘합니다.  VERSION MT5 지표가 보여주는 내용: 새로운 추세의 시작 시 활성화되는 반전 구조 및 반전 수준. 최소한의 위험 대비 수익률을 갖는 이익 실현   (TAKE PROFIT)   및   손절매(STOP LOSS)   레벨 표시       RR 1:2   . 지능형 손실 감소 로직이 적용된 손절매 기능. 지정된 지표에서 두 가지 추세 유형에 대한 반전 패턴을 표시합니다. 지표: 트렌드를 따라   트렌드 라인 프로   (글로벌 트렌드 변화) 트렌드 프로   (빠른 트렌드 변화) 간단하고 효과적입니다       스캐너       실시간 추세 (신규). 다중 시간 프레임 도구 필터링. 표시하다  
Trend Lines PRO
Roman Podpora
5 (1)
트렌드 라인즈 프로       이 지표는 시장이 실제로 어떤 방향으로 전환되는지 파악하는 데 도움이 됩니다. 실제 추세 반전 지점과 주요 시장 참여자들이 다시 진입하는 지점을 보여줍니다. 보시다시피       BOS 라인       복잡한 설정이나 불필요한 노이즈 없이 더 높은 시간대의 추세 변화와 주요 레벨을 확인할 수 있습니다. 신호는 차트에 다시 그려지지 않고 캔들이 마감된 후에도 계속 표시됩니다. VERSION MT 5   -   RFI LEVELS PRO   표시기   와 결합할 때 최대 잠재력을 발휘합니다. 지표가 보여주는 내용: 실제 변화       추세(BOS 라인) 한 번 신호가 나타나면 그 신호는 계속 유효합니다! 이는 신호를 발생시킨 후 변경될 수 있는 리페인팅 방식의 지표와 중요한 차이점입니다. 리페인팅 방식의 지표는 잠재적으로 자금 손실로 이어질 수 있습니다. 이제 더욱 높은 확률과 정확도로 시장에 진입할 수 있습니다. 또한 화살표가 나타난 후 목표가(익절)
PRO Renko System
Oleg Rodin
5 (30)
PRO Renko System 은 RENKO 차트 거래를 위해 특별히 고안된 매우 정확한 거래 시스템입니다. 이것은 다양한 거래 상품에 적용될 수있는 보편적 인 시스템입니다. 체계는 효과적으로 당신에게 정확한 반전 신호에 접근을 주는 소위 시장 소음을 중화합니다. 이 표시기는 사용하기가 매우 쉽고 신호 생성을 담당하는 매개 변수가 하나만 있습니다. 당신은 쉽게 당신의 선택의 어떤 무역 계기에 공구를 적응시킬 수 있고 renko 막대기의 크기. 나는 항상 당신이 내 소프트웨어로 수익성있게 거래 할 수 있도록 추가 지원을 제공 할 준비가되어 있습니다! 나는 당신에게 행복하고 수익성있는 거래를 기원합니다! 구매 후 저에게 연락하십시오! 내 렌코 차트 생성기를 보내드립니다. 또한 내 개인 권장 사항 및 시스템의 다른 모듈을 무료로 공유 할 것입니다!
TPSproTREND PrO
Roman Podpora
4.67 (27)
TPSproTrend PRO       - 이는 시장을 자동으로 분석하여 추세 및 추세 변화에 대한 정보를 제공하고 거래 진입 시점을 표시하는 추세 지표입니다.       다시 그릴 필요 없이! ИНСТРУКЦИЯ RUS   -   지침   영어   -   버전 MT5 주요 기능: 정확한 진입 신호       재도색 없이! 한 번 신호가 나타나면 그 신호는 계속 유효합니다! 이는 신호를 제공한 후 변경되어 잠재적으로 예치금 손실로 이어질 수 있는 리페인팅 지표와는 확연히 다른 점입니다. 이제 더 높은 확률과 정확도로 시장에 진입할 수 있습니다. 또한 화살표가 나타난 후 목표가(익절)에 도달하거나 반전 신호가 나타날 때까지 캔들에 색상을 입히는 기능도 있습니다   . 손절매/이익실현 영역 표시 진입점을 찾을 때 시각적 명확성을 높이기 위해, 최적의 진입점을 찾을 수 있는 매수/매도 영역을 초기에 표시하는 모듈을 개발했습니다. 또한, 손절매 수준을 시간에 따라 관리하는 지능형 로직을
Meravith
Ivan Stefanov
5 (3)
마켓 메이커를 위한 도구. Meravith는 다음과 같은 기능을 제공합니다: 모든 타임프레임을 분석하고 현재 유효한 추세를 표시합니다. 강세와 약세 거래량이 동일한 유동성 구간(거래량 균형 구간)을 강조 표시합니다. 서로 다른 타임프레임의 모든 유동성 레벨을 차트에 직접 표시합니다. 텍스트 기반 시장 분석을 생성하여 참고용으로 제공합니다. 현재 추세를 기반으로 목표가, 지지선 및 손절가를 계산합니다. 거래의 위험 대비 보상 비율(Risk/Reward)을 계산합니다. 계좌 잔고에 따라 포지션 크기를 산출하고 잠재 수익을 추정합니다. 시장에 중대한 변화가 발생할 경우 경고도 제공합니다. 지표의 주요 라인: 강세/약세 거래량 소진 라인 — 목표가로 사용됩니다. 시장 추세를 나타내는 라인. 시장이 강세인지 약세인지에 따라 색상이 변경되며 추세 지지선 역할을 합니다. 색상은 주로 시장 심리를 보여줍니다. 거래량 균형선(Eq). Eq(Volume Equilibrium) 라인은 시스템의 핵심입니
Advanced Currency Strength28 Indicator
Bernhard Schweigert
4.91 (657)
현재 40% 할인 초보자 또는 전문가 트레이더를 위한 최고의 솔루션! 이 지표는 우리가 독점 기능과 새로운 공식을 통합했기 때문에 독특하고 고품질이며 저렴한 거래 도구입니다. 단 하나의 차트로 28 Forex 쌍의 통화 강도를 읽을 수 있습니다! 새로운 추세 또는 스캘핑 기회의 정확한 트리거 포인트를 정확히 찾아낼 수 있기 때문에 거래가 어떻게 개선될지 상상해 보십시오. 사용 설명서: 여기를 클릭  https://www.mql5.com/en/blogs/post/697384 그것이 첫 번째, 원본입니다! 쓸모없는 지망생 클론을 사지 마십시오. 더 스페셜  강력한 통화 모멘텀을 보여주는 하위 창의 화살표 GAP가 거래를 안내합니다! 기본 또는 호가 통화가 과매도/과매도 영역(외부 시장 피보나치 수준)에 있을 때 개별 차트의 기본 창에 경고 표시가 나타납니다. 통화 강도가 외부 범위에서 떨어질 때 풀백/반전 경고. 교차 패턴의 특별 경고 추세를 빠르게 볼 수 있는 다중 시간
Market Maker Reversal Scanner
Siyasanga Stephen Mabokela
Market Maker Reversal Scanner — Professional Watchlist Builder for Reversal Traders (MT4/MT5) If you trade reversals, your biggest enemy isn’t entries — it’s watchlist selection . Most traders waste hours scrolling charts and end up forcing trades on “meh” instruments. Market Maker Reversal Scanner solves that by doing one job extremely well: It scans your symbols and highlights the instruments that are “in play” for reversal conditions — so you can focus on the best setups during your session i
PZ Order Block
PZ TRADING SLU
간단하면서도 효과적인 포지션 트레이딩 전략인 Order Blocks의 개인적인 구현. 가격 범위가 브레이크 아웃의 반대 방향으로 위반되지 않은 경우 거래자는 시장에 진입하거나 마지막 주문 블록 방향으로 거래를 찾아야 합니다. 명확성을 위해 열린 블록은 그려지지 않습니다. [ 설치 가이드 | 업데이트 가이드 | 문제 해결 | 자주하는 질문 | 모든 제품 ] 강세 오픈 블록은 신시장 저점 이후의 첫 번째 강세 막대입니다. 약세 오픈 블록은 신시장 고점 이후 첫 번째 약세 막대입니다. 오픈 블록이 깨졌을 때 시그널이 나타나 오더 블록이 됨 오더블록이 반대편으로 깨지면 반전블록이 된다 표시기는 모든 종류의 경고를 구현합니다. 다시 칠하거나 다시 칠하지 않습니다. 입력 매개변수 기간: 새로운 고가 또는 저가를 생성하는 데 필요한 막대의 양입니다. 값이 작을수록 더 많은 신호가 발생합니다. 최소 ATR 필터: ATR의 승수로 표시되는 주문 블록 막대의 최소 본체 크기입니다. 최대 ATR 필
Cumulative Delta Pro
Stanislav Konin
5 (1)
Cumulative Delta Pro is a professional indicator that takes market order flow analysis to a fundamentally new level. Cumulative Delta is the difference between buying and selling volumes, presented as a continuous cumulative sum over a specific period of time starting from the initial calculation point. This metric allows traders to see in real time who controls the market: if the positive delta increases, it indicates the dominance of active buyers; if the negative delta decreases, sellers are
Pips Generator
Oleg Rodin
4.6 (10)
Apollo Pips Generator 는 추세의 방향으로 신호를 제공하는 지표입니다. 표시기는 여러 진입점을 제공하므로 항상 이익을 얻을 수 있는 거래 기회를 찾을 수 있습니다. 스크린샷에 주의하세요. 스크린샷은 상단과 하단을 나타내는 별 신호가 있는 채널로 표시되는 다른 도구와 함께 Pips Generator 도구를 보여줍니다. 이 조합은 시스템을 적용할 수 있는 여러 방법을 제공합니다. 구매 후 두 번째 표시기를 무료로 받으려면 저에게 연락하십시오. 스크린샷에 나와 있는 것과 완전히 동일한 시스템을 갖게 될 것입니다. 또한 최상의 결과를 얻기 위해 이 시스템을 사용하는 방법에 대한 지침도 제공합니다. 두 도구 모두 PUSH 알림을 포함한 모든 유형의 경고를 제공합니다. 나는 당신에게 행복한 거래를 기원합니다!
Volatility Trend System - a trading system that gives signals for entries. The volatility system gives linear and point signals in the direction of the trend, as well as signals to exit it, without redrawing and delays. The trend indicator monitors the direction of the medium-term trend, shows the direction and its change. The signal indicator is based on changes in volatility and shows market entries. The indicator is equipped with several types of alerts. Can be applied to various trading ins
TrendLine PRO MT4
Evgenii Aksenov
4.83 (167)
The Trend Line PRO indicator is an independent trading strategy. It shows the trend change, the entry point to the transaction, as well as automatically calculates three levels of Take Profit and Stop Loss protection. Trend Line PRO is perfect for all Meta Trader symbols: currencies, metals, cryptocurrencies, stocks and indices. The indicator is used in trading on real accounts, which confirms the reliability of the strategy. Robots using   Trend Line PRO   and real Signals can be found here:   
Super Reversal Indicator with Alert 개요 Super Reversal Indicator with Alert는 다중 시간 프레임 분석을 기반으로, 스토캐스틱 모멘텀, 수요와 공급 영역, 그리고 가격 반전 신호를 결합하여 높은 확률의 시장 반전 기회를 식별하도록 설계된 트레이딩 도구입니다. 이 지표는 명확한 시각적 신호와 실시간 알림을 통해 트레이더가 시장의 전환 지점을 쉽게 파악할 수 있도록 도와줍니다. 주요 기능 다중 시간 프레임 스토캐스틱 분석 상위 시간 프레임의 스토캐스틱 오실레이터 사용 (사용자 설정 가능) 모멘텀 변화 및 교차 신호 감지 정밀한 진입을 위한 과매수 및 과매도 구간 제공 반전 리젝션 신호 주요 가격 구간에서 강한 리젝션 캔들 감지 다음 위치에서의 반전 식별 일일 고점 (매도 반전) 일일 저점 (매수 반전) 차트에 화살표로 표시하여 직관적인 확인 가능 수요 및 공급 영역 H4 및 D1 시간 프레임에서 주요 영역 자동 표시 다음 영역 강조
Currency Strength Wizard
Oleg Rodin
4.84 (58)
통화 강도 마법사는 성공적인 거래를 위한 올인원 솔루션을 제공하는 매우 강력한 지표입니다. 표시기는 여러 시간 프레임의 모든 통화 데이터를 사용하여 이 또는 해당 외환 쌍의 힘을 계산합니다. 이 데이터는 특정 통화의 힘을 확인하는 데 사용할 수 있는 사용하기 쉬운 통화 지수 및 통화 전력선의 형태로 표시됩니다. 필요한 것은 거래하려는 차트에 표시기를 부착하는 것뿐입니다. 표시기는 거래하는 통화의 실제 강세를 보여줍니다. 지표는 또한 추세와 거래할 때 유리하게 사용할 수 있는 구매 및 판매 거래량 압력의 극한값을 보여줍니다. 지표는 또한 피보나치에 기반한 가능한 대상을 보여줍니다. 표시기는 PUSH 알림을 포함한 모든 유형의 알림을 제공합니다. 구매 후 연락주세요. 나는 당신과 거래 팁을 공유하고 당신에게 무료로 훌륭한 보너스 지표를 줄 것입니다! 나는 당신에게 행복하고 유익한 거래를 기원합니다!
제작자의 제품 더 보기
Global Market Risk Sentiment Meter 1. Overview The Global Market Risk Sentiment Meter is an analytical indicator designed for the MetaTrader 5 (MQL5) platform. It employs an Inter-Market Analysis approach to assess the aggregate data of specific global financial markets. By evaluating real-time price changes across US Indices, Global Equities, Cryptocurrencies, and historical Safe Haven assets (Gold and the US Dollar Index), the indicator calculates a composite sentiment score. This data is vis
FREE
Enhanced Volume Profile: The Ultimate Order Flow & Liquidity Analysis Tool Overview Enhanced Volume Profile is an indicator for MetaTrader 5 that displays the traded volume at specific price levels over a defined period. It separates the total volume into buy and sell components, presenting them as a side-by-side histogram on the chart. This allows users to observe the volume distribution and the proportion of buy and sell volumes at each price level. Graphics Rendering The indicator uses the
FREE
Are you ready to elevate your trading game and experience unparalleled accuracy in market predictions? The Scalping Range Grid Indicator is not just a tool—it’s your main weapon for pinpointing the next move in the financial markets. Designed for traders who demand the best, this cutting-edge indicator harnesses the power of grid-based analysis to scan future price transit zones with unmatched precision. Imagine having the foresight to know where the price is most likely to pause, consolidate,
Pivot RPS
Raka
5 (2)
Pivot Point Multi-Method with Dashboard This indicator is a technical analysis tool designed to calculate and display horizontal support and resistance levels based on various Pivot Point methodologies. It is built using the MQL5 Canvas library, ensuring efficient performance and a clean visual presentation on the chart. The tool calculates levels using the data from the previous completed candle of a user-defined reference timeframe. This ensures that the levels remain fixed for the duration of
FREE
Stochastic RSI-RVI Fusion   is a next-generation oscillator that goes beyond the standard Stochastic RSI. By combining the momentum precision of the   Relative Strength Index (RSI)   with the energy and volatility analysis of the   Relative Vigor Index (RVI) , this indicator provides a smoother, more reliable oscillating signal for traders looking to filter out market noise. Standard oscillators often give false signals during choppy markets. This "Fusion" edition solves that by averaging market
FREE
Stochastic RSI-RVI Fusion Dashboard (MTF) Unlock the full "Matrix" view of the market. The   Stochastic RSI-RVI Fusion Dashboard   is the advanced companion to the   Stochastic RSI-RVI Fusion   oscillator. While the standard indicator analyzes the current chart, this Dashboard monitors the entire spectrum of timeframes simultaneously—from the 1-minute scalping noise to the monthly macro trends. Trading with a single timeframe often leads to "tunnel vision." You might buy on the H1 timeframe beca
FREE
AstroCycles: Advanced Financial Astronomy Indicator Overview AstroCycles   is a sophisticated technical analysis tool developed for the MetaTrader 5 (MQL5) platform. It bridges the gap between orbital mechanics and financial market analysis by calculating precise astronomical cycles and visualizing them directly on your trading chart. Unlike standard indicators that rely on past price data, AstroMaster utilizes high-precision astronomical algorithms (Keplerian Elements and Brown’s Lunar Theory)
FREE
Advanced SMC & Volumetric Order Block Indicator Overview This enhanced-grade for MetaTrader 5 indicator is designed to decode market behavior using     Smart Money Concepts (SMC)   method . It goes beyond standard price action analysis by integrating     Volumetric Data   directly into market structure, helping traders identify high-probability reversal and continuation zones with precision. Key Features Volumetric Order Blocks:   A unique, split-gauge visualization within Order Block zones tha
FREE
PropFirm Copilot Trade Risk Management EA: The Ultimate Prop Firm Copilot The Trade Risk Management Copilot EA is an automated trading utility designed to assist manual traders and proprietary firm traders in managing their open positions and risk parameters. The tool automates the process of stop-loss and take-profit calculations, position trailing, and account drawdown monitoring. Managing multiple positions across various symbols requires continuous calculation of stops, break-even points, a
FREE
Enhanced Volume Profile: The Ultimate Order Flow & Liquidity Analysis Tool Overview Enhanced Volume Profile   is an indicator for MetaTrader 5 that displays the traded volume at specific price levels over a defined period. It separates the total volume into buy and sell components, presenting them as a side-by-side histogram on the chart. This allows users to observe the volume distribution and the proportion of buy and sell volumes at each price level. Graphics Rendering The indicator uses t
FREE
Stochastic RSI-RVI Fusion Dashboard (MTF) Unlock the full "Matrix" view of the market. The     Stochastic RSI-RVI Fusion Dashboard   is the advanced companion to the     Stochastic RSI-RVI Fusion   oscillator. While the standard indicator analyzes the current chart, this Dashboard monitors the entire spectrum of timeframes simultaneously—from the 1-minute scalping noise to the monthly macro trends. Trading with a single timeframe often leads to "tunnel vision." You might buy on the H1 timeframe
FREE
Stochastic RSI-RVI Fusion   is a next-generation oscillator that goes beyond the standard Stochastic RSI. By combining the momentum precision of the     Relative Strength Index (RSI)   with the energy and volatility analysis of the     Relative Vigor Index (RVI) , this indicator provides a smoother, more reliable oscillating signal for traders looking to filter out market noise. Standard oscillators often give false signals during choppy markets. This "Fusion" edition solves that by averaging ma
FREE
Advanced SMC & Volumetric Order Block Indicator Overview This enhanced-grade for MetaTrader 5 indicator is designed to decode market behavior using   Smart Money Concepts (SMC) method . It goes beyond standard price action analysis by integrating   Volumetric Data   directly into market structure, helping traders identify high-probability reversal and continuation zones with precision. Key Features Volumetric Order Blocks:   A unique, split-gauge visualization within Order Block zones that disp
필터:
리뷰 없음
리뷰 답변