SecModeRSI
- 지표
- 버전: 1.0

🌍 【SecMode Series】SecModeRSI – Optimized for Global Markets
📌 Overview
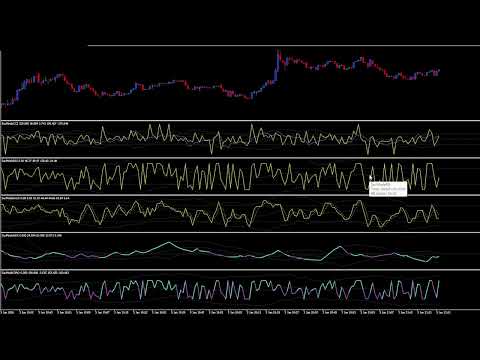
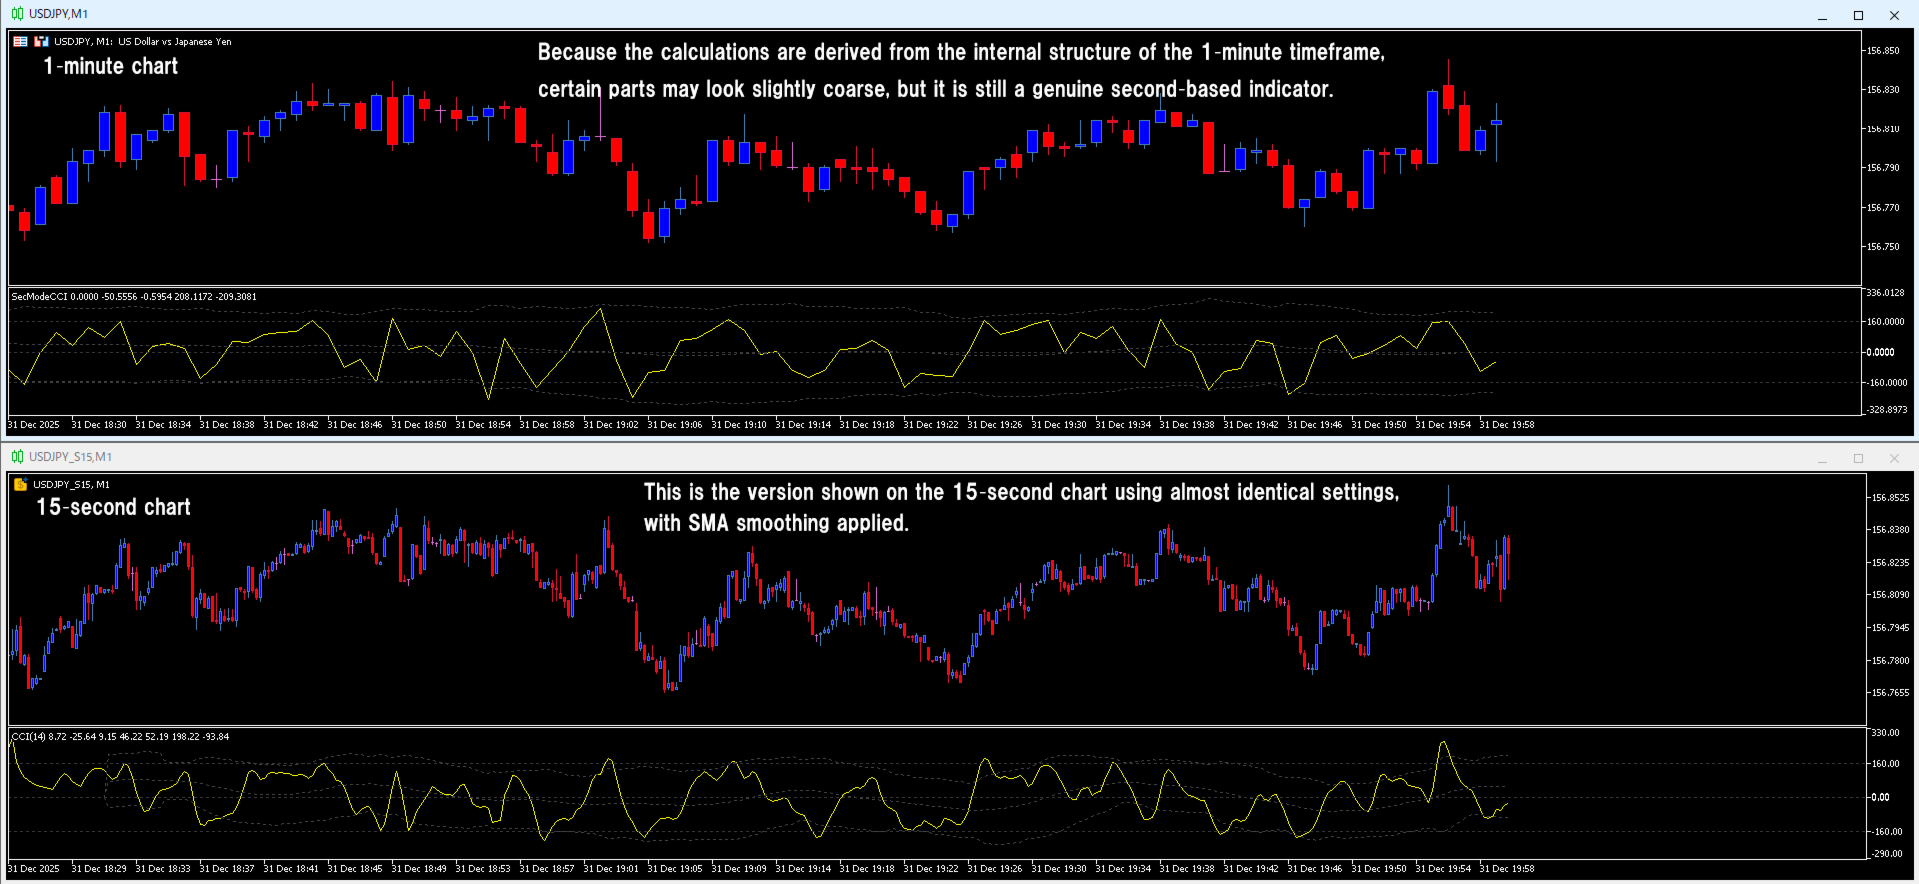
SecModeRSI is part of the SecMode Series, a next‑generation suite of indicators designed to reveal the micro‑structure of price action at the tick/second level—a level of detail that traditional 1‑minute indicators simply cannot capture.
While standard indicators refresh only once per minute, SecModeRSI uses a proprietary second‑level engine to:
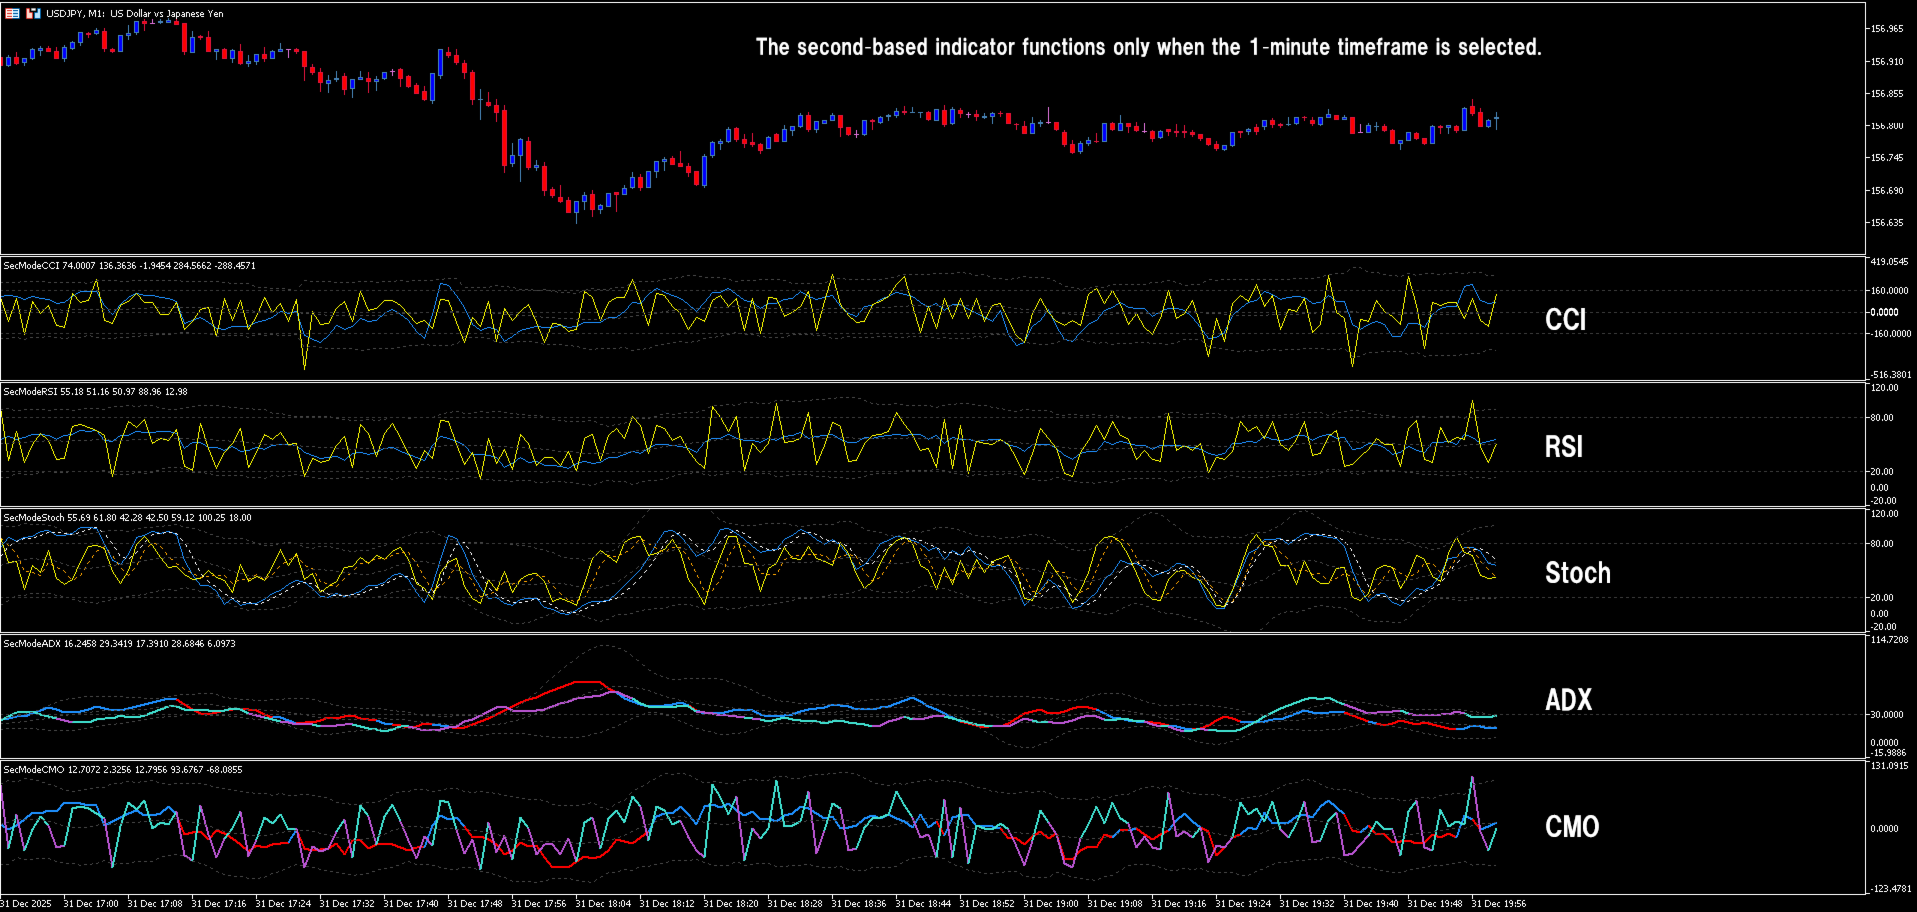
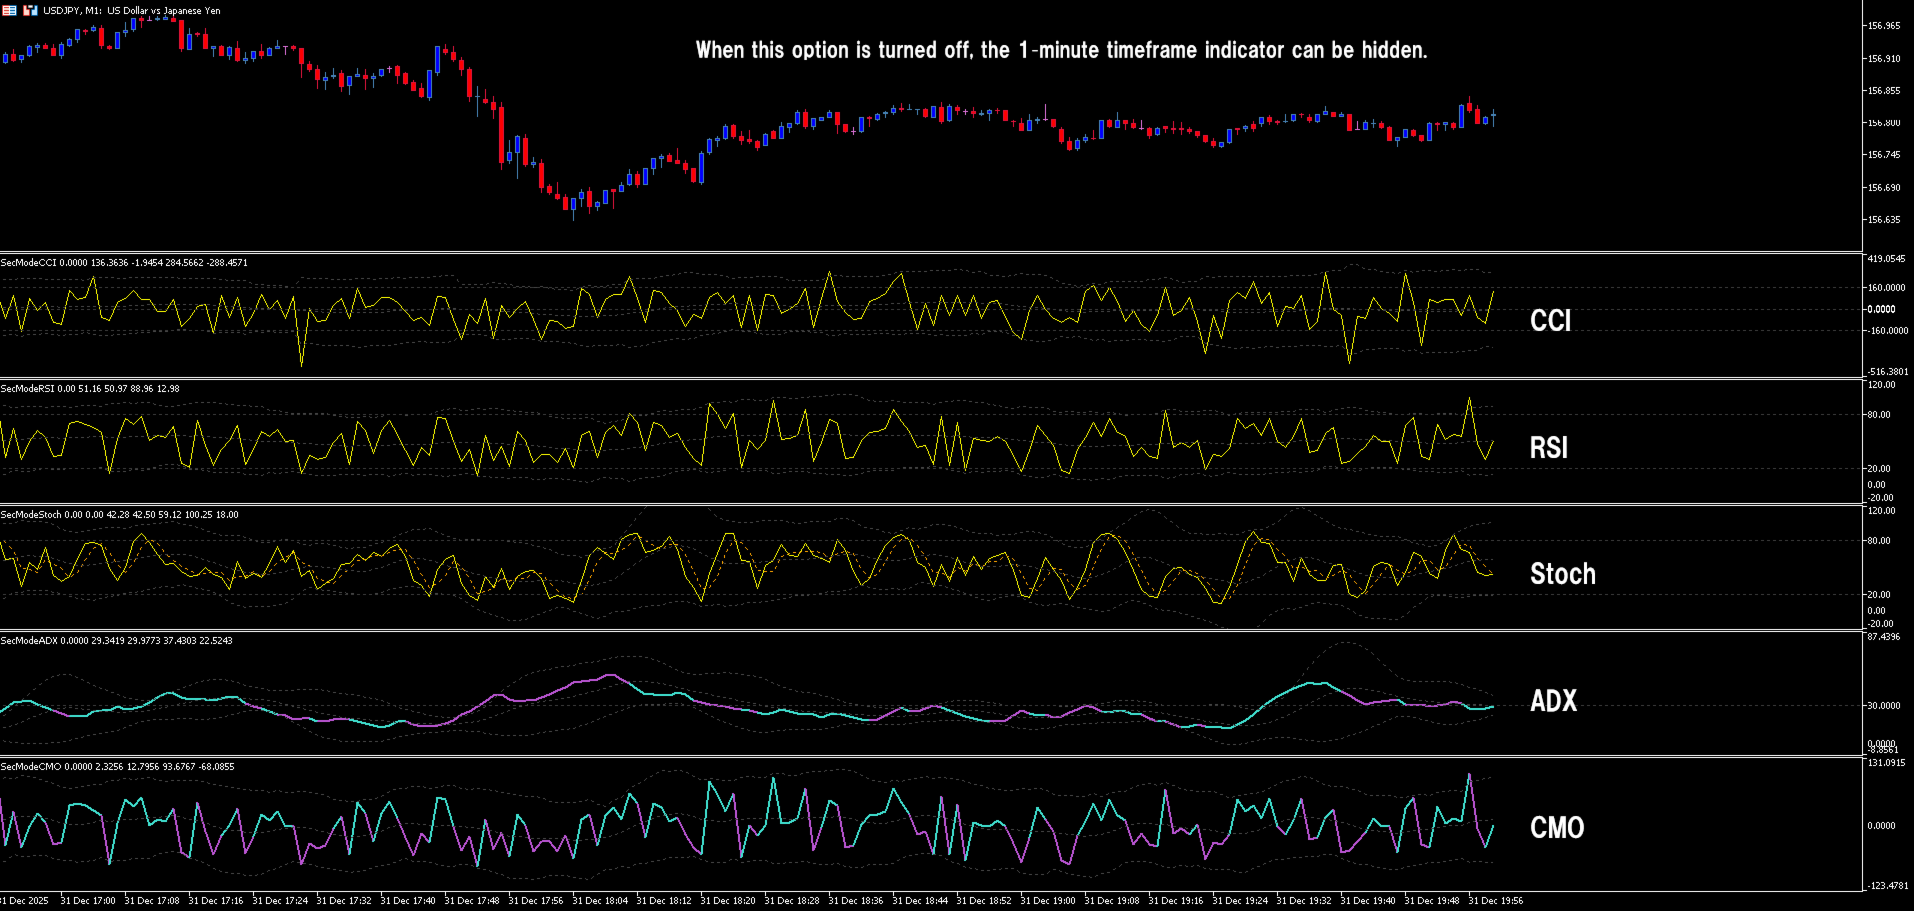
- Update up to 60 times per minute (or at user‑defined intervals)
- Visualize momentum, pressure, and turning points in real time
- Highlight divergences between standard timeframe (TF) and second‑level (Sec) signals
- Operate without custom symbols, ensuring a clean and lightweight setup
This delivers a high‑resolution market perspective that conventional tools are fundamentally unable to provide.
🎯 Key Features
① Tick‑Based Engine (No Custom Symbols Required)
Most second‑level indicators rely on:
- Custom symbol creation
- Saving and maintaining second‑level data
- Regenerating data when files become corrupted
- Heavy MT5 resource consumption
SecModeRSI avoids all of these issues.
It generates second‑level data internally from tick streams, offering:
- Fast and simple setup
- Clean chart integration
- Lightweight MT5 performance
- Stable operation even on VPS environments
② Dual‑Line Structure (TF × Sec)
By plotting both TF (standard timeframe) and Sec (second‑level) lines:
- The Sec line tends to reverse first
- The TF line follows afterward
This makes early momentum shifts visually obvious, giving traders a timing advantage for entries and exits.
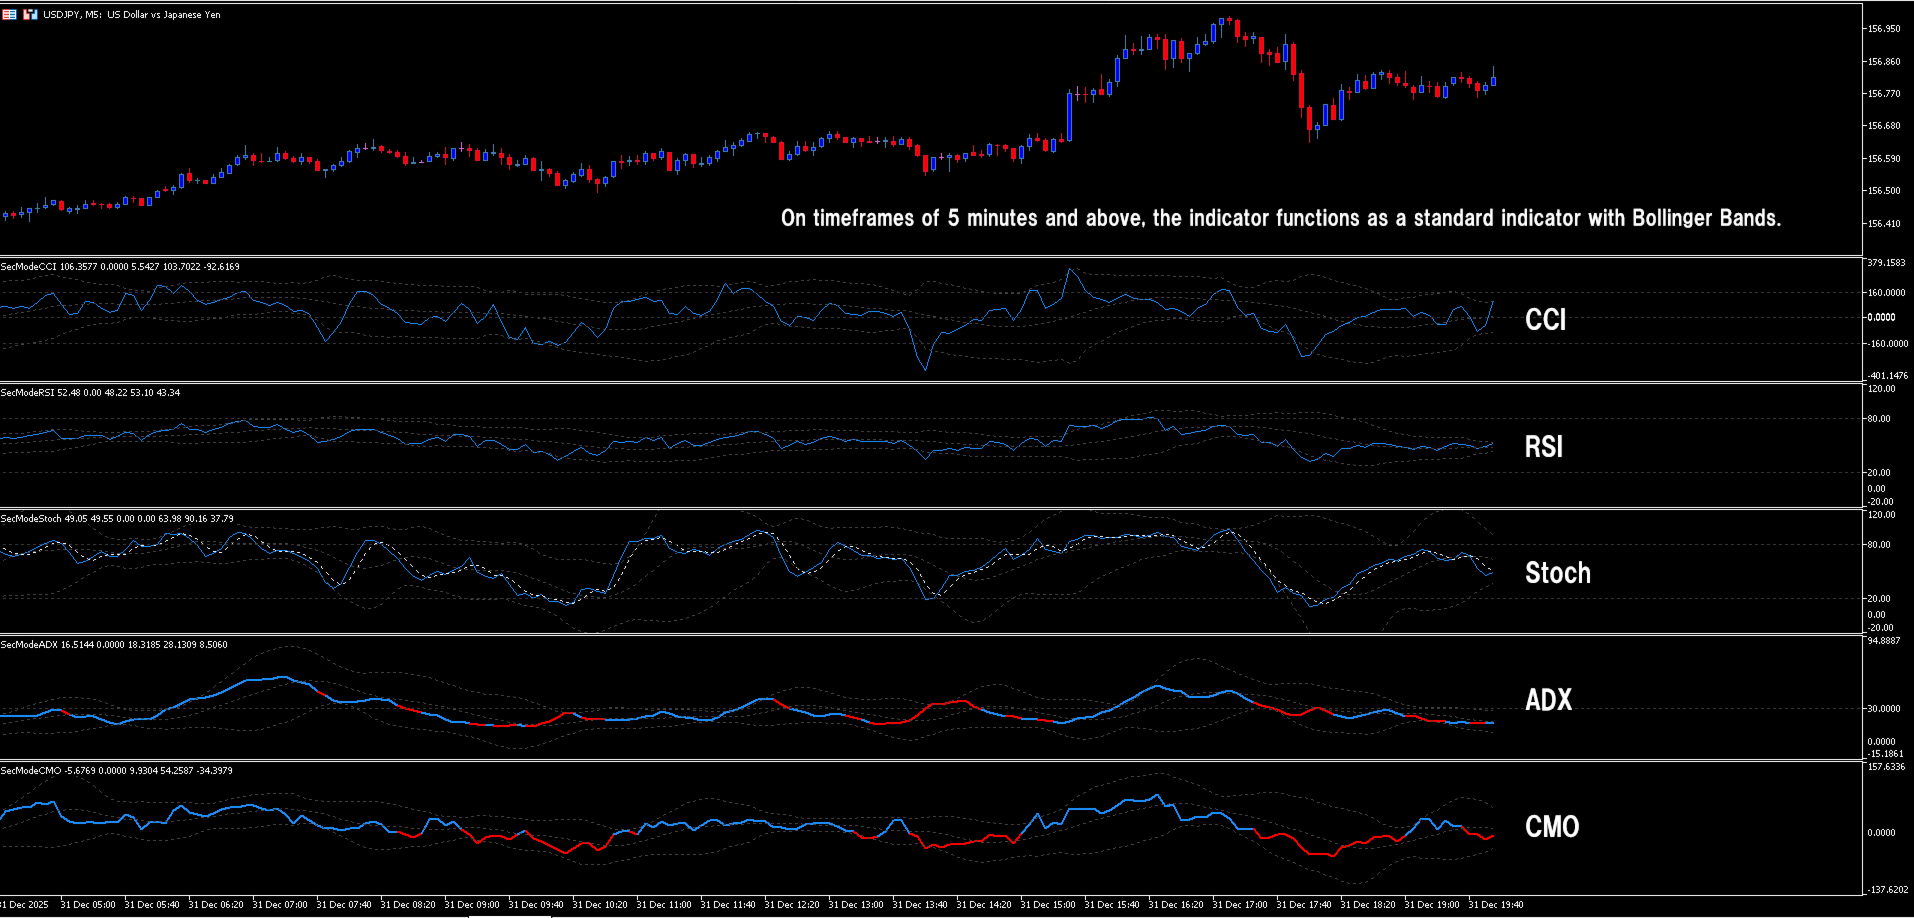
③ Bollinger Band Visualization of Momentum Extremes
Includes:
- CenterLine (switchable: ALMA / TMA / SMA)
- Upper / Lower Bands for overheat and reversal zones
When the Sec line breaks through the Bollinger Bands, it reveals explosive pressure points that standard indicators fail to detect.
④ Color Logic Exclusive to ADX & CMO
Only ADX and CMO use directional color logic:
- ADX: +DI / -DI dominance
- CMO: Upward / downward pressure
CCI, RSI, and Stochastic rely on waveform structure alone, so they intentionally do not use color changes.
⑤ No Repainting (Final Values Stay Final)
SecModeRSI draws second‑level values directly from tick data:
- Closed bars never change (no repainting)
- Open bars update rapidly in real time
This mirrors natural candlestick behavior and ensures transparent, trustworthy signals.
⑥ Unified UI Across the Entire Series
All SecMode indicators share the same interface and design philosophy:
- CCI (Sec)
- RSI (Sec)
- Stochastic (Sec)
- ADX (Sec, with color logic)
- CMO (Sec, with color logic)
This consistency makes multi‑indicator setups intuitive and seamless.
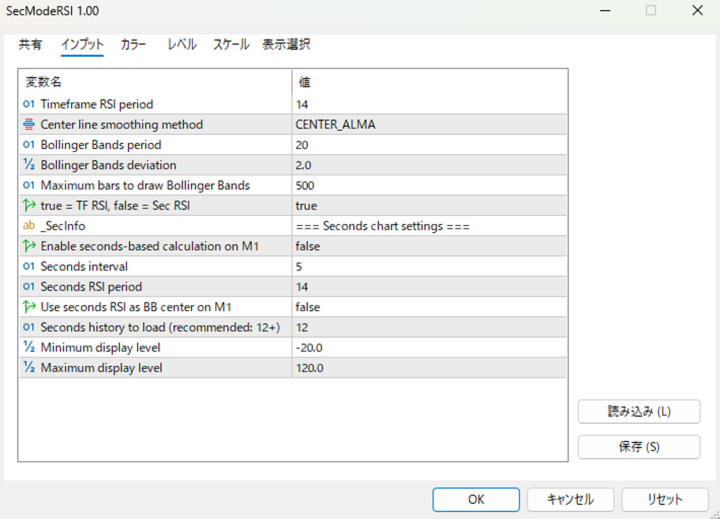
⑦ Three Selectable CenterLine Engines (Bollinger Band Core)
Switch among three engines depending on market conditions and trading style:
1. ALMA – Sniper Mode
- Ultra‑low latency with smoothness
- Fastest response of the three
- Ideal for scalpers targeting second‑level reversals
2. TMA – Cycle Mode
- Smoothest curve via double averaging
- Highlights market cycles and overextensions
- Excellent for rhythm recognition and counter‑trend setups
- Note: TMA naturally “follows” price until bar close—ideal for environment analysis
3. SMA – Benchmark Mode
- Most widely recognized moving average
- Reflects what the majority of traders watch
- Best for standard Bollinger Band behavior with second‑level refinement
🎁 About the Free Version
This free edition provides full access to the core second‑level engine and high‑resolution market visualization.
To keep the design streamlined, the following features are intentionally excluded:
- Signal generation
- Alert notifications
- Auto‑drawing tools
- Advanced filters
All essential functions—tick engine, TF/Sec divergence, Bollinger Band behavior—are fully available.
Use this streamlined core edition to experience how dramatically different the second‑level market truly is.
🧠 Usage Examples
- Sec color shift precedes TF → early signal detection (ADX/CMO)
- Sec pierces Bollinger Bands → momentum spike
- TF/Sec divergence → reversal anticipation
- CenterLine break → trend transition
🚀 Summary
- Tick‑based second‑level engine (no custom symbols)
- TF/Sec divergence becomes actionable entry logic
- Bollinger Bands reveal overheat and reversal zones
- Color logic exclusive to ADX / CMO
- No repainting (TMA naturally follows price until close)
- Unified UI across the SecMode Series
- Free access to a radically different market perspective
Experience a level of market detail that traditional indicators are fundamentally unable to deliver.