Trade Performance Dashboard

  • 지표
  • Quoc Tuan Ngo
    Quoc Tuan Ngo
    Welcome to my MQL5 profile!
    Hello! I am a developer and trader with a passion for building helpful MQL5 utilities. My goal is to create clean, professional tools that help you analyze your trading history and find your edge.
  • 버전: 1.0
  • 활성화: 10

you tired of exporting your trading history to Excel just to figure out your stats? Do you struggle to know if your EA is actually profitable, or if your manual trades are hurting your performance?

Stop guessing and start analyzing.

The Trade Performance Dashboard is a powerful, all-in-one utility that replaces guesswork with facts. It loads directly onto your chart and instantly analyzes your entire trading history, presenting all vital statistics in one clean, professional panel.


Finally, Know What Works!

The dashboard's most powerful feature is its Magic Number filter. For the first time, you can instantly separate the performance of your EAs, your manual trades, or any specific strategy.

Stop wondering if your bot is carrying your account or if your manual scalping is the problem. Now you will know for sure with a single click.


A 5-in-1 Analysis Tool

This single indicator provides five complete analysis views:

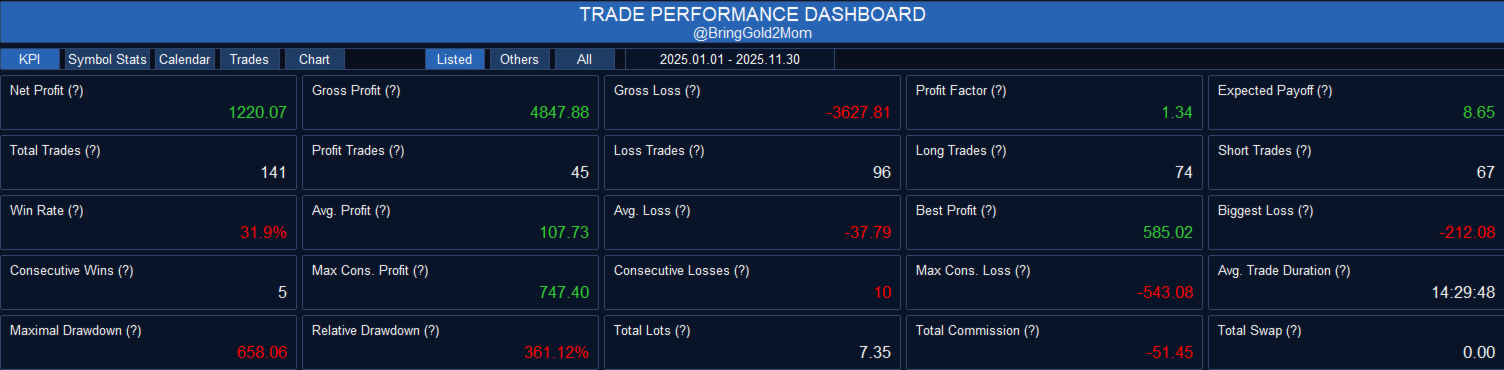
  1. KPI Dashboard: A stunning grid of 25 essential performance metrics. Your entire trading report at a glance.

  2. Symbol Stats: A detailed breakdown of your performance by each currency pair or symbol. Find out which pairs are your winners and which are your losers.

  3. Trades List: A complete, paginated log of every closed trade with details on PnL, commission, swap, lots, and points.

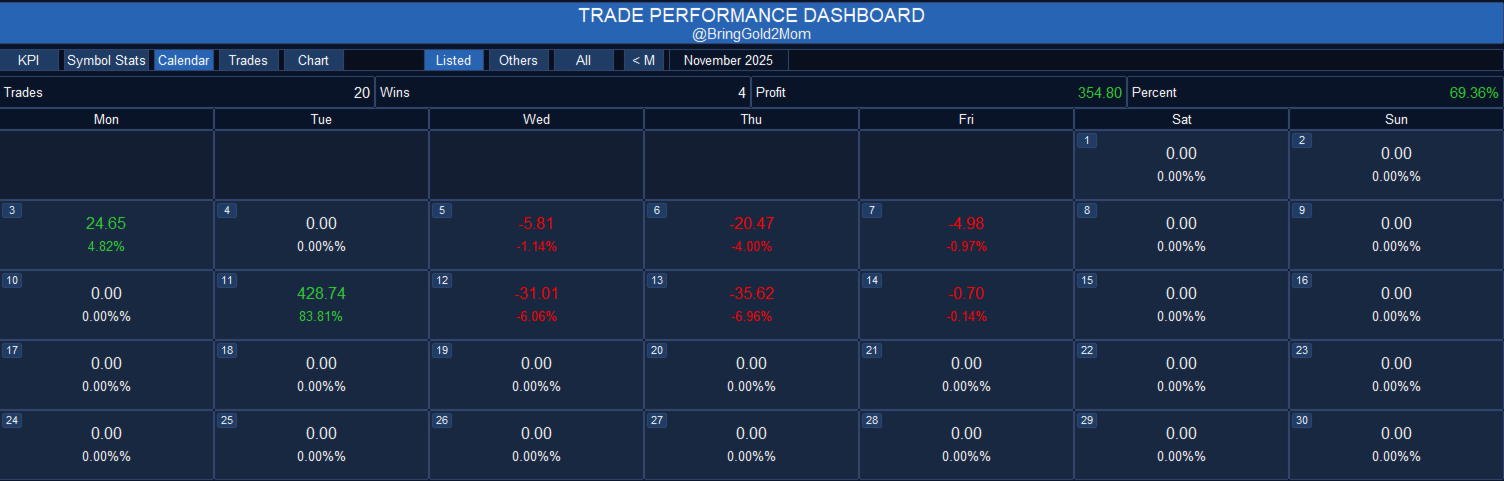
  4. Daily Calendar: A visual calendar of the month showing your profit or loss for each specific day. Identify your best and worst trading days.

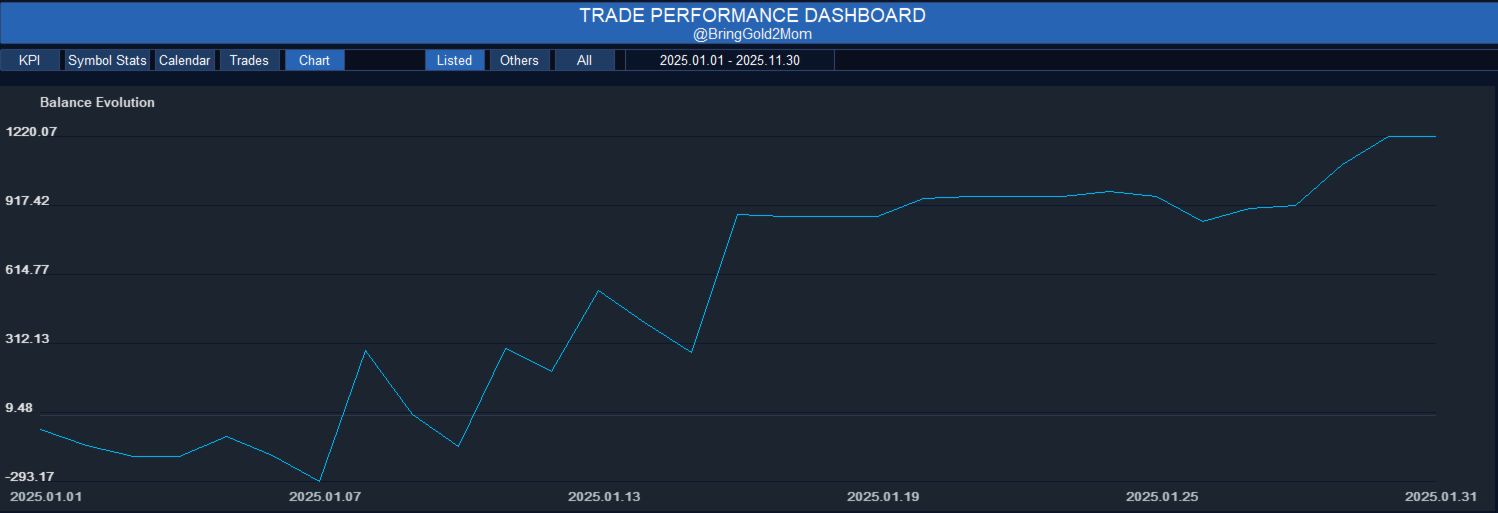
  5. Balance Chart: A beautiful equity curve showing your account's profit evolution over the selected period.


Understanding Your 25 KPIs

The main KPI tab gives you an instant, professional-grade report. We track everything that matters, including:

  • Profit Overview:

    • Net Profit: Your final bottom-line profit.

    • Gross Profit / Gross Loss: The total of all winning vs. all losing trades.

    • Profit Factor: How many times your profit exceeds your loss.

    • Expected Payoff: The average profit you can expect per trade.

  • Trade Statistics:

    • Total Trades: Total number of trades in the period.

    • Win Rate %: The percentage of your trades that were profitable.

    • Avg. Profit / Avg. Loss: The average amount you win on winning trades vs. lose on losing trades.

    • Best / Biggest: Your single best trade's profit and your single worst trade's loss.

  • Consecutive Trades:

    • Max Cons. Wins: Your longest winning streak.

    • Max Cons. Losses: Your longest losing streak.

    • Max Cons. Profit/Loss: The total money made or lost during those streaks.

  • Risk & Costs:

    • Maximal Drawdown: The largest peak-to-trough decline in your profit.

    • Relative Drawdown %: The largest percentage drop from your peak.

    • Total Lots: Total volume traded.

    • Total Commission / Total Swap: See exactly how much you are paying in costs.


How to Use

Using the dashboard is simple:

  1. Drag the indicator onto any chart in MT5.

  2. In the Inputs tab:

    • Enter the Magic Numbers you want to track, separated by a comma (e.g., "1001, 1002, 1003").

    • Set your Custom Start and End Date for the analysis (Format: YYYY.MM.DD).

  3. On the Chart:

    • Use the main buttons (KPI, Symbol Stats, Calendar, Trades, Chart) to switch between views .

    • Use the filter buttons ("Listed", "Others", "All") to instantly filter your performance data .


Magic Filter Explained

These buttons  control exactly which trades are included in the entire dashboard:

  • Listed (MODE_ONLY_LISTED):

    When pressed, the dashboard will ONLY show and calculate trades whose Magic Number exactly matches the list you provided in the InpMagicNumbers_CSV input. This is the perfect way to see the performance of your specific EAs.

  • Others (MODE_ONLY_OTHERS):

    When pressed, the dashboard will show all trades that are NOT in your "Listed" list. This is extremely useful for seeing the performance of:

    • Your manual trades (which usually have a Magic Number of 0).

    • Any other EAs that you did not include in the tracking list.

  • All (MODE_SHOW_ALL):

    Shows every single trade within the selected date range, regardless of its Magic Number.

추천 제품
Blahtech Market Profile MT5
Blahtech Limited
5 (10)
Was: $249  Now: $99   Market Profile defines a number of day types that can help the trader to determine market behaviour. A key feature is the Value Area, representing the range of price action where 70% of trading took place. Understanding the Value Area can give traders valuable insight into market direction and establish the higher odds trade. It is an excellent addition to any system you may be using. Inspired by Jim Dalton’s book “Mind Over Markets”, this indicator is designed to suit the
SMC Venom Model BPR 지표는 Smart Money(SMC) 개념 내에서 일하는 트레이더를 위한 전문 도구입니다. 가격 차트에서 두 가지 주요 패턴을 자동으로 식별합니다. FVG (공정 가치 갭)는 3개의 캔들의 조합으로, 첫 번째와 세 번째 캔들 사이에 갭이 있습니다. 이는 볼륨 지원이 없는 레벨 사이에 구역을 형성하여 종종 가격 수정으로 이어집니다. BPR (균형 가격 범위)은 두 개의 FVG 패턴의 조합으로, "브리지"를 형성합니다. 이는 가격이 낮은 볼륨 활동으로 움직일 때 브레이크아웃과 레벨로의 복귀 구역으로, 캔들 사이에 갭을 생성합니다. 이러한 패턴은 거래자가 차트에서 거래량과 가격 역학을 분석하여 주요 지지/저항 수준, 돌파 구역 및 진입 지점을 식별하는 데 도움이 되며, 여기서 대형 시장 참여자와 일반 참여자 간의 상호 작용이 발생합니다. 이 지표는 사각형과 화살표 형태로 패턴을 시각화하며 유연한 경고 설정도 지원합니다. 주요 특징: 패턴 표시 모드
Premium level Pro
Dmitriy Kashevich
Premium level is a unique indicator with more than 80% accuracy of correct predictions! This indicator has been tested for more than two months by the best Trading Specialists! The author's indicator you will not find anywhere else! From the screenshots you can see for yourself the accuracy of this tool! 1 is great for trading binary options with an expiration time of 1 candle. 2 works on all currency pairs, stocks, commodities, cryptocurrencies Instructions: As soon as the red arrow app
Noize Absorption Index
Ekaterina Saltykova
Noize Absorption Index - is the manual trading system that measures the difference of pressure between bears forces and bulls forces. Green line - is a noize free index that showing curent situation. Zero value of index shows totally choppy/flat market.Values above zero level shows how powerfull bullish wave is and values below zero measures bearish forces.Up arrow appears on bearish market when it's ready to reverse, dn arrow appears on weak bullish market, as a result of reverse expectation.
Before installing the HeatMap indicator make sure you are using a broker that gives you access to the Depth of market (DOM) !! This indicator creates a heatmap on your chart allowing you to see the buy or sell limit orders easily and in real time. You have the possibility to change the setting and the colors of the HeatMap in order to adapt to all markets and all charts. Here is an example of a setting you can use with the NASDAQ100 on the AMPGlobal broker :  https://www.youtube.com/watch?v=x0Y
PZ Mean Reversion MT5
PZ TRADING SLU
3 (2)
평균 회귀 거래에 대한 전문적이고 정량적인 접근 방식을 구현하는 고유한 지표입니다. 이는 가격이 예측 가능하고 측정 가능한 방식으로 평균으로 전환되고 반환된다는 사실을 이용하여 비정량적 거래 전략을 훨씬 능가하는 명확한 진입 및 퇴장 규칙을 허용합니다. [ Installation Guide | Update Guide | Troubleshooting | FAQ | All Products ] 명확한 거래 신호 놀랍도록 쉬운 거래 사용자 정의 가능한 색상 및 크기 성능 통계 구현 대부분의 거래 전략을 능가합니다. 적절한 SL 및 TP 레벨을 표시합니다. 이메일/음향/시각 알림을 구현합니다. 작동 원리 이 지표는 더 높은 기간에서 완전히 사용자 정의 가능한 이동 평균 주변의 표준 편차를 측정하고 추세 추종 접근 방식을 사용하여 정확하게 거래를 찾습니다. 거래는 현재 차트의 가격 동작을 살펴보고 선택한 더 높은 기간에서 계산된 평균 가격대로 가격이 돌아오면 닫힙니다. 코딩 방식 때문에 지
RBreaker
Zhong Long Wu
RBreaker Gold Indicators는 금 선물을 위한 단기 데이 트레이딩 전략으로, 추세 추종과 데이 내 반전의 두 가지 거래 방식을 결합합니다. 추세 장에서 수익을 포착할 수 있을 뿐만 아니라, 시장이 반전될 때 적시에 이익을 확정하고 추세에 맞춰 반대 포지션을 잡을 수 있습니다. 이 전략은 미국 잡지 Futures Truth에서 15년 연속으로 가장 수익성 높은 트레이딩 전략 상위 10위 안에 선정되었습니다. 긴 라이프사이클을 자랑하며, 현재까지 국내외에서 널리 사용되고 연구되고 있습니다. 본 지표는 2026년 금 선물의 움직임을 반영하여 14일 ATR 지표를 기반으로 돌파 계수 A, 관찰 계수 B, 반전 계수 R을 보다 합리적인 값으로 정의했습니다. 매우 훌륭한 지표이며, 안정적인 연간 수익성을 달성했습니다. 강력히 추천합니다~ 위 지표는 변동성이 높은 상품에 적합하며, 매개변수는 금 선물, 주가 지수 선물 등에 적합합니다. 다른 상품이 필요한 경우 돌파 계수 A
Trend Master V2
Oratile Pitsoane
What Is Trend Master Pro? Trend Master Pro   is a professional-grade trend trading indicator built for MetaTrader 5. It was designed with one goal in mind — to keep you on the right side of the market at all times by combining three powerful technical tools into a single, clean, easy-to-read display directly on your price chart. Instead of cluttering your screen with multiple separate indicators, Trend Master Pro fuses an   EMA Ribbon trend filter , a   ZigZag swing point engine , and a   breako
Here   our more valuable tools SMC Trend Trading   ,  Easy SMC Trading  ,  Institutional SMC Architect Volume Analysis Tools  ,  Volume flow Profile  ,  Market volume profile  , FVG with Volume  , Liquidity Heatmap Profile  ,  Volume Spread Analysis The    Liquidity Heatmap   is a sophisticated institutional trading tool designed to reveal where over-leveraged traders are trapped. By calculating estimated liquidation levels based on volume spikes and leverage, this indicator draws a dynamic "h
MR Volume Profile 5
Sergey Khramchenkov
The "MR Volume Profile 5" indicator is a charting tool that displays trading volume at different price levels rather than time intervals. A key concept in volume profile is the point of control (POC)—the price level with the highest volume traded during the session or time range. While tools like VWAP or OBV provide volume trends, the "MR Volume Profile 5" indicator offers granular detail about where the most market activity occurs at specific price levels. This makes it a more precise tool for
Max Min Delta Indicator - Market Volume Imbalance Analysis Gain Deeper Insights into Market Volume Imbalance with Delta Analysis What is the Max Min Delta Indicator? The Max Min Delta Indicator is a powerful market volume analysis tool that visually represents maximum and minimum delta values using a histogram. It helps traders identify market strength, weakness, absorption, and aggressive buying/selling activity with precision. Key Features Histogram Visualization: Displays Max Delta (Green) an
BoxChart MT5
Evgeny Shevtsov
5 (7)
The market is unfair if only because 10% of participants manage 90% of funds. An ordinary trader has slim changes to stand against these "vultures". This problem can be solved. You just need to be among these 10%, learn to predict their intentions and move with them. Volume is the only preemptive factor that faultlessly works on any timeframe and symbol. First, the volume appears and is accumulated, and only then the price moves. The price moves from one volume to another. Areas of volume accumu
Pullback Hunter
Anton Polkovnikov
PULLBACK HUNTER What is every trader's cherished dream? To see without delay the places where the reversal will happen. This, of course, is from the category of magic, though... nothing is impossible. But for now I've prepared for you an indicator that marks in real time the end of corrections to the current movement or in short - catches pullbacks.What is the main point? Many people practice rebounds when the price moves in the direction of the open position. And they do them on the formation o
Price Magnet — Price Density and Attraction Levels Indicator Price Magnet is a professional analytical tool designed to identify key support and resistance levels based on statistical Price Density. The indicator analyzes a specified historical period and detects price levels where the market spent the most time. These zones act as “magnets,” attracting price action or forming a structural base for potential reversals. Unlike traditional Volume Profile tools, Price Magnet focuses on price-time d
Crash 1000 Scalping Indicator for the Crash 1000 Deriv Synthetic Index. Introduction The Crash 1000 Scalping Indicator is a specialized tool designed for the Crash 1000 index on the Deriv Synthetic market. This indicator is particularly useful for scalping on the M1 timeframe, helping traders to identify precise entry and exit points for buy positions. It is designed to be non-repainting, providing clear signals with audible alerts and push notifications, and is compatible with mobile devices th
Trade smarter, not harder: Empower your trading with Harmonacci Patterns This is arguably the most complete harmonic price formation auto-recognition indicator you can find for the MetaTrader Platform. It detects 19 different patterns, takes fibonacci projections as seriously as you do, displays the Potential Reversal Zone (PRZ) and finds suitable stop-loss and take-profit levels. [ Installation Guide | Update Guide | Troubleshooting | FAQ | All Products  ] It detects 19 different harmonic pric
Your Trend Friend
Luigi Nunes Labigalini
5 (1)
The trend is your friend! Look at the color of the indicator and trade on that direction. It does not  repaint. After each candle is closed, that's the color of the trend. You can focus on shorter faster trends or major trends, just test what's most suitable for the symbol and timeframe you trade. Simply change the "Length" parameter and the indicator will automatically adapt. You can also change the color, thickness and style of the lines. Download and give it a try! There are big movements w
Has rsi signal
Evgenii Savinov
HAS RSI Signal — SL/TP 자동 계산 기능이 포함된 전문 트렌드 지표 HAS RSI Signal 은 검증된 클래식 지표와 현대적인 노이즈 필터링 알고리즘을 결합한 강력한 트레이딩 도구입니다. 이 지표는 Heiken Ashi Smoothed (HAS) 캔들과 RSI 오실레이터를 통해 시장을 분석하며, 추세 반전이나 과매수/과매도 구간 이탈 시 트레이더에게 명확한 진입 신호를 제공합니다. 주요 장점: 이중 필터링: Heiken Ashi Smoothed를 사용하여 시장의 '노이즈'를 제거하고, RSI를 통해 모멘텀의 강도를 확인합니다. 자동 레벨 계산: 단순히 신호만 주는 것이 아니라, 변동성( ATR )을 기반으로 최적의 손절매(Stop Loss) 및 이익 실현(Take Profit) 레벨을 자동으로 계산합니다. 시각적 편의성: 신호가 차트 위에 컬러 캔들 형태로 직접 표시되어 복잡하지 않고 직관적으로 추세를 파악할 수 있습니다. 알림 시스템: 터미널 알람, 사운드, 스마
SPECIAL LAUNCH OFFER: $30 (1-Month Rent) Limited time offer to build our community and gather feedback! AmbM GOLD Institutional Scalper A high-precision M5 algorithm for XAUUSD (Gold) , engineered to trade exclusively at Institutional Liquidity Levels ($5/$10 psychological marks). PERFORMANCE DATA (BUY ONLY) • Win Rate: 87.09%. • Safe Growth: +$4,113 profit on $10k (13.75% Max Drawdown). • Extreme Stress Test: Successfully generated +$22,997 in a 5-year stress test (2020-2026), proving
Trades History Visualizer is a MetaTrader 5 indicator that displays your trading history directly on the chart, providing a clear visual representation of past trades with additional information. Key Features: Visual trade history display with entry arrows Entry, Stop Loss, and Take Profit horizontal lines Color-coded connector lines between entry and exit points (green for profit, red for loss) Risk-Reward ratio display for each closed trade Profit/Loss amount display option Pip display option
Gioteen Volatility Index (GVI) - your ultimate solution to overcoming market unpredictability and maximizing trading opportunities. This revolutionary indicator helps you in lowering your losing trades due to choppy market movements. The GVI is designed to measure market volatility, providing you with valuable insights to identify the most favorable trading prospects. Its intuitive interface consists of a dynamic red line representing the volatility index, accompanied by blue line that indicate
SMC Smart Flow Pro
Thitipong Nookhunthod
Short Description: SMC Smart Flow Pro is an advanced Smart Money Concept indicator that automatically detects Break of Structure (BOS), Change of Character (CHoCH), and projects precise TP/SL target levels on all timeframes — built for serious traders who trade with institutional flow. Full Description: SMC Smart Flow Pro is a premium Smart Money Concept (SMC) indicator for MetaTrader 5, engineered for traders who want to trade alongside institutional order flow. By automatically mapping m
숫자 시퀀스 중 하나를 "산불 시퀀스"라고 합니다. 가장 아름다운 새로운 시퀀스 중 하나로 인식되었습니다. 주요 특징은 이 시퀀스가 ​​가장 짧은 경우에도 선형 추세를 피한다는 것입니다. 이 지표의 기초를 형성한 것은 이 속성입니다. 금융 시계열을 분석할 때 이 지표는 가능한 모든 추세 옵션을 거부하려고 합니다. 그리고 그가 실패하는 경우에만 그는 추세의 존재를 인식하고 적절한 신호를 제공합니다. 이 접근 방식을 통해 새로운 트렌드가 시작되는 순간을 정확하게 결정할 수 있습니다. 그러나 거짓 긍정도 가능합니다. 숫자를 줄이기 위해 이 표시기에 추가 필터가 추가되었습니다. 새 막대가 열리면 신호가 생성됩니다. 어떤 경우에도 다시 그리기가 발생하지 않습니다. 표시 매개변수: Applied Price   - 적용된 가격 상수. Period Main   - 표시기의 기본 기간, 유효한 값은 5 - 60 이내입니다. Period Additional   - 추가 기간, 이 매개변수의 유효한
Introduction to the Manual Backtesting Indicator on MQL5 The MetaTrader platform provides an excellent backtesting tool for evaluating Expert Advisors (EAs). However, when it comes to manually backtesting a strategy to assess its effectiveness, this tool has some limitations: You cannot manually draw zones or trend lines while in backtesting mode. You cannot switch timeframes to check time alignment. For example, if my strategy requires additional confirmation from a higher timeframe (HTF), this
DYJ BoS
Daying Cao
DYJ BoS 지표는 다음을 포함하여 시장 구조 변화의 필수 요소를 자동으로 식별하고 표시합니다. 구조 돌파(BoS): 가격이 크게 움직여 이전 구조 지점을 돌파할 때 감지됩니다. 상승 추세선과 하락 추세선(UP & DN, 즉 연속적인 신고가와 신저가)을 표시하고, 가격이 이러한 선을 돌파하면 빨간색(BEAR)과 초록색(BULL) 화살표를 표시합니다. BoS는 일반적으로 가격이 이전 가격 움직임에 의해 확립된 스윙 저점이나 스윙 고점을 확실히 통과할 때 발생합니다. 가격이 스윙 하이보다 높거나 스윙 로우보다 낮게 움직일 경우, 이는 단순히 이전에 형성된 시장 구조를 깨는 것이므로 "브레이크아웃" 구조라고 합니다. 이는 종종 시장 심리와 추세 방향의 변화를 나타내며, 기존 추세가 지속되거나 새로운 추세가 시작됨을 알립니다. 일반적으로 마감 정확도를 높이기 위해 손절매와 이익실현을 설정하지 않는 것이 좋습니다. 최종 포지션은 일반적으로 같은 방향의 다음 돌파점에서 마감되거나 반
Volume Profile for MetaTrader 5 Price movement alone does not explain where the market is actually traded . What matters is where volume is built and how these areas shift over time. This Volume Profile displays the volume distribution directly on the chart , making it clear which price levels were accepted by the market and where rejection occurred. This allows structurally relevant zones to be identified and integrated into individual decision-making processes. The tool is designed for high pe
Provided Trend
Nadiya Mirosh
Provided Trend is a complex signal formation indicator. As a result of the work of internal algorithms, you can see only three types of signals on your chart. The first is a buy signal, the second is a sell signal, and the third is a market exit signal. Options: CalcFlatSlow - The first parameter that controls the main function of splitting the price chart into waves. CalcFlatFast - The second parameter that controls the main function of splitting the price chart into waves. CalcFlatAvg - Para
##   ONLY GOLD ##   Тiльки Золото ## **Mercaria Professional Trading Zones - Complete Guide** ## **Mercaria Professional Trading Zones - Повний посібник** ### **How Mercaria Zones Work / Як працюють зони Mercaria** **English:** Mercaria Zones is an advanced trading indicator that identifies high-probability support and resistance areas using ZigZag extremes combined with mathematical zone calculations. The indicator works on multiple timeframes simultaneously, providing a comprehensive view
Volume Profile Canvas
Mauro Italo Gaspari
Volume Profile Canvas - Professional Volume Profile Indicator for MetaTrader 5 DESCRIPTION Volume Profile Canvas is a professional volume profile indicator for MetaTrader 5 that renders directly on the chart using a high-performance Canvas engine. It calculates and displays the volume distribution across price levels, identifying the Point of Control (POC), Value Area High (VAH) and Value Area Low (VAL) in real time. This is a pure analysis tool. It does not trade. It gives you an instant vi
표시기는 현재 시세를 작성하여 과거 시세와 비교할 수 있으며 이를 바탕으로 가격 변동을 예측합니다. 표시기에는 원하는 날짜로 빠르게 이동할 수 있는 텍스트 필드가 있습니다. 옵션: 기호 - 표시기가 표시할 기호 선택. SymbolPeriod - 지표가 데이터를 가져올 기간 선택. IndicatorColor - 표시기 색상. HorisontalShift - 지시자가 그린 따옴표를 지정된 막대 수만큼 이동합니다. Inverse - true는 인용 부호를 반대로, false - 원래 보기를 반전합니다. ChartVerticalShiftStep - 차트를 수직으로 이동합니다(키보드의 위/아래 화살표). 다음은 날짜를 입력할 수 있는 텍스트 필드의 설정으로, '엔터'를 누르면 즉시 이동할 수 있습니다.
이 제품의 구매자들이 또한 구매함
Neuro Poseidon MT5
Daria Rezueva
4.96 (28)
Neuro Poseidon is a new indicator by Daria Rezueva. It combines precise trading signals with adaptive TP/SL levels - creating best possible trades as a result! Message me and get  Neuro Poseidon Assistant  as a gift to automize your trading process! What makes it stand out? 1. Proven profitability on all assets and timeframes 2. Only confirmed BUY and SELL signals present on the chart 3. Adaptive TP & SL levels generated by the software for each trade 4. Easy to understand - suitable for al
Divergence Bomber
Ihor Otkydach
4.9 (90)
이 지표를 구매하신 분께는 다음과 같은 혜택이 무료로 제공됩니다: 각 거래를 자동으로 관리하고, 손절/익절 수준을 설정하며, 전략 규칙에 따라 거래를 종료하는 전용 도우미 툴 "Bomber Utility" 다양한 자산에 맞게 지표를 설정할 수 있는 셋업 파일(Set Files) "최소 위험", "균형 잡힌 위험", "관망 전략" 모드로 설정 가능한 Bomber Utility의 셋업 파일 이 전략을 빠르게 설치, 설정, 시작할 수 있도록 돕는 단계별 영상 매뉴얼 주의: 위의 모든 보너스를 받기 위해서는 MQL5 개인 메시지 시스템을 통해 판매자에게 연락해 주세요. 독창적인 커스텀 지표인 “Divergence Bomber(다이버전스 봄버)”를 소개합니다. 이 지표는 MACD 다이버전스(괴리) 전략을 기반으로 한 올인원(All-in-One) 거래 시스템입니다. 이 기술 지표의 주요 목적은 가격과 MACD 지표 간의 다이버전스를 감지하고, **향후 가격이 어느 방향으로 움직일지를 알려주는
Quantum TrendPulse
Bogdan Ion Puscasu
5 (25)
SuperTrend   ,   RSI   ,   Stochastic   의 힘을 하나의 포괄적인 지표로 결합하여 트레이딩 잠재력을 극대화하는 궁극의 트레이딩 도구   인 Quantum TrendPulse를   소개합니다. 정밀성과 효율성을 추구하는 트레이더를 위해 설계된 이 지표는 시장 추세, 모멘텀 변화, 최적의 진입 및 종료 지점을 자신 있게 식별하는 데 도움이 됩니다. 주요 특징: SuperTrend 통합:   주요 시장 추세를 쉽게 따라가고 수익성의 물결을 타세요. RSI 정밀도:   매수 과다 및 매도 과다 수준을 감지하여 시장 반전 시점을 파악하는 데 적합하며 SuperTrend 필터로 사용 가능 확률적 정확도:   변동성이 큰 시장에서 숨겨진 기회를 찾기 위해 확률적 진동   을 활용하고 SuperTrend의 필터로 사용 다중 시간대 분석:   M5부터 H1 또는 H4까지 다양한 시간대에 걸쳐 시장을 최신 상태로 유지하세요. 맞춤형 알림:   맞춤형 거래 조건이 충족되면
SignalTech MT5
Yue Wang
5 (26)
SignalTech is an unique fully rule based trading system delivers an Institutional approach for both Independent Traders and Prop Firm Challengers. Never Repaint. Push Notification available. No over-optimization. All the winning trades with chart setups are published on the comments page. 2026-05 4107 Pips (Until 05-29 NY Closed) 2026-04 2243 Pips 2026-03 2165 Pips 2026-02 2937 Pips 2026-01 2624 Pips 2025-12 1174 Pips It can generate signals with Buy/Sell Arrows, Push Notification (To Mobile) an
PrimeScalping
Temirlan Kdyrkhan
PrimeScalping is a powerful trading companion designed to generate high-probability entry signals with dynamic TP/SL/DP levels based on volatility. Built-in performance tracking shows win/loss stats, PP1/PP2 hits, and success rates — all updated live. Key Features: Buy/Sell signals with adaptive volatility bands Real-time TP/SL/DP levels based on ATR Built-in MA Filter with optional ATR/StdDev volatility Performance stats panel (Success, Profit/Loss, PP1/PP2) Alerts via popup, sound, push, or e
소개       Quantum Breakout PRO   , 브레이크아웃 존 거래 방식을 변화시키는 획기적인 MQL5 지표! 13년 이상의 거래 경험을 가진 숙련된 트레이더 팀이 개발한       퀀텀 브레이크아웃 PRO       혁신적이고 역동적인 브레이크아웃 존 전략으로 거래 여정을 새로운 차원으로 끌어올리도록 설계되었습니다. Quantum Breakout Indicator는 5개의 이익 목표 영역이 있는 브레이크아웃 영역의 신호 화살표와 브레이크아웃 상자를 기반으로 한 손절 제안을 제공합니다. 초보자 거래자와 전문 거래자 모두에게 적합합니다. Quantum EA 채널:       여기를 클릭하세요 중요한! 구매 후 설치 매뉴얼을 받으려면 개인 메시지를 보내주십시오. 추천: 기간: M15 통화쌍: GBPJPY, EURJPY, USDJPY,NZDUSD, XAUUSD 계정 유형: 스프레드가 매우 낮은 ECN, Raw 또는 Razor 브로커 시간: GMT +3 중개인 :
Meridian Pro
Ottaviano De Cicco
5 (2)
Meridian Pro 2.00: Professional Multi-Timeframe Trend Matrix for MT5 Meridian Pro 2.00 is a professional adaptive trend matrix for MetaTrader 5. It combines the original Meridian trend engine, a clean chart ribbon, closed-bar signal arrows, an 8-timeframe dashboard, Fuel momentum, weighted consensus, synthetic HTF processing and chart-native higher-timeframe context lines. The goal is simple: read current trend, multi-timeframe structure, strength, momentum and EA-ready state from one discipline
UZFX {SSS} 스캘핑 스마트 시그널 MT5는 급변하는 시장에서 정확한 실시간 시그널을 필요로 하는 스캘퍼, 데이 트레이더, 스윙 트레이더를 위해 설계된 리페인팅 없는 고성능 트레이딩 지표입니다. (UZFX-LABS)에서 개발한 이 지표는 가격 움직임 분석, 추세 확인, 스마트 필터링 기능을 결합하여 모든 통화 쌍과 시간대에서 확률이 높은 매수 및 매도 시그널을 생성합니다. 추천* 최적 시간대: 15분 이상. {1시간}이 제가 가장 선호하는 시간대입니다. 그리고 그 결과는 정말 놀라울 정도입니다...! 참고: { LTL 164343 } 지표와 함께 사용하면 신호 적중률을 높일 수 있습니다. LTL 신호를 통해 추세를 파악하고, SSS 신호를 진입 신호로 활용하세요. 이 접근 방식은 승률을 극대화하고 오신호를 방지하는 데 도움이 됩니다. 주요 기능 스마트 신호 감지 – 강력한 추세 반전 및 지속 패턴을 정밀하게 식별합니다. 다중 시간대 스캘핑 – 모든 시간대에서 완벽하게 작동
SmartScalping
Temirlan Kdyrkhan
SmartScalping is a powerful trading companion designed to generate high-probability entry signals with dynamic TP/SL/DP levels based on volatility. Built-in performance tracking shows win/loss stats, PP1/PP2 hits, and success rates — all updated live. Key Features: Buy/Sell signals with adaptive volatility bands Real-time TP/SL/DP levels based on ATR Built-in MA Filter with optional ATR/StdDev volatility Performance stats panel (Success, Profit/Loss, PP1/PP2) Alerts via popup, sound, push, or e
ARIPoint
Temirlan Kdyrkhan
1 (1)
ARIPoint is a powerful trading companion designed to generate high-probability entry signals with dynamic TP/SL/DP levels based on volatility. Built-in performance tracking shows win/loss stats, PP1/PP2 hits, and success rates all updated live. Key Features: Buy/Sell signals with adaptive volatility bands Real-time TP/SL/DP levels based on ATR Built-in MA Filter with optional ATR/StdDev volatility Performance stats panel (Success, Profit/Loss, PP1/PP2) Alerts via popup, sound, push, or email Cu
이 제품은 2026년 시장에 맞게 업데이트되었으며 최신 MT5 빌드에 최적화되었습니다. 가격 업데이트 안내: Smart Price Action Concepts는 현재 $200 에 제공됩니다. 다음 30회 구매 후 가격은 $299 로 인상됩니다. 특별 혜택: 구매 후 저에게 개인 메시지를 보내시면 무료 보너스 + 선물 을 받을 수 있습니다. 먼저, 이 트레이딩 도구는 리페인트 없음, 재그리기 없음, 지연 없음의 인디케이터이므로 전문적인 트레이딩에 적합하다는 점을 강조하고 싶습니다. Online course , and manual Smart Price Action Concepts Indicator는 초보자와 경험 많은 트레이더 모두에게 매우 강력한 도구입니다. 20개 이상의 유용한 인디케이터를 하나로 결합하고, Inner Circle Trader Analysis와 Smart Money Concepts Trading Strategies 같은 고급 트레이딩 아이디어를 통합합니다. 이 인디
TrendProMaster
Temirlan Kdyrkhan
MasterTrend Indicator for MT5 A powerful trend-following and signal-evaluation tool MasterTrend   is a custom MT5 indicator that combines Moving Averages and ATR-based risk/reward logic to generate clear buy/sell signals. It visualizes dynamic SL/TP levels, evaluates past trade outcomes, and displays win/loss statistics in a clean on-chart panel. Key features include: Buy/Sell signals based on MA crossovers ATR-based SL/TP1/TP2/TP3 levels with visual lines and labels Signal outcome tracking wit
Azimuth Pro
Ottaviano De Cicco
5 (7)
Azimuth Pro V2: Synthetic Fractal Structure and Confirmed Entries for MT5 Overview Azimuth Pro is a multi-level swing structure indicator by Merkava Labs . Four nested swing layers, swing-anchored VWAP, ABC pattern detection, three-timeframe structural filtering, and closed-bar confirmed entries — one chart, one workflow from micro-swings to macro-cycles. This is not a blind signal product. It is a structure-first workflow for traders who care about location, context, and timing. V2 Launch Offe
ScalpPoint
Temirlan Kdyrkhan
ScalpPoint is a powerful trading companion designed to generate high-probability entry signals with dynamic TP/SL/DP levels based on volatility. Built-in performance tracking shows win/loss stats, PP1/PP2 hits, and success rates — all updated live. Key Features: Buy/Sell signals with adaptive volatility bands Real-time TP/SL/DP levels based on ATR Built-in MA Filter with optional ATR/StdDev volatility Performance stats panel (Success, Profit/Loss, PP1/PP2) Alerts via popup, sound, push, or emai
RelicusRoad Pro MT5
Relicus LLC
4.96 (24)
RelicusRoad Pro: 퀀트 시장 운영 체제 70% 할인 평생 이용권 (한정 시간) - 2,000명 이상의 트레이더와 함께하세요 왜 대부분의 트레이더는 "완벽한" 지표를 가지고도 실패할까요? 진공 상태에서 단일 개념 만으로 거래하기 때문입니다. 문맥 없는 신호는 도박입니다. 지속적인 승리를 위해서는 컨플루언스(중첩) 가 필요합니다. RelicusRoad Pro는 단순한 화살표 지표가 아닙니다. 완전한 퀀트 시장 생태계 입니다. 독점적인 변동성 모델링을 사용하여 가격이 이동하는 "공정 가치 로드"를 매핑하고, 단순 노이즈와 실제 구조적 돌파를 구분합니다. 추측은 그만두세요. 기관급 로드 로직으로 거래를 시작하세요. 핵심 엔진: "Road" 알고리즘 시스템의 중심에는 시장 상황에 실시간으로 적응하는 동적 변동성 채널인 Road Algo 가 있습니다. 세이프 라인(평형) 과 가격이 수학적으로 반전될 가능성이 높은 확장 레벨 을 투영합니다. Simple Road: 일반적인 시장을 위
Meravith MT5
Ivan Stefanov
5 (1)
마켓 메이커를 위한 도구. Meravith는 다음과 같은 기능을 제공합니다: 모든 타임프레임을 분석하고 현재 유효한 추세를 표시합니다. 강세와 약세 거래량이 동일한 유동성 구간(거래량 균형 구간)을 강조 표시합니다. 서로 다른 타임프레임의 모든 유동성 레벨을 차트에 직접 표시합니다. 텍스트 기반 시장 분석을 생성하여 참고용으로 제공합니다. 현재 추세를 기반으로 목표가, 지지선 및 손절가를 계산합니다. 거래의 위험 대비 보상 비율(Risk/Reward)을 계산합니다. 계좌 잔고에 따라 포지션 크기를 산출하고 잠재 수익을 추정합니다. 시장에 중대한 변화가 발생할 경우 경고도 제공합니다. 지표의 주요 라인: 강세/약세 거래량 소진 라인 — 목표가로 사용됩니다. 시장 추세를 나타내는 라인. 시장이 강세인지 약세인지에 따라 색상이 변경되며 추세 지지선 역할을 합니다. 색상은 주로 시장 심리를 보여줍니다. 거래량 균형선(Eq). Eq(Volume Equilibrium) 라인은 시스템의 핵심입니
MasterTrend
Temirlan Kdyrkhan
MasterTrend Indicator for MT5 A powerful trend-following and signal-evaluation tool MasterTrend   is a custom MT5 indicator that combines Moving Averages and ATR-based risk/reward logic to generate clear buy/sell signals. It visualizes dynamic SL/TP levels, evaluates past trade outcomes, and displays win/loss statistics in a clean on-chart panel. Key features include: Buy/Sell signals based on MA crossovers ATR-based SL/TP1/TP2/TP3 levels with visual lines and labels Signal outcome tracking wit
MetaForecast M5
Vahidreza Heidar Gholami
5 (3)
MetaForecast는 가격 데이터의 조화를 기반으로 모든 시장의 미래를 예측하고 시각화합니다. 시장이 항상 예측 가능한 것은 아니지만 가격에 패턴이 있다면 MetaForecast는 가능한 정확하게 미래를 예측할 수 있습니다. 다른 유사한 제품과 비교했을 때, MetaForecast는 시장 동향을 분석하여 더 정확한 결과를 생성할 수 있습니다. 입력 매개변수 Past size (과거 크기) MetaForecast가 미래 예측을 생성하기 위한 모델을 만드는 데 사용하는 막대의 수를 지정합니다. 모델은 선택한 막대 위에 그려진 노란색 선으로 표시됩니다. Future size (미래 크기) 예측해야 할 미래 막대의 수를 지정합니다. 예측된 미래는 핑크색 선으로 표시되며 그 위에 파란색 회귀선이 그려집니다. Degree (차수) 이 입력은 MetaForecast가 시장에서 수행할 분석 수준을 결정합니다. Degree 설명  0 차수 0의 경우, "Past size" 입력에 모든 봉우리와
ACB Breakout Arrows MT5
KEENBASE SOFTWARE SOLUTIONS
3.5 (2)
ACB Breakout Arrows 지표는 특별한 돌파 패턴을 감지하여 시장에서 중요한 진입 신호를 제공합니다. 이 지표는 차트를 지속적으로 스캔하면서 한 방향으로 움직임이 자리 잡을 때를 포착하여 큰 움직임 직전에 정확한 진입 신호를 제공합니다. 다중 종목 및 다중 시간대 스캐너는 여기에서 확인하세요 - ACB Breakout Arrows MT5용 스캐너 핵심 기능 지표가 자동으로 손절(Stop Loss) 및 익절(Take Profit) 수준을 제공합니다. 모든 시간대의 돌파 신호를 추적하는 MTF 스캐너 대시보드 포함. 데이 트레이더, 스윙 트레이더 및 스캘퍼에게 적합합니다. 신호 정확도를 높이기 위해 최적화된 알고리즘 사용. 손익분기점 또는 빠른 수익 목표를 위한 특별한 라인 (Quick Profit Line) 제공. 승률, 성공 비율, 평균 수익 등의 성과 분석 지표 제공. 재도색 없음. 신호는 고정되어 신뢰할 수 있습니다. 거래 확인 - ACB Trade Filter 지
KT Alpha Hunter Arrows MT5
KEENBASE SOFTWARE SOLUTIONS
대부분의 화살표 인디케이터는 신호만 보여주고, 나머지 판단은 모두 트레이더에게 맡깁니다. KT Alpha Hunter Arrows는 완성된 트레이딩 플랜을 제공합니다. 각 신호 화살표가 표시될 때마다 진입선, 손절선, 네 개의 익절 목표, 그리고 현재 심볼과 시간대가 지금 거래할 가치가 있는지 알려주는 실시간 엣지 판정이 함께 그려집니다. 포함된 Trade Manager EA는 사용자가 직접 진입한 뒤의 실행 관리를 맡아, 시장이 흔들리고 감정이 개입되기 쉬운 상황에서도 거래 원칙을 유지할 수 있도록 도와줍니다. 리페인트 없음. 종가 확정 후 신호만 표시. Forex, Gold, Indices 및 사용자가 거래하는 다양한 MT5 지원 상품에 맞게 설계되었습니다. 주요 기능 캔들이 마감된 후에만 표시되는 리페인트 없는 매수 및 매도 화살표. 각 신호마다 진입선, 구조적 손절선, 네 개의 익절 목표 표시. 현재 차트에서 매수와 매도 셋업을 별도로 평가하는 Edge Dashboard.
Btmm state engine pro
Garry James Goodchild
5 (5)
BTMM State Engine Pro is a MetaTrader 5 indicator for traders who use the Beat The Market Maker approach: Asian session context, kill zone timing, level progression, peak formation detection, and a multi-pair scanner from a single chart. It combines cycle state logic with a built-in scanner dashboard so you do not need the same tool on many charts at once. What it does Draws the Asian session range; session times can follow broker server offset or be set in inputs. Tracks level progression (L
Current event:  https://c.mql5.com/1/326/A2SR2025_NoMusic.gif MT5용 A2SR 지표: 자동화된 실제 수요 및 공급(S/R). + 거래 상품. Product description in English here. --   Guidance   : -- at   https://www.mql5.com/en/blogs/post/734748/page4#comment_16532516 -- and  https://www.mql5.com/en/users/yohana/blog 더욱 스마트한 거래 결정을 위한 강력하고, 정확하며, 시간 절약적인 기능 + EA 호환 객체. 주요 장점 선행 실제 SR 레벨(지연 또는 재표시 없음) 2014년부터 MT4 에서 수년간 입증된 신뢰성을 바탕으로 A2SR이 이제 MetaTrader 5에서도 사용 가능합니다. 가격이 도달하기 전에 실제 지지선과 저항선을 식별하는 선행적이고 재표시 없는 지표를 통해 트레이더에
ARICoins
Temirlan Kdyrkhan
ARICoin is a powerful trading companion designed to generate high-probability entry signals with dynamic TP/SL/DP levels based on volatility. Built-in performance tracking shows win/loss stats, PP1/PP2 hits, and success rates all updated live. Key Features: Buy/Sell signals with adaptive volatility bands Real-time TP/SL/DP levels based on ATR Built-in MA Filter with optional ATR/StdDev volatility Performance stats panel (Success, Profit/Loss, PP1/PP2) Alerts via popup, sound, push, or email Cust
Trend Forecaster
Alexey Minkov
5 (8)
Trend Forecaster – Since 2023. The Trend Forecaster indicator utilizes a unique proprietary algorithm to determine entry points for a breakout trading strategy. The indicator identifies price clusters, analyzes price movement near levels, and provides a signal when the price breaks through a level. The Trend Forecaster indicator is suitable for all financial assets, including currencies (Forex), metals, stocks, indices, and cryptocurrencies. You can also adjust the indicator to work on any time
ICT PO3 (Power of 3) AMD Protocol Framework Indicator True Time & Structure Integration   |  Non-Repainting | Real-Time  | Multi-Asset  | MT4 Version Available Full Setup Guide & Strategy Playbook: https://www.mql5.com/en/blogs/post/768683 MT4 Version: https://www.mql5.com/en/market/product/171742 Indicator Overview The ICT PO3 AMD Protocol Framework is a complete structural overlay for MetaTrader 5 that maps the True Daily Cycle directly onto your lower-timeframe execution chart. It projects
Precision Spike Detector
Francisco Mandomo Simbine
5 (1)
Precision Spike Detector V3 – Institutional-Grade AI Trading System Attention: The price increases by US$50 for every 10 purchases.  Final price: US$599 Precision Spike Detector V3   is a   state-of-the-art, institutional-grade market analysis system   for   MetaTrader 5 , designed to detect   high-probability market movements   in synthetic indices such as   Boom, Crash, GainX, and PainX . After purchase, please contact me through the MQL5 messaging system to receive the order management tool
Grabber System MT5
Ihor Otkydach
4.83 (23)
탁월한 기술적 지표인 Grabber를 소개합니다. 이 도구는 즉시 사용 가능한 “올인원(All-Inclusive)” 트레이딩 전략으로 작동합니다. 하나의 코드 안에 강력한 시장 기술 분석 도구, 매매 신호(화살표), 알림 기능, 푸시 알림이 통합되어 있습니다. 이 인디케이터를 구매하신 모든 분들께는 다음의 항목이 무료로 제공됩니다: Grabber 유틸리티: 오픈 포지션을 자동으로 관리하는 도구 단계별 영상 매뉴얼: 설치, 설정, 그리고 실제 거래 방법을 안내 맞춤형 세트 파일: 인디케이터를 빠르게 자동 설정하여 최고의 성과를 낼 수 있도록 도와줍니다 다른 전략은 이제 잊어버리세요! Grabber만이 여러분을 새로운 트레이딩의 정점으로 이끌어 줄 수 있습니다. Grabber 전략의 주요 특징: 거래 시간 프레임: M5부터 H4까지 거래 가능한 자산: 어떤 자산이든 사용 가능하지만, 제가 직접 테스트한 종목들을 추천드립니다 (GBPUSD, GBPCAD, GBPCHF, AUDCAD, AU
OmniSync Projection
Antonio-alin Teculescu
5 (1)
Chronos Fractal Engine is an innovative price projection indicator for MetaTrader 5, designed to transform your technical analysis by intelligently identifying and projecting historical price patterns. Built upon an advanced correlation algorithm and the fractal principles of the market, this powerful tool visualizes potential future price movements, giving you a unique edge in your trading decisions. What is Chronos Fractal Engine? At its core, the Chronos Fractal Engine employs a sophisticat
AriX
Temirlan Kdyrkhan
1 (4)
AriX Indicator for MT5 A powerful trend-following and signal-evaluation tool AriX is a custom MT5 indicator that combines Moving Averages and ATR-based risk/reward logic to generate clear buy/sell signals. It visualizes dynamic SL/TP levels, evaluates past trade outcomes, and displays win/loss statistics in a clean on-chart panel. Key features include: Buy/Sell signals based on MA crossovers ATR-based SL/TP1/TP2/TP3 levels with visual lines and labels Signal outcome tracking with real-time stat
Gem SIGNAL
Shengzu Zhong
5 (1)
GEM Signal Pro GEM Signal Pro는 MetaTrader 5용 추세추종형 지표로, 차트에서 더 명확한 신호, 더 구조적인 트레이드 설정, 그리고 더 실용적인 리스크 관리를 원하는 트레이더를 위해 설계되었습니다. 단순한 화살표만 표시하는 것이 아니라, GEM Signal Pro는 전체 트레이드 아이디어를 더 깔끔하고 읽기 쉬운 방식으로 보여줍니다. 조건이 확인되면 진입가, 손절가, 목표가를 차트에 표시하여 트레이더가 설정을 더 효율적으로 검토할 수 있도록 도와줍니다. 작동 방식 이 지표는 먼저 내부 로직에 따라 유효한 초기 신호를 식별합니다. 확인 조건이 충족되면, GEM Signal Pro는 차트에 전체 설정을 표시합니다. 이를 통해 트레이더는 거래 구조를 더 명확하게 보고, 수동 분석 작업을 줄일 수 있습니다. 차트에 표시되는 거래 레벨 확인된 신호에 대해, GEM Signal Pro는 다음을 표시할 수 있습니다. 진입가 손절가 목표가 1 목표가 2 목표가 3 손
필터:
리뷰 없음
리뷰 답변