FlatLevels
- 지표
- 버전: 1.3
- 업데이트됨: 17 10월 2020
- 활성화: 5
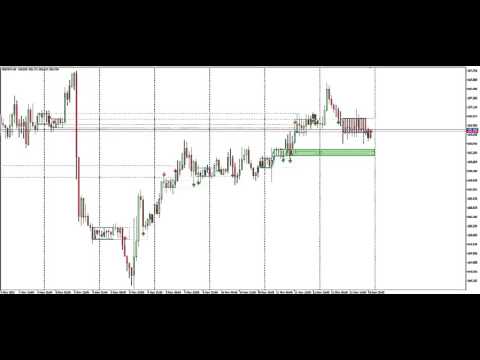
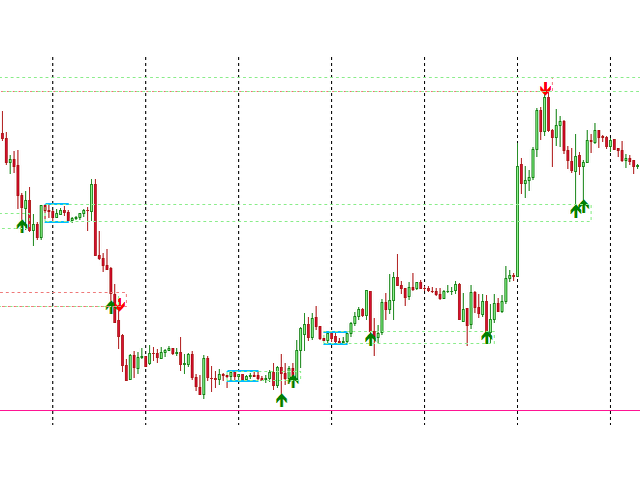
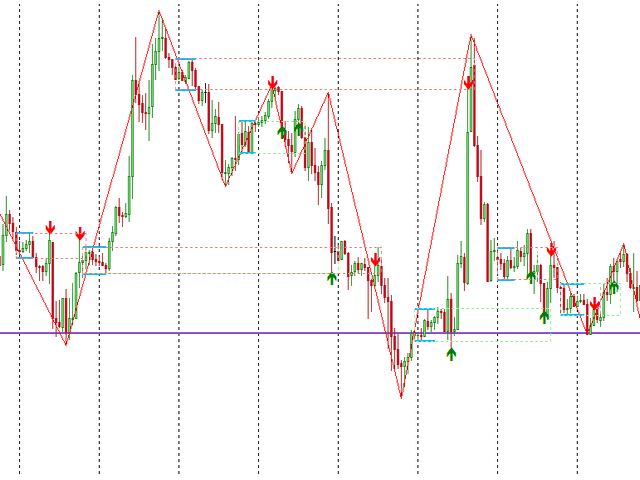
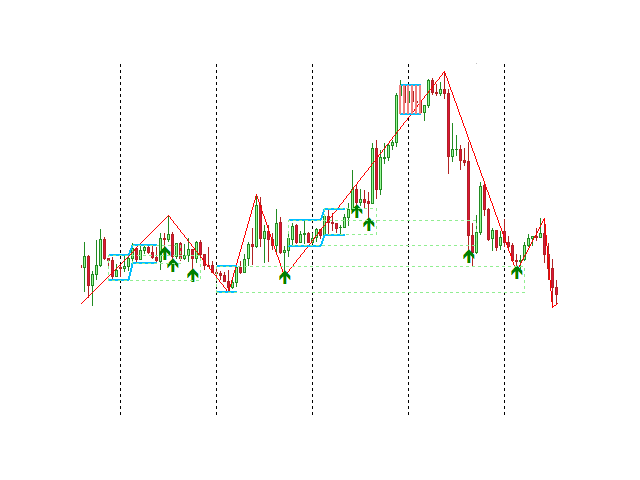
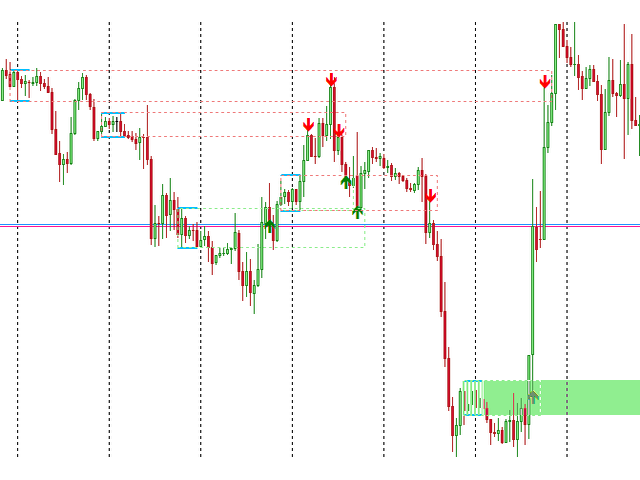
The indicator looks for flat zones, where the price remained within a certain range for quite a long time.
Settings
- History - history for calculation/display in bars
- FlatBars - flat area width in bars
- FlatRange - flat area height in pips
- IncludeSmallBar - calculate using internal flat bars
- CalcFlatType - calculate flat zones by (HIGH_LOW/OPEN_CLOSE)
- DistanceForCheck - distance (in pips) from the flat level, at which the check is enabled
- CountSignals - amount of signals per level
- AutoCalcRange - height auto calculation (auto calculate a flat zone height)
- AutoCalcPeriod - height auto calculation period in bars
- ShowFillBars - fill bars (on/off)
Notification Settings
- ShowSignalLevel - display the levels, at which the signal appeared
- UseAlert - use audio alert (on/off)
- SoundFileName - .wav file: (file name in the \Sounds\ terminal folder)
Level Display Settings
- ShowLevels - display flat levels (on/off)
- HowManyLevels - amount of the last zones: flat zones used to build the levels
- FillLevel - fill the level (on/off)
- ColorBuyLevel - buy level color
- ColorSellLevel - sell level color