Drawing Assistance MT5
- 지표
-
Sopheak Khlot
 저는 전업 외환 트레이더이자 MQL 개발자입니다. EA 개발 서비스를 제공합니다.
무료 지표 및 EA: https://t.me/bestforexscript - 버전: 1.1
- 업데이트됨: 1 3월 2025
- 활성화: 5
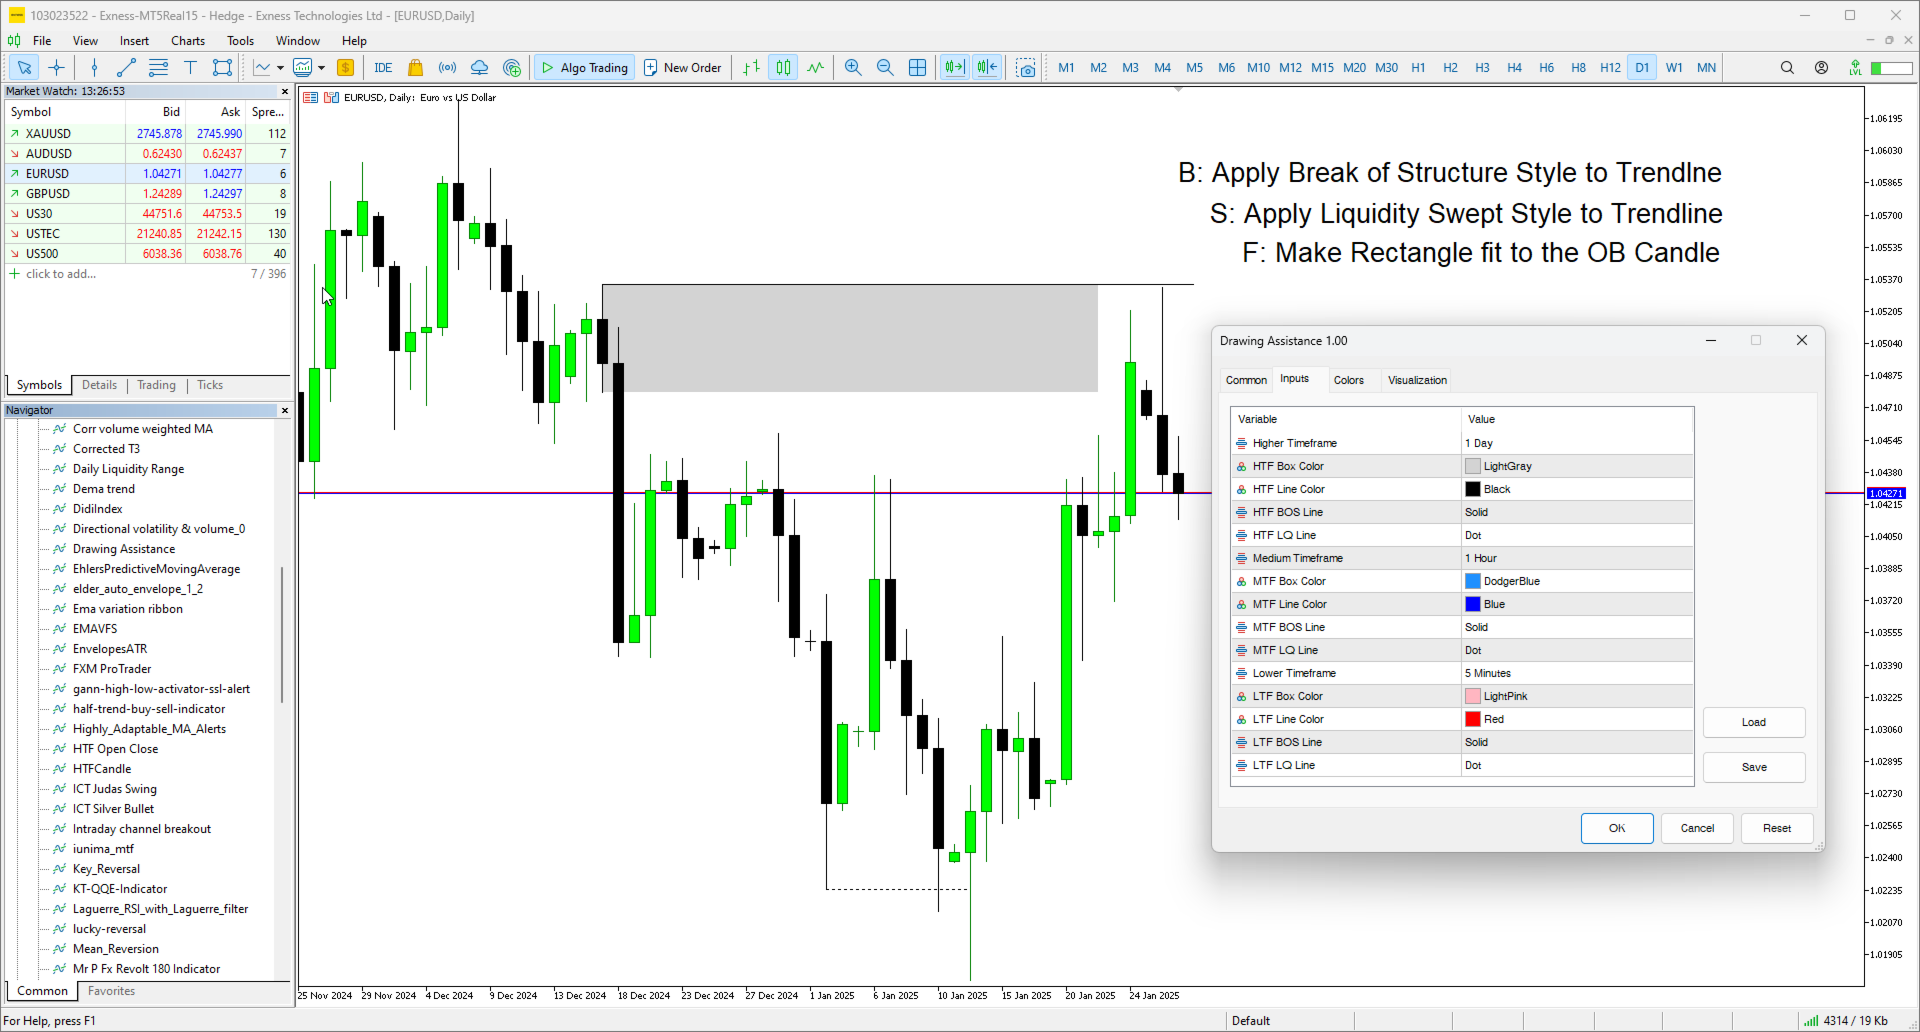
As an ICT or SMC trader you must do top-down analysis, and you struggle to make template of drawing object on Metatrader just like you normally do on Tradingview. Well, Drawing Assistance indicator will make your top-down analysis much easier on Metatrader.
- Allow to design template for 3 timeframes. (HTF, MTF and LTF).
- Each objects drawn on chart will have the color, style and visibility individually by the timeframe it was drawn on.
- Save time as all analyzing is done on Metatrader chart.
Shortcut Keys:
- Key B: Apply the BOS style to a Trendline
- Key L: Apply the Liquidity Swept style to a Trendline
- Key O: Apply the Order Block (Box) to a Rectangle by fitting to the High and Low of the candle.
- Key F: Apply the FVG (Box) to a Rectangle buy fitting to the High/Low of the first candle and to the Low/High of the third candle.

Could you please add CHoCH (Change of Character) as well? It's a crucial element in SMC when identifying market structure shifts. That would make the tool even more complete. Thank you. If it includes BOS, CHoCH, Buy OB, and Sell OB labels, this would be an absolutely amazing indicator. I’d definitely recommend it to my friends Would it be possible to add support for one more timeframe?