Triplet Cloud MTF MT4
- 지표
-
Sopheak Khlot
 저는 전업 외환 트레이더이자 MQL 개발자입니다. EA 개발 서비스를 제공합니다.
무료 지표 및 EA: https://t.me/bestforexscript - 버전: 1.1
- 업데이트됨: 2 5월 2025
- 활성화: 10
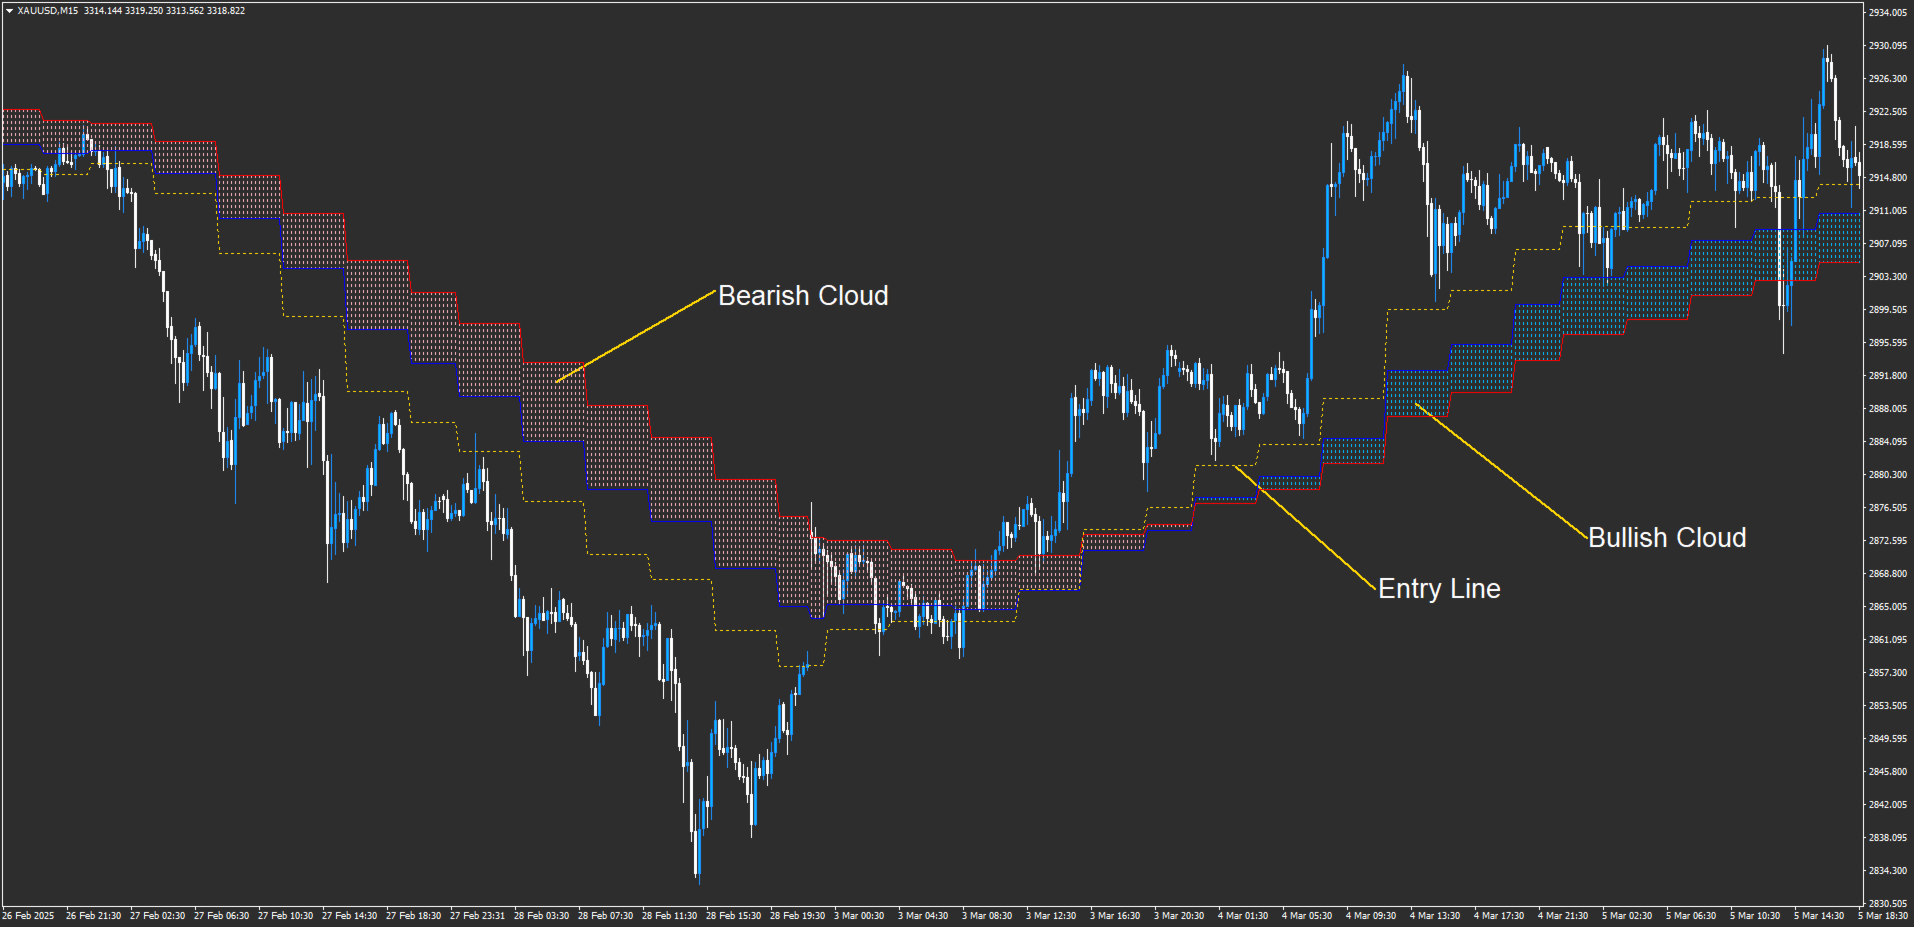
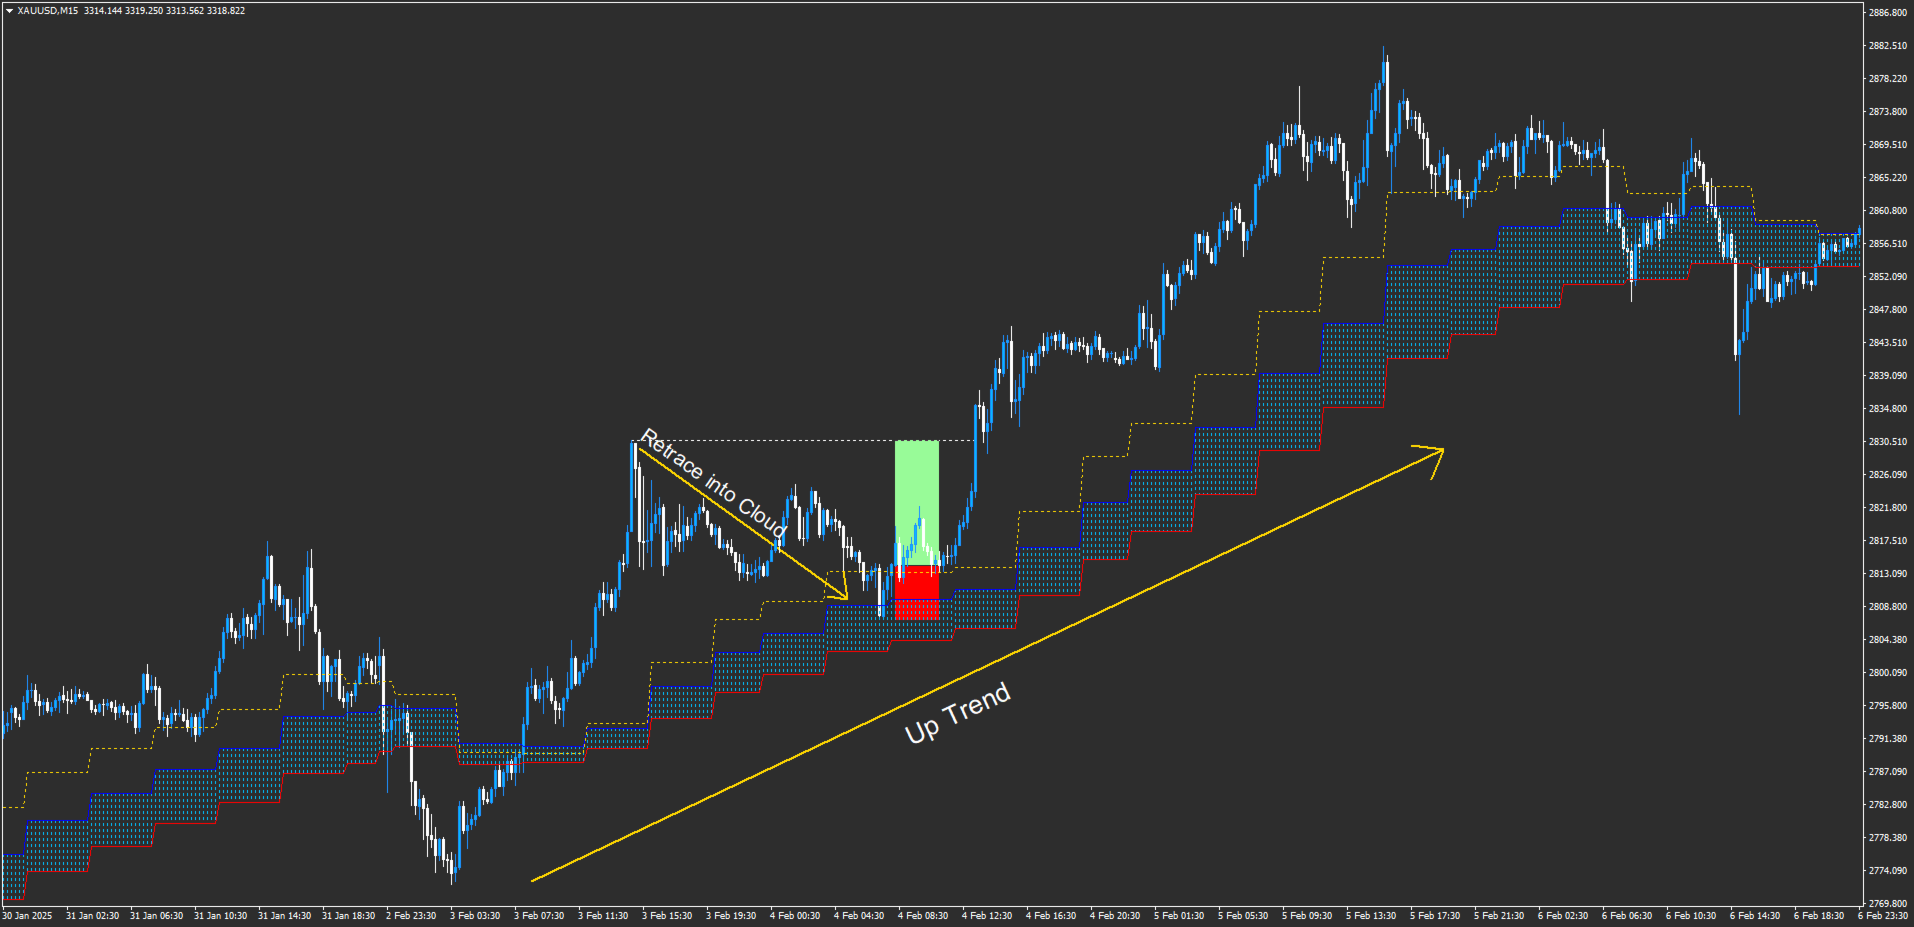
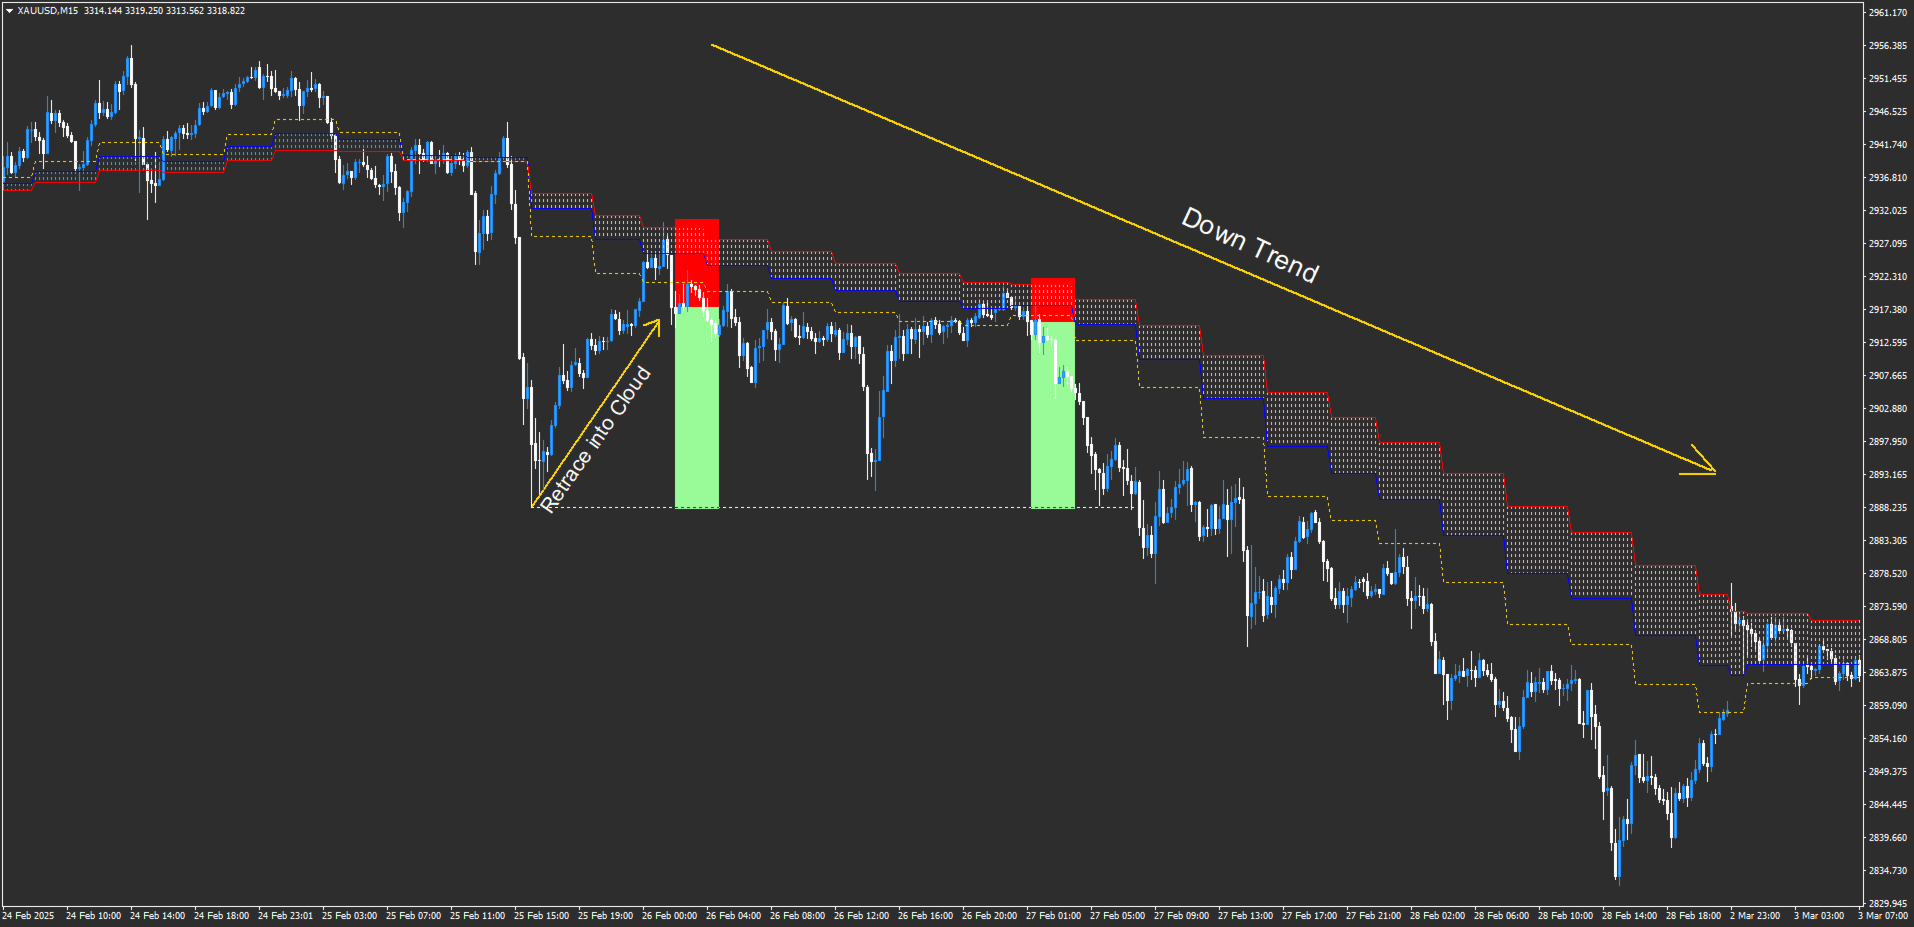
Triplet Cloud MTF is an indicator for trend-following strategy. It presents the trend in HTF from the LTF Chart that allows traders focus on looking for trade entry in the right direction and increase striking rate.
It comes with simple input setup. You will only need to choose HTF you want to follow its trend and set the alert setup, then all is set.
Here are the mostly selected HTF setup for each of entry timeframe:
- M1 Entry : M15 Trend
- M5 Entry : H1 Trend
- M15 Entry : H4 Trend
- H1 Entry : D1 Trend
- H4 Entry : W1 Trend