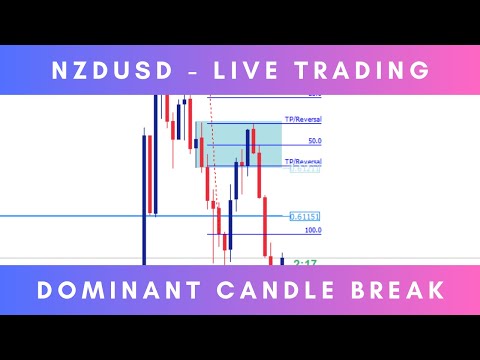
Dominant Candle Finder MT5
- 지표
-
Suvashish Halder
 💧 PRO TIP - Don't Open Orders Where You See, Open Them Where Others Can't!
📈 Decoding Market Phases Like Never Before – The SuvashishFx Revolution! - 버전: 1.0
- 활성화: 10
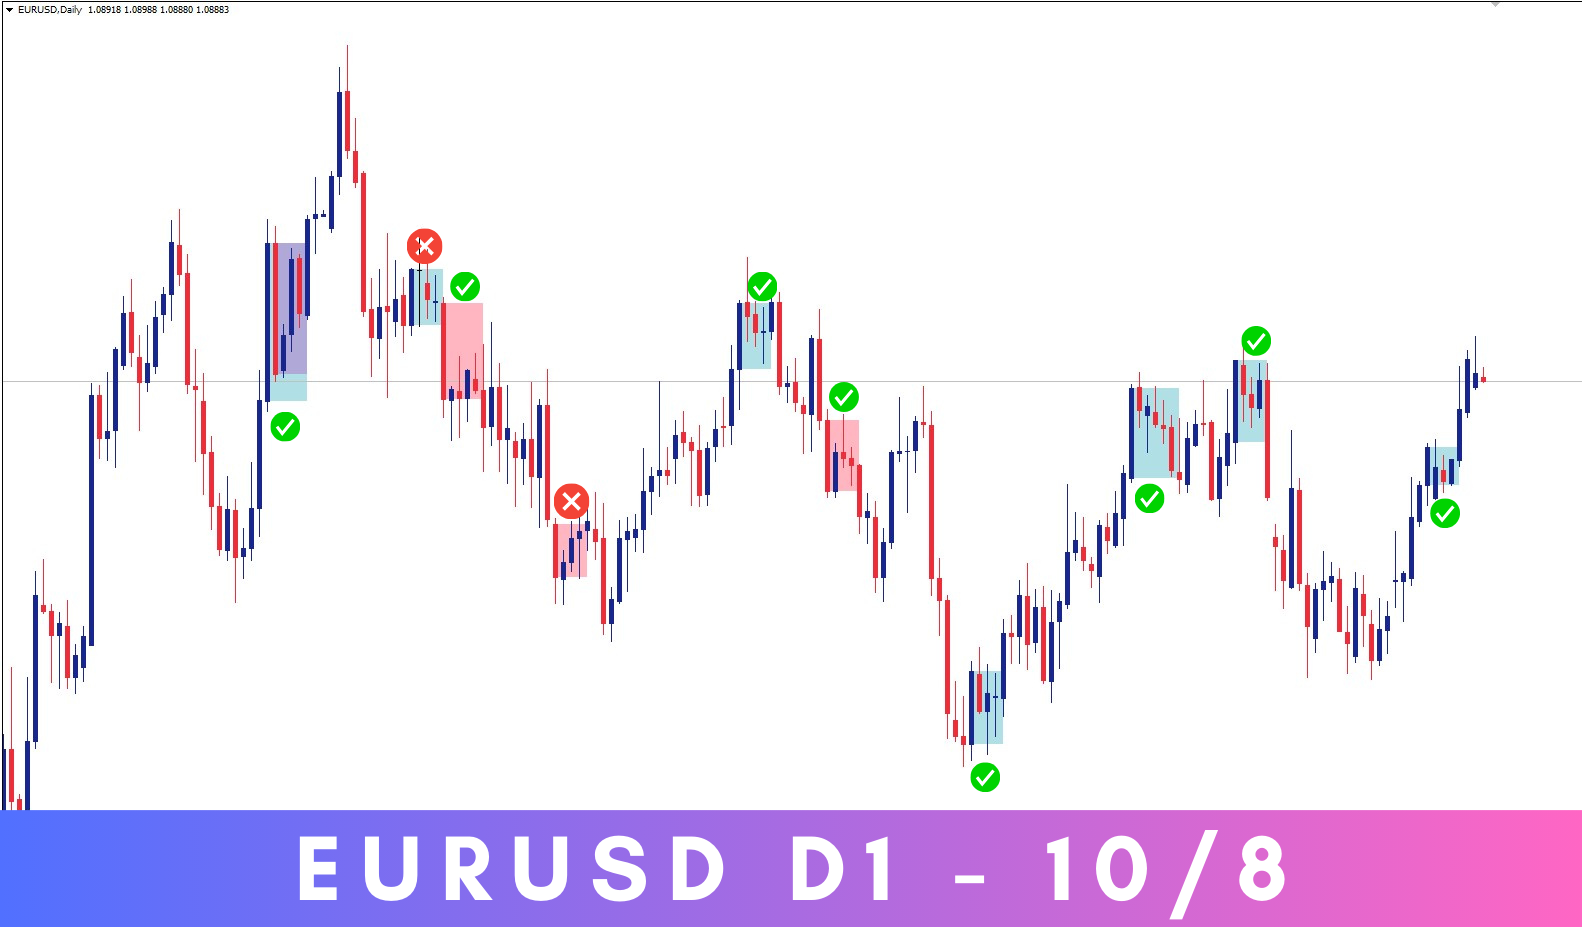
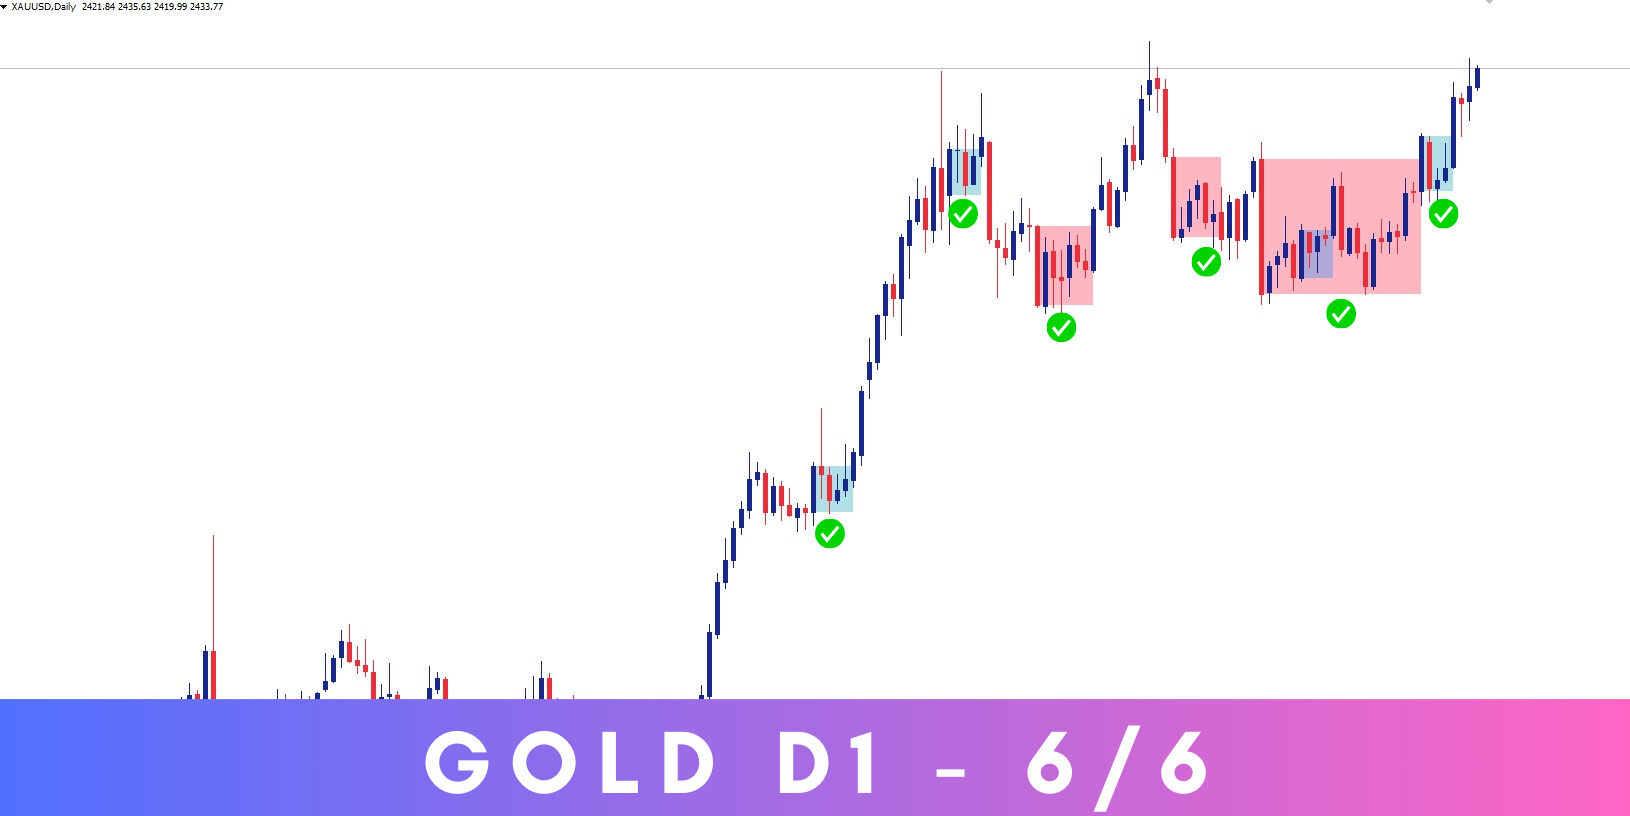
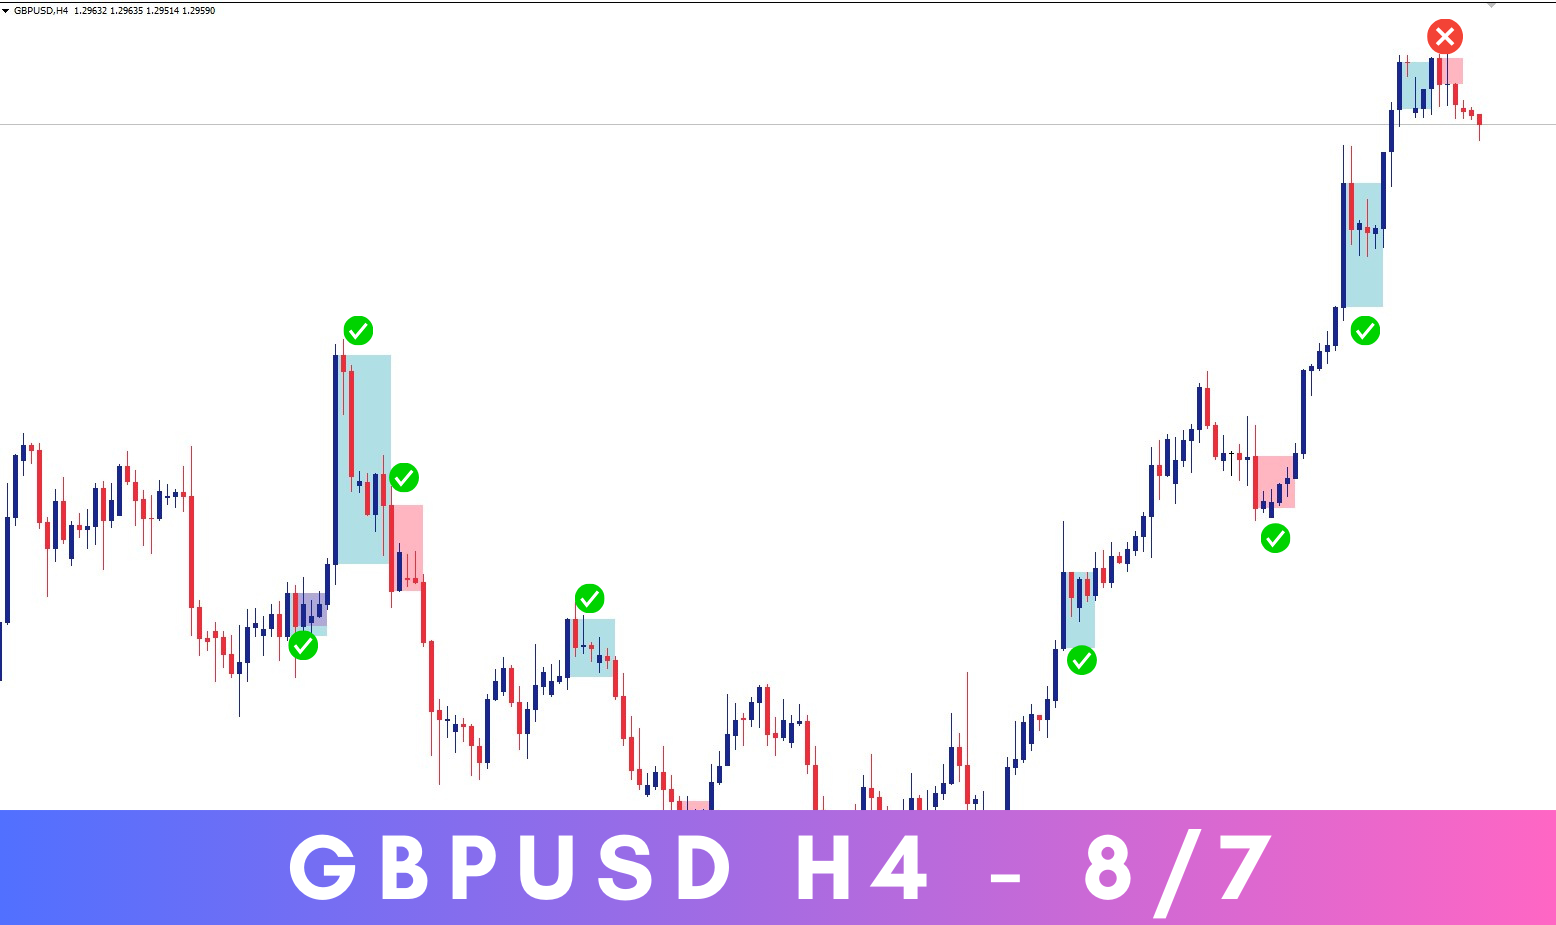
Dominant Candle Finder is a significant candlestick on a price chart that stands out due to its size, volume, or price movement compared to surrounding candles. It often indicates strong buying or selling pressure and can be used to identify potential reversal points, breakouts, or continuations in the market. Dominant candles can serve as key indicators for traders to make informed decisions, providing insights into market sentiment and potential future price movements.
MT4 Version - https://www.mql5.com/en/market/product/120152
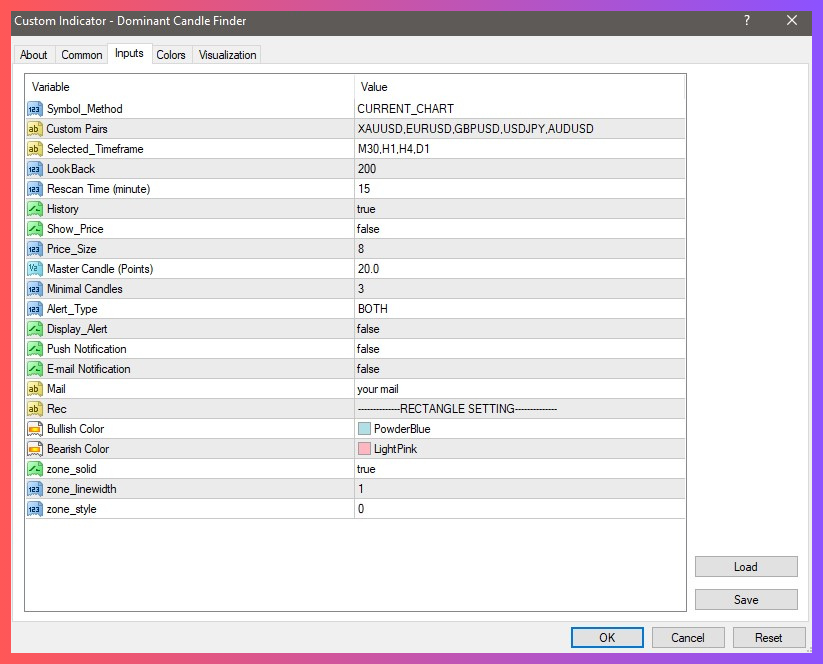
Inputs:
- Symbol Method: Current Chart / Custom Pairs / Market Watch
- Custom Pairs: Add your favorite pairs to scan
- Select Timeframe: M30, H1, H4, D1
- Lookback: Default 80
- Rescan Time (Minutes): Default 15
- History: True / False (Show previous Dominant candles)
- Show Price: True / False (Display big candle body high/low price)
- Master Candle (Points): Default 20 points (Minimum big candle size)
- Minimal Candle: Default 3
- Alert Type: Pattern / Breakout / Both
Video Tutorial
For a detailed walkthrough on how to use the Dominant Candle Indicator, including setting up and interpreting the inputs, please watch the video tutorial provided. This will give you a comprehensive understanding of the indicator's functionality and practical applications.
Feel free to contact me if you need any assistance.