Smart Volatility Index
- 지표
-
Suvashish Halder
 💧 PRO TIP - Don't Open Orders Where You See, Open Them Where Others Can't!
📈 Decoding Market Phases Like Never Before – The SuvashishFx Revolution! - 버전: 1.1
- 업데이트됨: 31 1월 2024
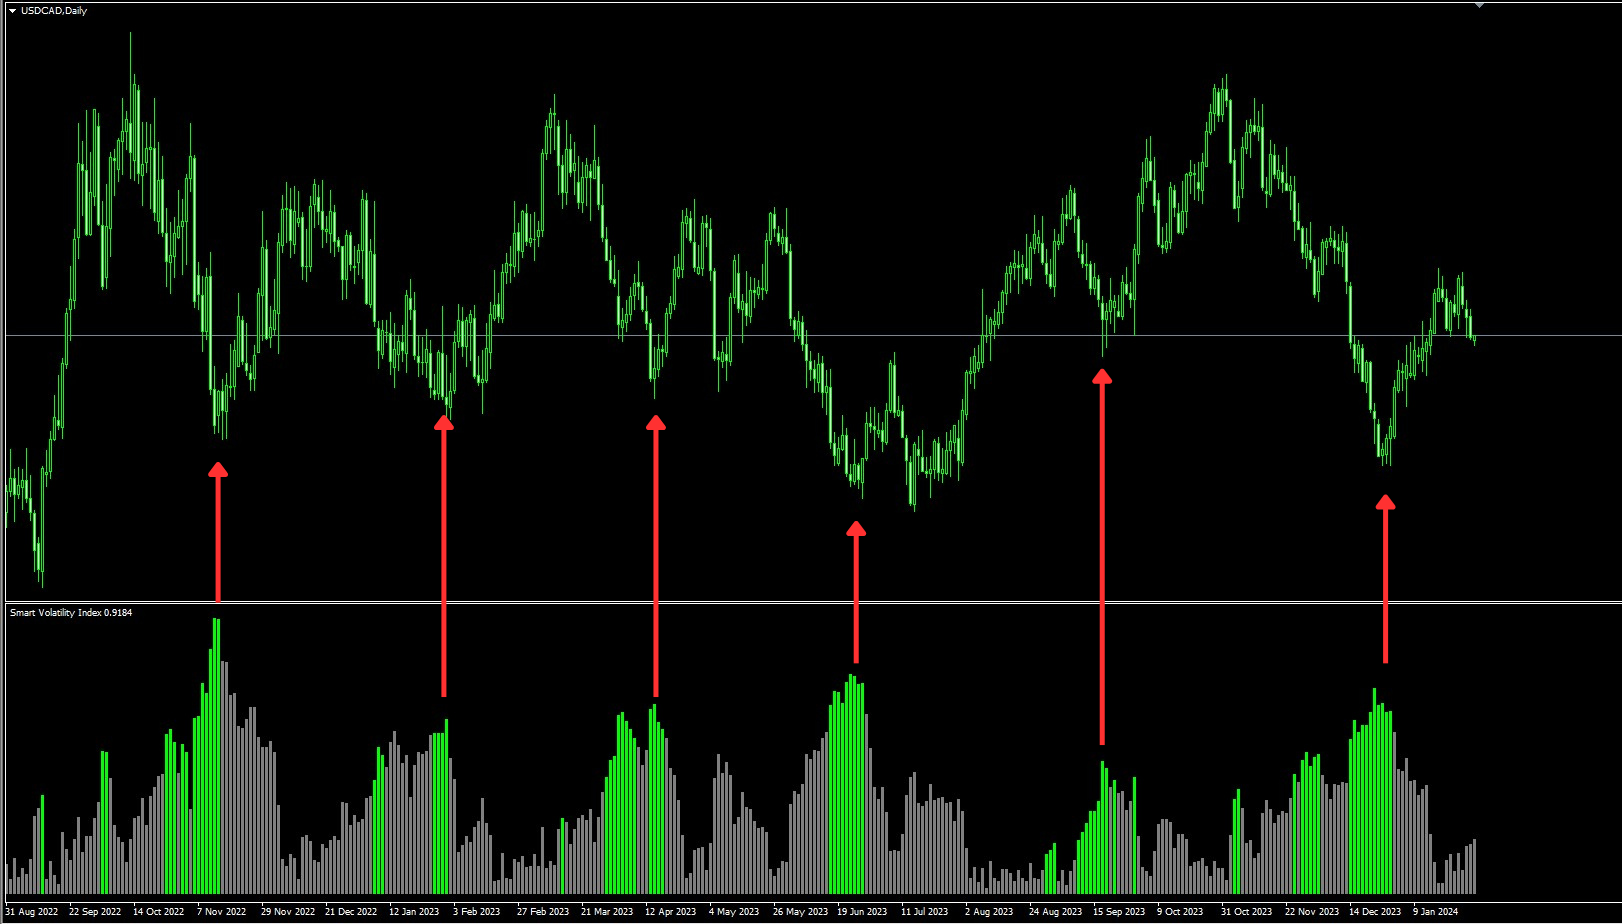
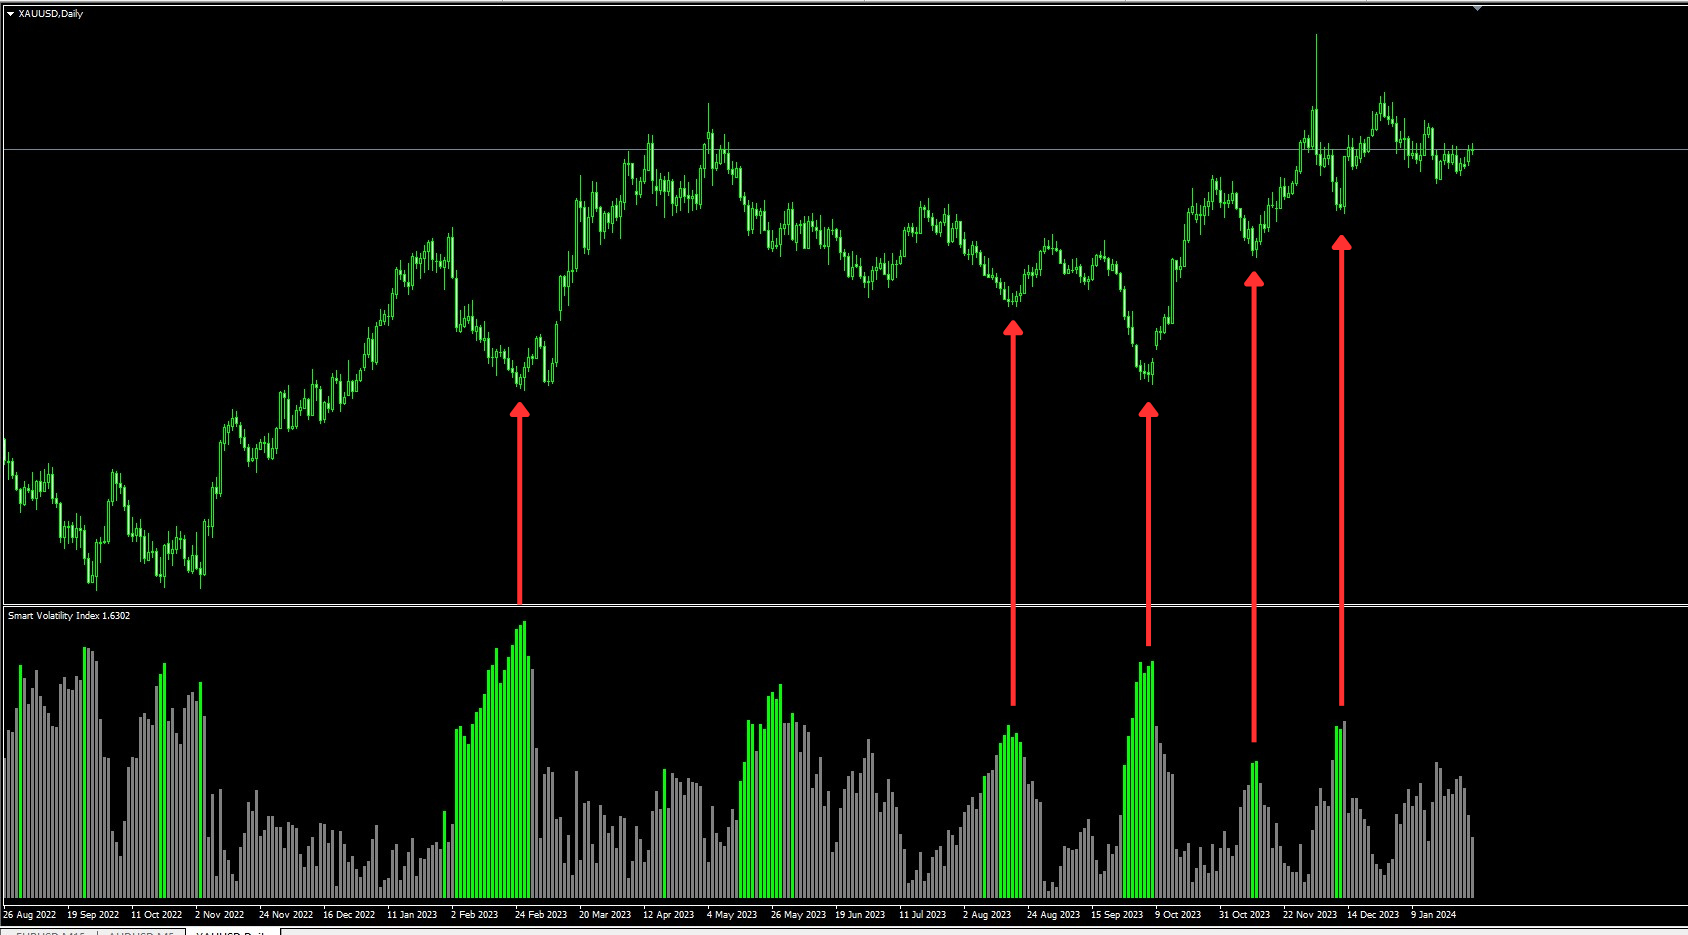
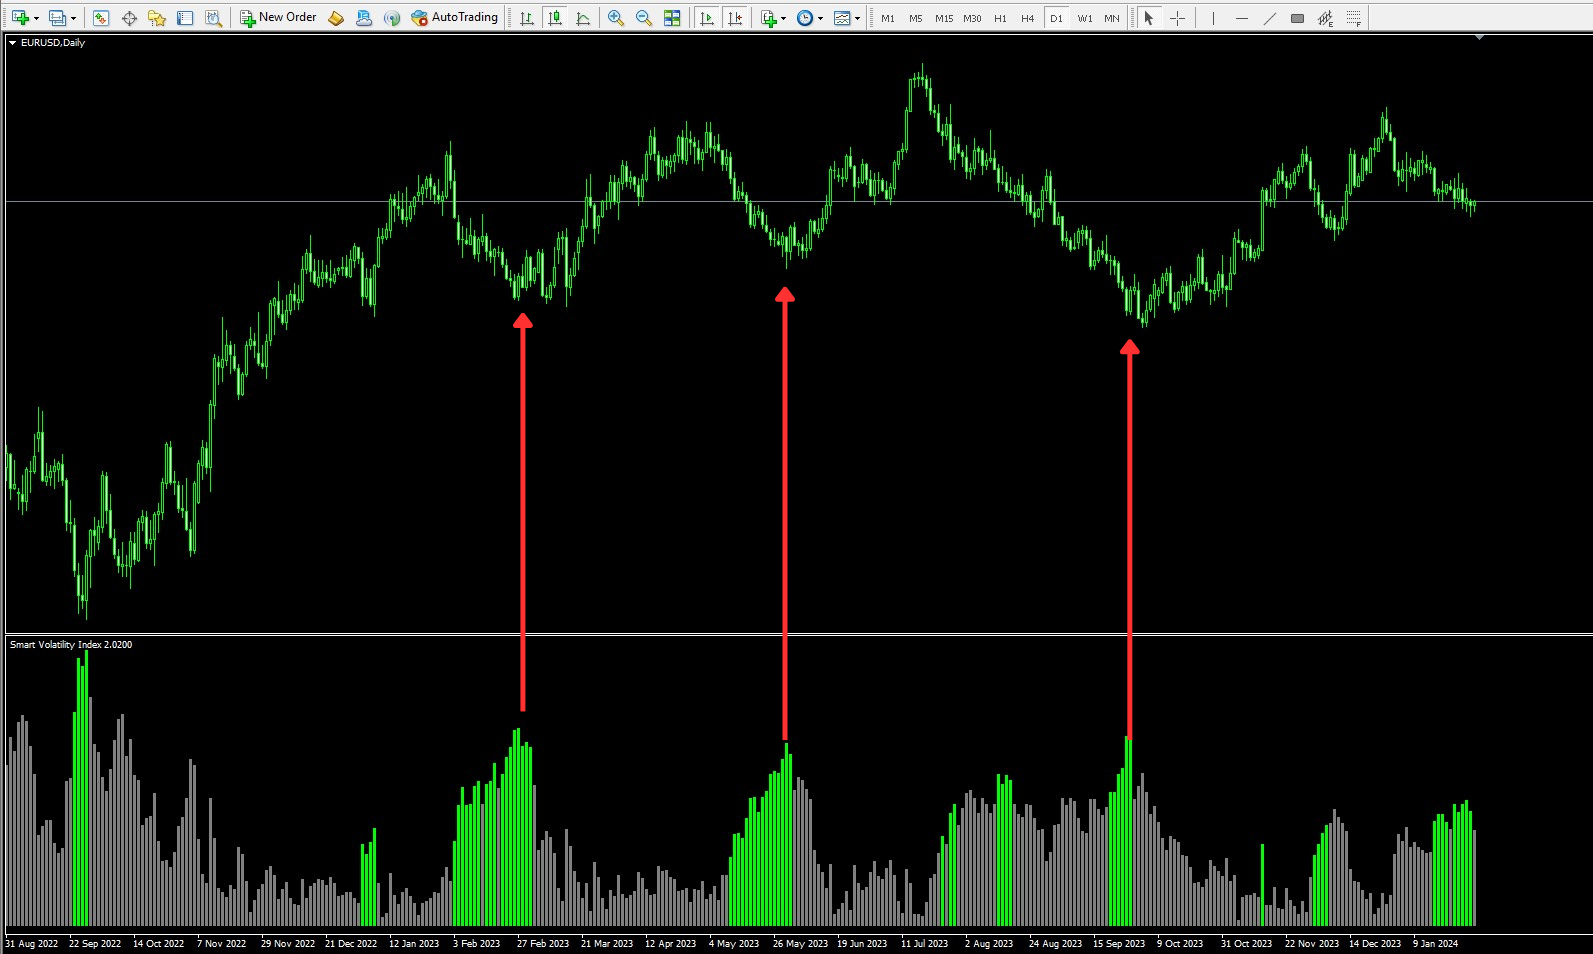
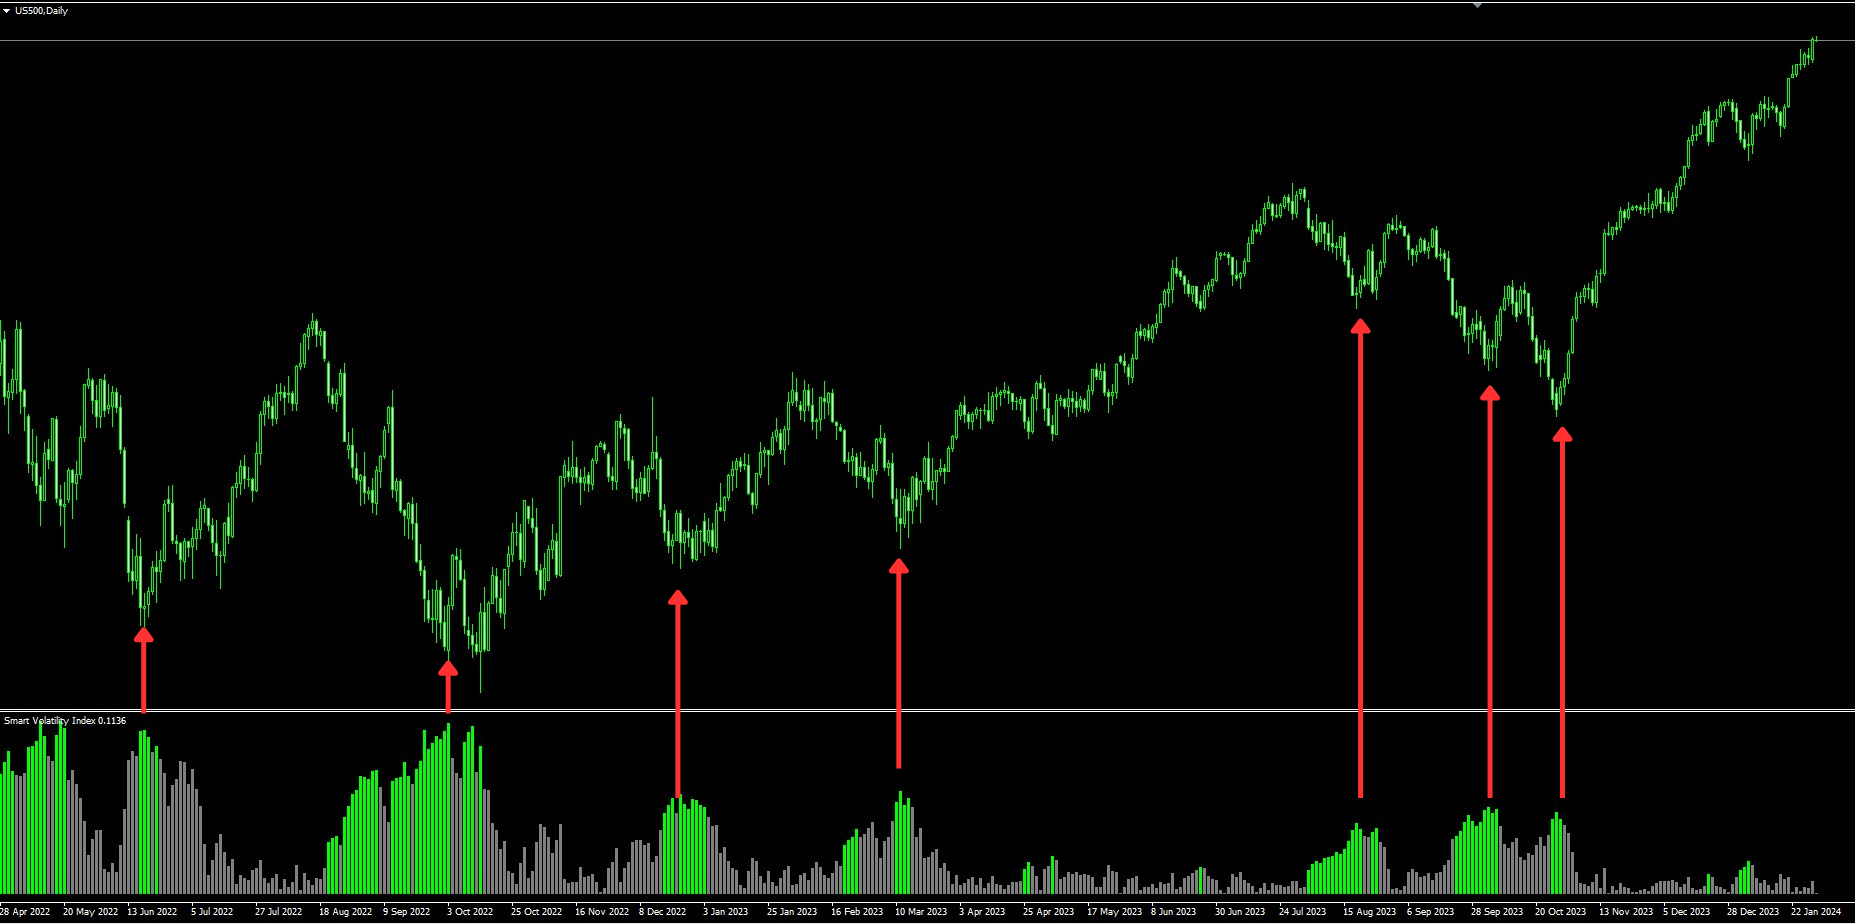
This is one of the most popular and highly rated volatility index (VIX) indicators on the market. It provides the same readings as the VIX does for stock indexes. However, this indicator works across all asset classes. VIX Fix Finds Market Bottoms. This indicator is not for inexperienced traders. Use it for day and swing trading.
MT5 Version - https://www.mql5.com/en/market/product/112284
🛑 Join To Learn Market Depth - https://www.mql5.com/en/channels/suvashishfx
Unfortunately, the VIX is only calculated for the S&P 500, Nasdaq Composite, and Dow Jones Industrial Average. How about other markets?
Investor sentiment is more magnified at market bottoms than at tops. The VIX may be calculated for any market, including Treasury bonds, gold, silver, soybeans, and individual stocks, using a simple formula.


Great Indicator, just started using it but seems to work flawlessly.