CCI advanded
- 지표
- 버전: 2.0
- 업데이트됨: 11 2월 2026

CCI Advanced is an enhanced Commodity Channel Index indicator for MetaTrader 5. It keeps the classic CCI engine but adds a clearer visual interface, automatic buy/sell signals, a dynamic histogram, and strong-signal and divergence detection.
Features
- Automatic signals: prints buy/sell cues from CCI behavior at the zero and extreme levels.
- Dynamic color histogram: shows momentum strength and direction at a glance.
- Divergence detection: highlights divergence between price and CCI as an early reversal warning.
- Strong-signal detection: separates ordinary readings from high-conviction moves.
- Multi-channel alerts for hands-off monitoring.
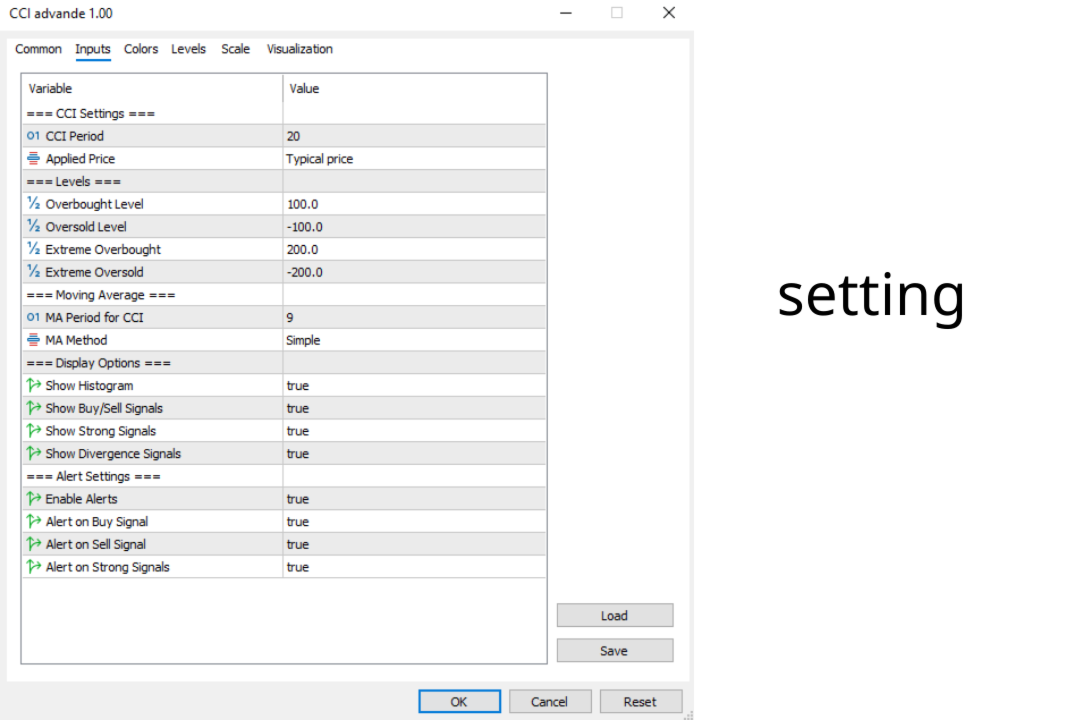
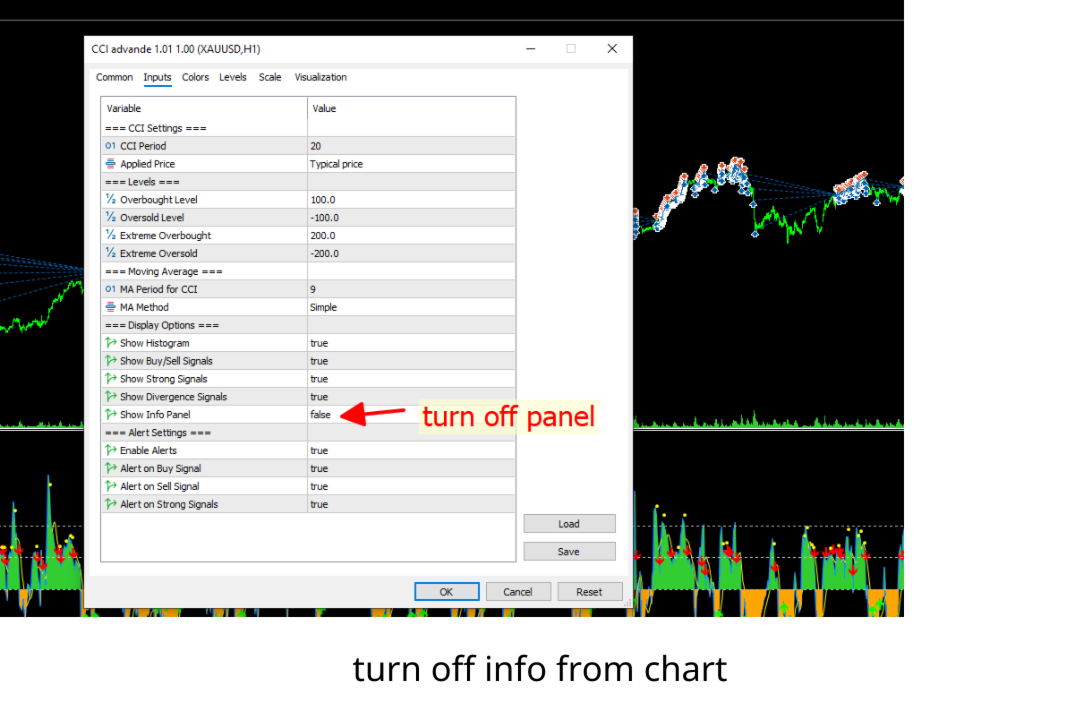
Inputs
- CCI Period: averaging length (default 14).
- Overbought / Oversold levels: default +100 / -100.
- Enable Divergence detection on/off.
- Alert toggles (popup, sound, push, email).
- Color options.
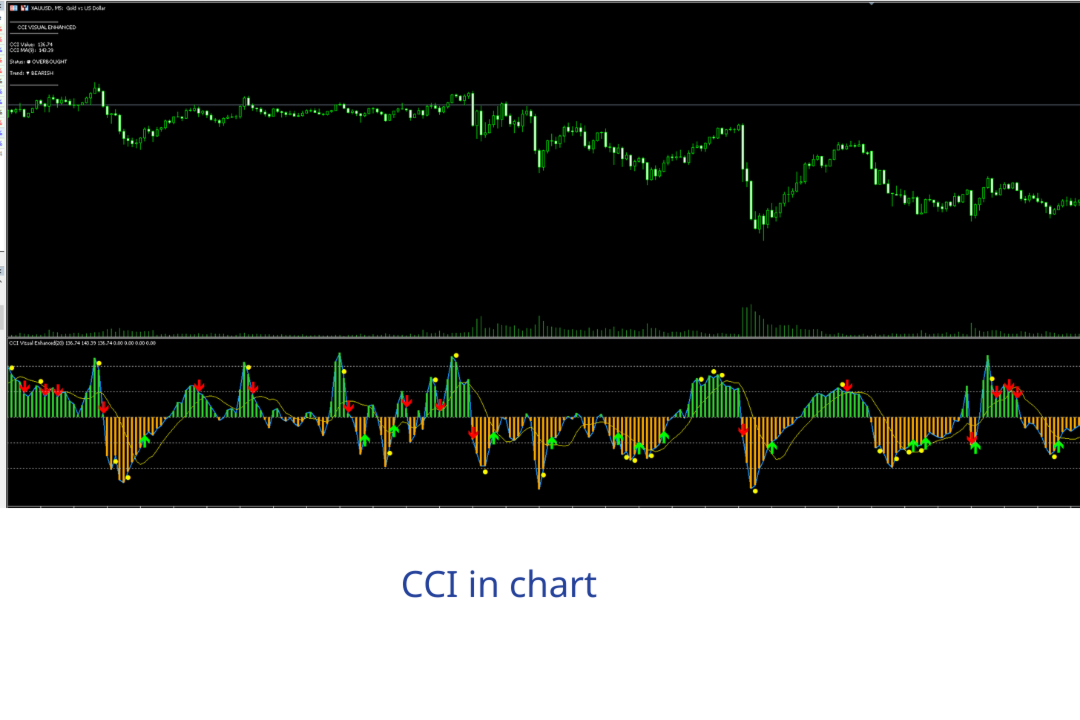
Outputs
- CCI line and a colored momentum histogram in the indicator window.
- Buy/sell markers and divergence markers.
Alerts
Alerts can be sent as a screen popup, sound, push notification and email on a signal or divergence.
Limitations
CCI is an oscillator and can stay overbought or oversold in strong trends, so signals work best with trend context. Divergence warns of a possible turn but does not time it precisely.
Full installation and settings guide: see the Comments section.
Group support: https://www.mql5.com/en/channels/vuongphamtrading


Rất trực quan, hiệu quả lắm . Nhưng sao nay vào mua không được