Triple MA Trend with alert

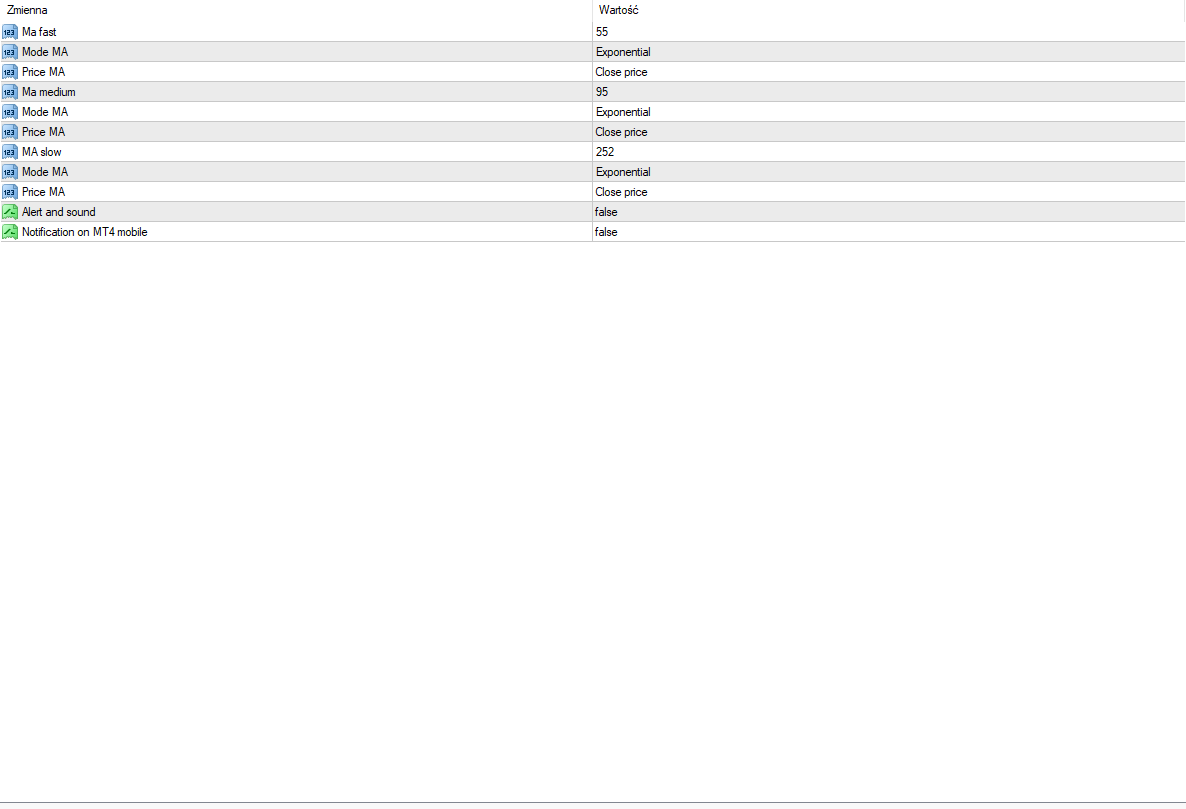
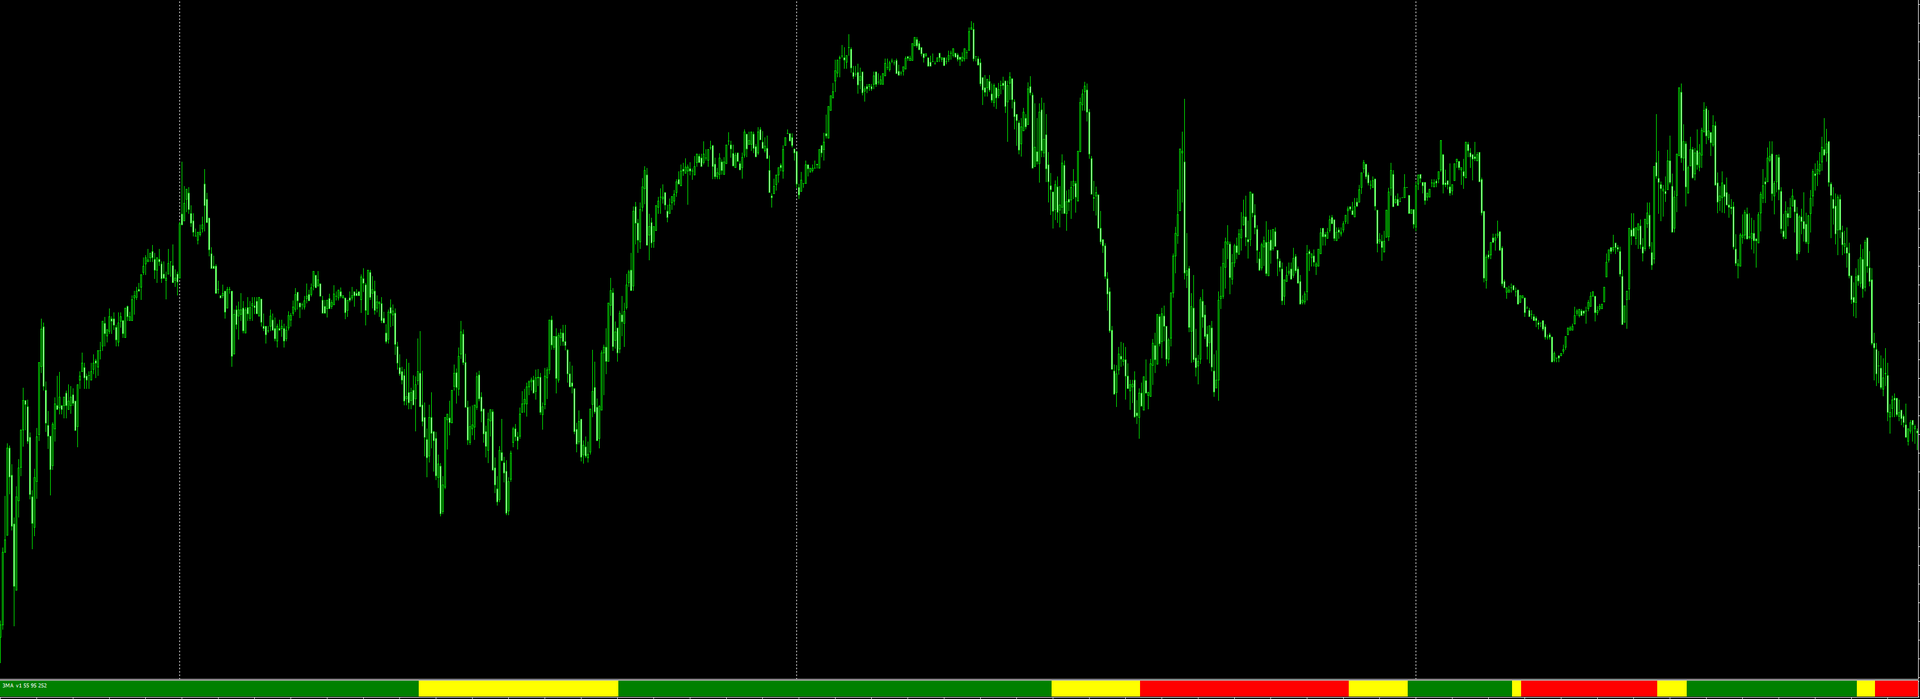
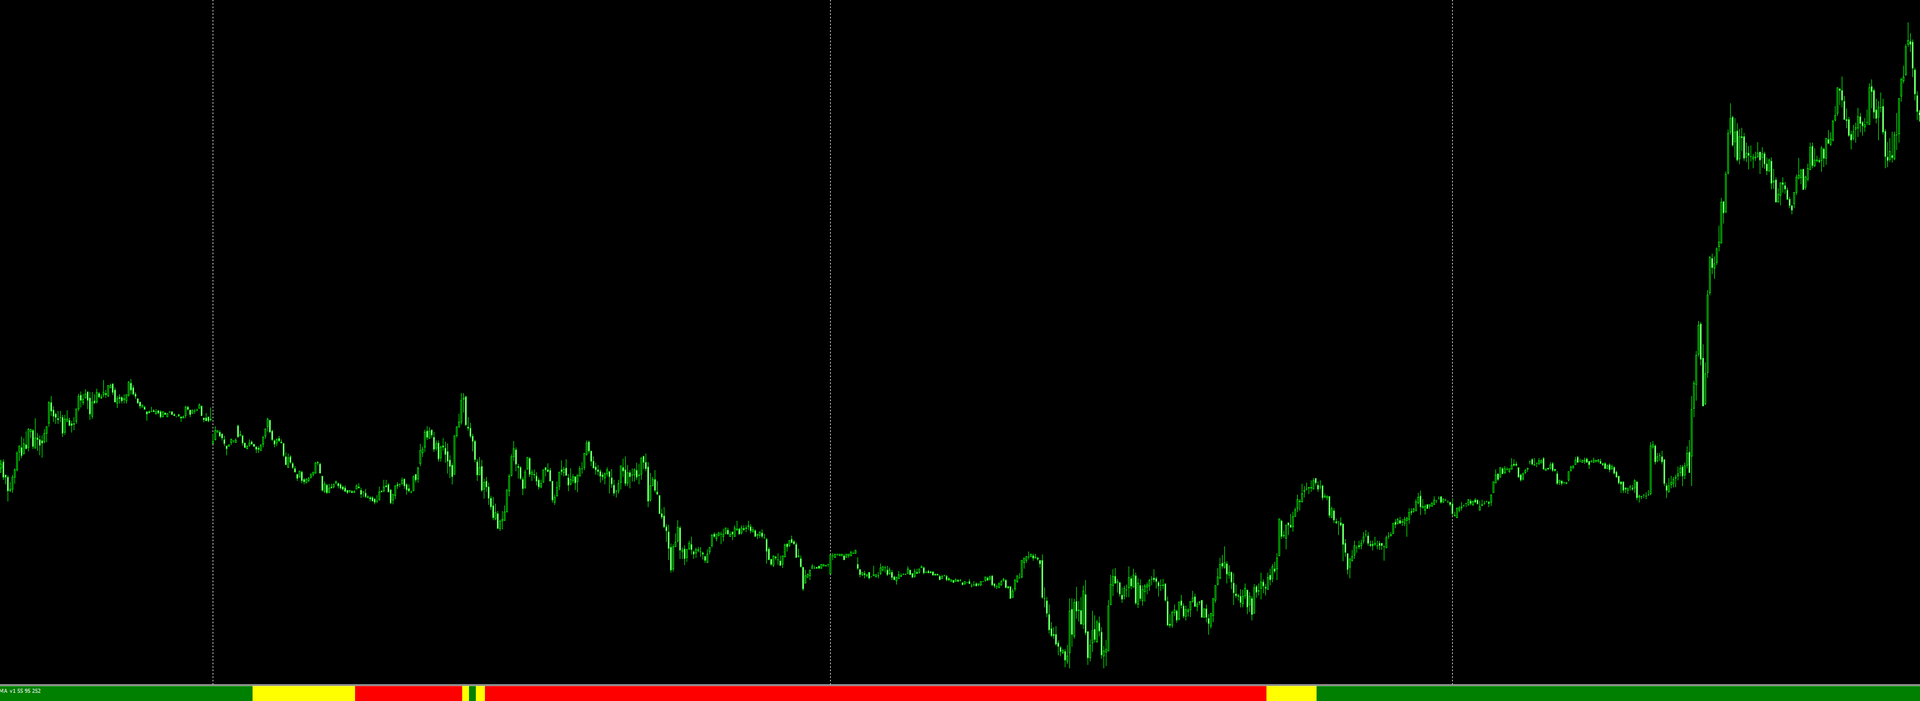
This indicator is a histogram showing the trend based on 3 different moving averages. When all averages are set in ascending order, the indicator is green, and when in descending order, it is red. If the averages do not show a trend, the color is yellow. Additionally, each average can have different settings, such as Mode MA and Price MA. You can also set an alert and receive notifications on your phone.
To enable the alert and push notification, you need to activate them first in the MT4 settings.

Check my other indicators.
https://www.mql5.com/en/users/maniuszn/seller


추천 제품
Super trend is one of the best trend indicators in metatrader 4 (MT4). Triple SuperTrend indicator is an indicator that consist of three super trend indicator that can be aranged. This indicator is built by mql4 language and doesn't provided by MT4 platform. Highly recommended using EMA SuperTrend Strategy Indicator if you want to get better result in here: https://www.mql5.com/en/market/product/91664 This indicator is easy to use, power full and has many benefits, there are: Using three indic
FREE
Wise Men Indicator demo
Bohdan Kasyanenko
3 (2)
The indicator displays signals according to the strategy of Bill Williams on the chart. Demo version of the indicator has the same features as the paid, except that it can work only on a demo account . Signal "First Wise Man" is formed when there is a divergent bar with angulation.  Bullish divergent bar - with lower minimum and closing price in the upper half. Bearish divergent bar - higher maximum and the closing price at the bottom half. Angulation is formed when all three lines of Alligator
FREE
Lisek Stochastic
Darius Hans Lischka
2.83 (6)
Lisek Stochastic   oscillator indicator with Alarm, Push Notifications and e-mail  Notifications. The Stochastic indicator is a momentum indicator that shows you how strong or weak the current trend is. It helps you identify overbought and oversold market conditions within a trend. The Stochastic indicator is lagging indicator, which means it don't predict where price is going, it is only providing data on where price has been !!! How to trade with Stochastic indicator: Trend following: As long
FREE
Moving Averages Divergence 3x3    Indicator     uses the crossover technique for signaling the market trend and the trade opportunities as well.     It applies 3 formats of the same indicator and allows them to plot the crossover signals which are interpreted as the trade signals along with the direction of the market trend. Moving Averages Divergence 3x3    Indicator   can be applied to trade all kinds of forex currency pairs within the financial markets.  Although, this indicator works well o
FREE
Free automatic fibonacci
Tonny Obare
4.67 (49)
Free automatic Fibonacci is an indicator that automatically plots a Fibonacci retracement based on the number of bars you select on the BarsToScan setting in the indicator. The Fibonacci is automatically updated in real time as new highest and lowest values appears amongst the selected bars. You can select which level values to be displayed in the indicator settings. You can also select the color of the levels thus enabling the trader to be able to attach the indicator several times with differe
FREE
Auto Fibo Retracement MT4
Nguyen Tuan Son
3.67 (3)
Auto Fibonacci Retracement Indicator — Flexible and Reliable This is not just another Auto Fibonacci Retracement indicator — it’s one of the most flexible and dependable tools available . If you find it useful, please leave a review or comment to support the project. Check out my other helpful tools below: Timeframes Trend Scanner    - Scan the trend of assets in difference timeframes with multiple indicators Market Trend Scanner   - Scan the trend of multiple-assets in with multiple indicators
FREE
Donchian Trend Histogram
Mariusz Piotr Rodacki
Donchian channels are a tool in technical analysis used to determine the relative volatility of a market and the potential for price breakouts. Can help identify potential breakouts and reversals in price, which are the moments when traders are called on to make strategic decisions. These strategies can help you capitalize on price trends while having pre-defined entry and exit points to secure gains or limit losses. Using the Donchian channel can thus be part of a disciplined approach to managi
FREE
RelicusRoad MACD v2
Relicus LLC
4.6 (5)
이동 평균 수렴 발산(MACD) 거래 전략은 추세와 흐름 방향의 변화를 식별하는 데 사용되는 인기 있는 기술 분석 도구입니다. MACD는 12기간의 지수 이동 평균(EMA)에서 26기간의 EMA를 빼서 계산됩니다. "신호 선"이라고 불리는 9기간의 EMA는 MACD 위에 표시되어 매수 및 매도 신호를 트리거로 작용합니다. MACD 선이 신호 선 위에 있으면 매수 트렌드로 간주되고, 신호 선 아래에 있으면 매도 트렌드로 간주됩니다. 거래자들은 종종 이 정보를 사용하여 잠재적인 매수 및 매도 기회를 파악합니다. MACD는 다양한 방식으로 사용될 수 있는 다재다능한 지표입니다. 일반적으로 사용되는 몇 가지 방법은 다음과 같습니다. 교차: MACD 선이 신호 선 위로 크로스되면 매수 교차가 발생하고, MACD 선이 신호 선 아래로 크로스되면 매도 교차가 발생합니다. 발산: MACD가 새로운 고점을 형성하면서 기초 자산이 그렇지 않은 경우 매수 발산이 발생하고, MACD가 새로운 저점을 형성
FREE
Email Drawdown Alert
Roman Starostin
5 (12)
Free informative Indicator-helper. It'll be usefull for traders who trade many symbols or using grid systems (Averaging or Martingale). Indicator counts drawdown as percent and currency separate. It has a number of settings: Count deposite drawdown according equity value and send e-mail or notifications to user if DD more than set; Sending e-mail when max open orders reached; Shows price and remaining pips amount before MarginCall on current chart and Account generally; Display summary trade lot
FREE
MACD Scanner With Alerts
Niravkumar Maganbhai Patel
4 (2)
MACD Dashboard Panel   This indicator helps you to scan symbols which are in the Market Watch window and filter out a trend according to MACD. Moving Average Convergence Divergence (MACD) is a trend-following momentum indicator that shows the relationship between two moving averages of a security’s price. The MACD is calculated by subtracting the 26-period Exponential Moving Average (EMA) from the 12-period EMA. The result of that calculation is the MACD line. A nine-day EMA of the MACD called
FREE
Super Auto Fibonacci
Muhammed Emin Ugur
Discover the power of precision and efficiency in your trading with the " Super Auto Fibonacci " MT4 indicator. This cutting-edge tool is meticulously designed to enhance your technical analysis, providing you with invaluable insights to make informed trading decisions. Key Features: Automated Fibonacci Analysis: Say goodbye to the hassle of manual Fibonacci retracement and extension drawing. "Super Auto Fibonacci" instantly identifies and plots Fibonacci levels on your MT4 chart, saving you tim
FREE
Currency Scoring
Mr Nukool Chanchingchit
5 (4)
What is a tool ? This indicator use for comparison of 8 major currency from 28 pairs and multiple timeframes and calculates a score of strength from 0-100. How to use Place the indicator on any pair any timeframe, And entering only the value of X Y position to be displayed in the graph. Pair   : Any Timeframe   : Any Input Parameter Start X Position   : Value of X on chart Start Y Position  : Value of Y on chart Visit my products Target Profit Magic Target Profit All The Profit Tracker Currency
FREE
Follow The Line
Oliver Gideon Amofa Appiah
3.94 (16)
FOLLOW THE LINE GET THE FULL VERSION HERE: https://www.mql5.com/en/market/product/36024 This indicator obeys the popular maxim that: "THE TREND IS YOUR FRIEND" It paints a GREEN line for BUY and also paints a RED line for SELL.  It gives alarms and alerts of all kinds. IT DOES NOT REPAINT and can be used for all currency pairs and timeframes. Yes, as easy and simple as that. Even a newbie can use it to make great and reliable trades. NB: For best results, get my other premium indicators for more
FREE
UPD1 Rsi Dots Dashboard
Vitaliy Kuznetsov
5 (2)
이 표시기는 차트의 터미널 오실레이터를 기반으로 신호를 표시합니다. 반복되는 신호를 필터링 할 수 있습니다. 여기서 오실레이터는 역 신호를 검색하는 데 사용됩니다. 스윙 전략 및 거래 수준에서 진입 점으로 권장 됩니다. 다중 통화 대시 보드를 사용할 수 있습니다. 그것으로,당신은 쉽게 차트 사이를 전환 할 수 있습니다. 제품 토론에서 대시보드를 포함할 수 있는 알고리즘을 제안할 수 있습니다. 입력 매개변수. 기본 설정. Bars Count – 표시기가 작동하는 히스토리 바의 수. RSI Period – 발진기 기간. RSI Level – 발진기의 레벨. 오실레이터는 0 에서 100 사이입니다. 당신이 10 를 선정하는 경우에,신호는 10 의 위 그리고 90 이하 일 것입니다. RSI Applied Price. Repeat Signal - 반복 신호. Enable – 모든 반복 신호는 화살표/아이콘이 될 것입니다. No Signal – 반복되는 모든 것들은 무시됩니다. 시각
FREE
MACD stopper x2 free
Andrii Malakhov
4 (1)
The MACD_stopper_x2 indicator shows where the trend has a tendency to stop or reverse. It uses the standard MACD indicator and a proprietary formula for processing data obtained from MACD. There are 2 types of stop/reversal signals: Small cross - probability of a trend stop/reversal is 70-80%; Large cross - probability of a trend stop/reversal is 80-80%; If there are open trades (for example, BUY) on the symbol the indicator is attached to, and the BUY trend ends, the indicator sends push notifi
FREE
RSI TrendGate
Etsushi Ishizuka
RSI TrendGate 3MA는 RSI와 3개의 이동평균선(MA)을 조합하여 추세 방향을 더 명확하게 확인할 수 있도록 돕는 차트 표시용 인디케이터입니다. 선택한 조건에 따라 시장 상태가 “상승 우위” 또는 “하락 우위”로 판단될 때, 차트 창에 화살표를 표시합니다. 이 제품은 화살표를 단독 매매 신호로 사용하도록 설계되지 않았습니다. 권장 사용 방식은 상위 시간대에서 방향을 확인하고, 하위 시간대에서는 사용자의 자체 규칙으로 진입 타이밍을 결정하는 운용입니다. 개요 본 인디케이터는 다음 요소를 기반으로 방향을 판정합니다. 3개 MA의 정렬로 레짐 판정(방향의 기반) 단기/중기/장기 3개 MA를 계산하고, 정렬 상태에 따라 시장을 분류합니다. 상승 레짐: MA Short > MA Mid > MA Long 하락 레짐: MA Short < MA Mid < MA Long 레짐 없음: 그 외의 상태(MA가 서로 얽혀 방향이 명확하지 않음) 단기 MA 기울기 필터(선택) 단기 MA의 기울기
FREE
Tipu Heikin Ashi Panel
Kaleem Haider
4.56 (18)
Tipu Heikin-Ashi Panel is the modified version of the original Heiken Ashi indicator published by MetaQuotes here . A professional version of this indicator is available here . Features An easy to use Panel that shows the Heiken Ashi trend of selected timeframe. Customizable Buy/Sell alerts, push alerts, email alerts, or visual on-screen alerts. Customizable Panel. The panel can be moved to any place on the chart or minimized to allow more space. Heikin means "the average", and Ashi means "foot
FREE
Based on the trend-following principle of CCI, it has been improved to become an indicator that can identify the reversal of the trend and its development direction, that is, it can identify the top and bottom attenuation of the oscillating trend in the trend market. feature The red and green columns represent the trend of bullish or bearish development under the current cycle. The blue line shows the position and attenuation of the current price trend in the current cycle. The upper and lower r
FREE
Traditional MACD MT4
Daniel Lewis
4.58 (55)
MACD indicator in MetaTrader 4/5 looks different than MACD does in most other charting software. That is because the MetaTrader 4/5 version of MACD displays the MACD line as a histogram when it is traditionally displayed as a line. Additionally, the MetaTrader 4/5 version computes the Signal line using an SMA, while according to MACD definition it is supposed to be an EMA. The MetaTrader 4/5 version also does not compute a true MACD Histogram (the difference between the MACD/Signal lines). This
FREE
SMA Indicator
Nitu Brijesh Yadav
Arrow Indicator (Buy/Sell Alerts) – Simple Yet Powerful Tool!             Product Version: 1.01           Indicator Type: Trend Reversal Signals           Timeframes Supported: All (Recommended: H1, H4, D1)           Key Features: Buy Signal: Green upward arrow () appears below the candle  Sell Signal : Red downward arrow () appears above the candle Accurate Trend Reversal Detection – Based on tried and tested SMA strategy. ️ Clean Chart View – Minimalist, non-i
FREE
Rainbow MT4
Jamal El Alama
Rainbow MT4 is a technical indicator based on Moving average with period 34 and very easy to use. When price crosses above MA and MA changes color to green, it’s a signal to buy. When price crosses below MA and MA changes color to red, it’s a signal to sell. The Expert advisor ( Rainbow EA MT4) based on Rainbow MT4 indicator, as you can see in the short video below is now available here .
FREE
Smart FVG 인디케이터 MT4 – MetaTrader 4를 위한 고급 Fair Value Gap 탐지 Smart FVG 인디케이터 MT4는 MetaTrader 4 차트에서 Fair Value Gap(FVG)을 전문적으로 탐지하고, 모니터링하며, 알림까지 제공하는 도구입니다. ATR 기반 필터링과 시장 구조를 인식하는 로직을 결합하여 노이즈를 줄이고, 유동성 환경에 맞게 자동으로 적응하며, 매매 의사결정에 중요한 불균형 구간만 남겨 줍니다. 주요 장점 정확한 FVG 탐지: 단순한 캔들 갭이 아닌 실제 시장 비효율 구간을 식별합니다. ATR 기반 정밀도: 다양한 상품과 시간 프레임에서 저품질 신호를 걸러내는 적응형 민감도. 실시간 유효성 추적: 가격이 해당 구간을 메우거나 돌파하면 존이 자동으로 연장·조정·삭제됩니다. 사용자 정의 가능한 시각화: 색상, 선 스타일, 채우기 옵션을 템플릿에 맞게 자유롭게 설정 가능. 실질적인 알림: 새로 생성된 FVG, 메워진 FVG, 무효화된
FREE
Slow MA T3
Ridwan Kureemun
Slow T3 MA Trend indicator derived from T3 moving averages. This indicator is part of the T3 Cloud MA indicator and is posted here on its own. Buying/Selling opportunities above/below line. The MA line can also be used as dynamic support/resistance for more aggressive entries. Use default values for best settings. The number of look back bars is user defined. This indicator can be used in combination with other strategies such as price action. Suitable for all time frames.
FREE
Adjustable Fractal MT4
Dmitry Timin
4.76 (25)
Adjustable Fractal MT4 is a modification of Bill Williams' Fractals indicator. The fractal consists of a two sets of arrows - up (upper fractals) and down (lower fractals). Each fractal satisfies the following conditions: Upper fractal - maximum (high) of a signal bar exceeds or is equal to maximums of all bars from the range to the left and to the right; Lower fractal - minimum (low) of a signal bar is less or equal to minimums of all bars from the range to the left and to the right. Unlike a s
FREE
OrderBlock TS Roman
Vladislav Vlastovskii
3.8 (5)
Индикатор строит блоки заказов (БЗ) по торговой системе (ТС) Романа. Поиск блоков осуществляется одновременно на двух таймфремах: текущем и старшем (определяемым в настройках). Для оптимизации и игнорирования устаревших блоков в настройках задается ограничение количества дней в пределах которых осуществляется поиск блоков. Блоки строятся по правилам ТС состоящем из трех шагов: какую свечу вынесли (что?); какой свечой вынесли (чем?); правило отрисовки (как?).
FREE
The indicator detects and displays Shark harmonic pattern (see the screenshot). The pattern is plotted by the extreme values of the ZigZag indicator (included in the resources, no need to install). After detecting the pattern, the indicator notifies of that by a pop-up window, a mobile notification and an email. The indicator highlights the process of the pattern formation and not just the complete pattern. In the former case, it is displayed in the contour triangles. After the pattern is comple
IMA Finder MT4
Mubashir Mohamed Quraish Albarakat
This indicator is designed based on the Moving Origin indicator When the moving origin indicator breaks the price, this indicator gives a signal It is useful for better viewing of signals and analysis on them Attributes: Can be used in all symbols Can be used in all time frames Too many signals Simple and quick settings Easy way to work Settings: period: like moving average settings alarmShow: If you want to receive an alert in Metatrader after receiving the signal, enable this setting alarmS
FREE
GTAS STrend
Riviera Systems
4.5 (2)
GTAS S-Trend is a momentum indicator that helps to determine trends using combination of MACD, RSI and moving averages. This indicator was created by Bernard Prats Desclaux, proprietary trader and ex-hedge fund manager, founder of E-Winvest. Description The indicator oscillates between -65 and +65 with a neutral zone between -25 and +25 around a 0 equilibrium line. S-Trend between -25 and +25 indicates congestion zones with a bullish bias between 0 and +25, and a bearish bias between 0 and -25.
FREE
With the MACD Multi Time Frame indicator, you can spot divergences of higher timeframes while you are searching for pinpointed entries on lower timeframes. This FREE version of the indicator works only on EURUSD and GBPUSD. The full version of the indicator can be found here: MACD Multi Time Frame This blog post gives you REAL-TIME MACD Divergence Analysis for FREE and tips how to trade the divergences: REAL-TIME MACD Divergence Analysis The MACD Multi Time Frame gives you a very good overview o
FREE
이 제품의 구매자들이 또한 구매함
Gann Made Easy
Oleg Rodin
4.83 (152)
Gann Made Easy 는 mr.의 이론을 사용하여 최고의 거래 원칙을 기반으로 하는 전문적이고 사용하기 쉬운 Forex 거래 시스템입니다. W.D. 간. 이 표시기는 Stop Loss 및 Take Profit Levels를 포함하여 정확한 BUY 및 SELL 신호를 제공합니다. PUSH 알림을 사용하여 이동 중에도 거래할 수 있습니다. 거래 팁, 보너스, GANN MADE EA를 무료로 받으시려면 구매 후 저에게 연락주세요! 아마도 Gann 거래 방법에 대해 이미 여러 번 들었을 것입니다. 일반적으로 Gann의 이론은 초보자 거래자뿐만 아니라 이미 거래 경험이 있는 사람들에게도 매우 복잡한 것입니다. Gann의 거래 방식은 이론적으로 적용하기 쉽지 않기 때문입니다. 나는 그 지식을 연마하고 Forex 지표에 최고의 원칙을 적용하기 위해 몇 년을 보냈습니다. 표시기는 적용하기가 매우 쉽습니다. 차트에 첨부하고 간단한 거래 권장 사항을 따르기만 하면 됩니다. 지표는 지속적으로 시장
Smc Blast Signal
Mohit Dhariwal
5 (3)
NEW YEAR 2026 SALE OFFER PRICE AT JUST 99 DOLLARS FEW COPIES ONLY AT This price From 15th Jan -25th Jan MIDNIGHT Final offer GRAB YOUR COPY ON THIS New Year EVE Prices will be increased to 150 after the offer period ends Full Fledged EA and Alert plus for alerts will also be provided in this offer along with the purchase of Indicator. Limited copies only at this price and Ea too. Grab your copy soon Alert plus for indicator with set file is kept in comment section with the image  SMC Blast Signa
M1 Sniper
Oleg Rodin
4.89 (18)
M1 SNIPER 는 사용하기 쉬운 거래 지표 시스템입니다. M1 시간대에 맞춰 설계된 화살표 지표입니다. 이 지표는 M1 시간대 스캘핑을 위한 단독 시스템으로 사용할 수 있으며, 기존 거래 시스템의 일부로도 사용할 수 있습니다. 이 거래 시스템은 M1 시간대 거래용으로 특별히 설계되었지만, 다른 시간대에도 사용할 수 있습니다. 원래는 XAUUSD와 BTCUSD 거래를 위해 이 방법을 설계했지만, 다른 시장 거래에도 유용하다는 것을 알게 되었습니다. 이 지표의 신호는 추세 방향과 반대로 거래될 수 있습니다. 저는 지표의 신호를 활용하여 양방향으로 거래할 수 있도록 돕는 특별한 거래 기법을 알려드립니다. 이 방법은 특별한 동적 지지선과 저항선 가격 영역을 활용하는 것을 기반으로 합니다. 구매하시면 M1 SNIPER 화살표 지표를 바로 다운로드하실 수 있습니다. 또한, 아래 스크린샷에 표시된 Apollo Dynamic SR 지표는 M1 SNIPER 도구를 사용하는 모든 사용자에게 무료로
Gold Signal Pro
Mohamed Hassan
5 (1)
First 25 copies at $80, after that price becomes $149 (4 copies left) Gold Signal Pro is a powerful MT4 indicator designed to help traders spot strong price reactions in the market. It focuses on clear wick rejections , showing when price strongly rejects a level and often continues in the same direction. Gold Signal Pro is mainly built for scalping gold (XAUUSD) and works best on lower timeframes like M5 and M15 , where timing matters most. That said, it can also be used on any forex pair, a
Game Changer Indicator
Vasiliy Strukov
4.06 (17)
Game Changer는 모든 금융 상품에 사용하도록 설계된 혁신적인 추세 지표로, 메타트레이더를 강력한 추세 분석기로 탈바꿈시켜 줍니다. 이 지표는 재작성이나 지연 현상이 발생하지 않습니다. 모든 시간대에서 작동하며 추세 파악을 지원하고, 잠재적 반전 신호를 제공하며, 트레일링 스톱 메커니즘으로 활용되고, 신속한 시장 반응을 위한 실시간 알림을 제공합니다. 숙련된 투자자, 전문가, 또는 우위를 점하려는 초보자 등 누구나 이 도구를 통해 자신감과 원칙을 바탕으로, 그리고 근본적인 추세 역학에 대한 명확한 이해를 바탕으로 거래할 수 있습니다. 구매 후 바로 연락 주시면 개인 보너스를 드립니다! 강력한 지지선과 추세 스캐너 지표를 무료로 받으실 수 있습니다. 개인 메시지로 알려주세요 저는 텔레그램에서 EA나 특별 세트를 판매하지 않습니다. Mql5에서만 사용 가능하며, 세트 파일은 제 블로그에서만 볼 수 있습니다 . 사기꾼을 조심하시고 다른 사람에게서 세트를 구매하지 마세요 설정 추세
Trend indicator AI
Ramil Minniakhmetov
4.9 (77)
트렌드 인공 지능 지표는 실행 가능한 진입 점 및 반전 경고와 추세 식별을 결합하여 상인의 시장 분석을 향상시킬 훌륭한 도구입니다. 이 표시기는 사용자가 자신감과 정밀도로 외환 시장의 복잡성을 탐색 할 수 있도록 지원합니다 기본 신호 외에도 트렌드 인공 지능 지표는 풀백 또는 되돌림 중에 발생하는 2 차 진입 점을 식별하여 거래자가 기존 트렌드 내에서 가격 수정을 활용할 수 있도록합니다. 중요한 장점: ·작동 4 및 5 *명확한 구매 또는 판매 신호 *다시 칠하지 않습니다 *모든 자산에서 작동 나는 전보 사기에 개 또는 세트를 판매하지 않도록주의. 모든 설정은 블로그에 여기에 무료.  중요! 지침 및 보너스를 얻기 위해 구입 후 즉시 저에게 연락! 진짜 가동 감시는 뿐 아니라 나의 다른 제품 여기에서 찾아낼 수 있습니다: https://www.mql5.com/en/users/mechanic/seller&nbsp ; 설정 및 입력: 모든 자산에 대해 기본 설정을 권
Apollo SR Master
Oleg Rodin
5 (1)
Apollo SR Master는 지지/저항 구간에서의 거래를 더욱 쉽고 안정적으로 만들어 주는 특수 기능을 갖춘 지지/저항 지표입니다. 이 지표는 지역 가격의 고점과 저점을 감지하여 시간 지연 없이 실시간으로 지지/저항 구간을 계산합니다. 새롭게 형성된 저항 구간을 확인하기 위해 지표는 해당 저항 구간을 실제 매도 또는 매수 신호로 활용할 수 있음을 나타내는 특수 신호를 표시합니다. 이 경우, 저항 구간의 강도가 높아지고, 따라서 저항 구간에서의 성공적인 거래 가능성도 높아집니다. 이것이 바로 이 지표의 핵심 아이디어입니다. SR 존은 손절매와 이익실현을 더욱 쉽게 할 수 있도록 해줍니다. 신호 방향에 따라 SR 존 위 또는 아래 공간을 손절매로 활용할 수 있습니다. 또한, 반대쪽 SR 존은 잠재적 이익실현 영역으로 활용할 수 있습니다. 또한 Apollo SR Master 지표를 사용하는 모든 사용자에게 "Apollo Price Action System" 지표를 무료로 제공합니다.
Scalper Inside PRO
Alexey Minkov
4.74 (69)
An exclusive indicator that utilizes an innovative algorithm to swiftly and accurately determine the market trend. The indicator automatically calculates opening, closing, and profit levels, providing detailed trading statistics. With these features, you can choose the most appropriate trading instrument for the current market conditions. Additionally, you can easily integrate your own arrow indicators into Scalper Inside Pro to quickly evaluate their statistics and profitability. Scalper Inside
현재 20% 할인 ! 초보자 또는 전문가 트레이더를 위한 최고의 솔루션! 이 대시보드 소프트웨어는 28개의 통화 쌍에서 작동합니다. 2가지 주요 지표(Advanced Currency Strength 28 및 Advanced Currency Impulse)를 기반으로 합니다. 전체 Forex 시장에 대한 훌륭한 개요를 제공합니다. 고급 통화 강도 값, 통화 이동 속도 및 모든(9) 시간대의 28 Forex 쌍에 대한 신호를 보여줍니다. 추세 및/또는 스캘핑 기회를 정확히 파악하기 위해 차트의 단일 지표를 사용하여 전체 시장을 볼 수 있을 때 거래가 어떻게 개선될지 상상해 보십시오! 잠재적인 거래를 식별하고 확인하면서 강력한 통화와 약한 통화를 더욱 쉽게 식별할 수 있도록 이 지표에 기능을 내장했습니다. 이 표시기는 통화의 강세 또는 약세가 증가 또는 감소하는지 여부와 모든 시간대에서 수행되는 방식을 그래픽으로 보여줍니다. 추가된 새로운 기능은 현재 시장 조건 변화에 적응하는
Miraculous Indicator – Gann Square of Nine 기반 100% 비리페인트 Forex 및 바이너리 도구 이 영상은 Miraculous Indicator 를 소개합니다. 이 지표는 Forex 및 바이너리 옵션 트레이더를 위해 특별히 개발된 매우 정확하고 강력한 트레이딩 도구입니다. 이 지표가 독특한 이유는 전설적인 **Gann Square of Nine(Gann 9의 사각형)**과 **Gann's Law of Vibration(Gann 진동의 법칙)**에 기반을 두고 있기 때문입니다. 이는 현대 트레이딩에서 가장 정밀한 예측 도구 중 하나로 손꼽힙니다. Miraculous Indicator는 완전히 비리페인트(non-repaint) 됩니다. 즉, 캔들이 마감된 후에도 신호가 변경되거나 사라지지 않습니다. 보이는 것이 곧 결과입니다. 이는 트레이더가 자신감을 가지고 거래에 진입하고 청산할 수 있는 신뢰할 수 있고 일관된 기반을 제공합니다. 주요 특징: Gann
Dynamic Forex28 Navigator
Bernhard Schweigert
4.43 (7)
Dynamic Forex28 Navigator - 차세대 외환 거래 도구. 현재 49% 할인. Dynamic Forex28 Navigator는 오랫동안 인기 있는 지표의 진화형으로, 세 가지의 힘을 하나로 결합했습니다. 고급 통화 Strength28 지표(695개 리뷰) + 고급 통화 IMPULSE with ALERT(520개 리뷰) + CS28 콤보 신호(보너스). 지표에 대한 자세한 정보 https://www.mql5.com/en/blogs/post/758844 차세대 Strength 지표는 무엇을 제공합니까?  원래 지표에서 좋아했던 모든 것이 새로운 기능과 더 높은 정확도로 강화되었습니다. 주요 기능: 독점적인 통화 Strength 공식.  모든 시간대에 걸쳐 부드럽고 정확한 강도선. 추세와 정확한 진입을 식별하는 데 이상적입니다. 역동적인 시장 피보나치 수준(시장 피보나치).  이 지표에만 있는 고유한 기능. 가격 차트가 아닌 통화 강도에 피보나치가 적용됩니다.
ZeusArrow Smart Liquidity Finder  Smart Liquidity Finder is Ai controlled indicator based on the Idea of Your SL is My Entry. It scan and draws the major Liquidity areas on chart partitioning them with Premium and Discount Zone and allows you find the best possible trading setups and help you decide the perfect entry price to avoid getting your Stop Loss hunted . Now no more confusion about when to enter and where to enter. Benefit from this one of it's kind trading tool powered by Ai an trade
Algo Pumping MT4
Ihor Otkydach
4.69 (16)
PUMPING STATION – 당신만을 위한 올인원(All-in-One) 전략 PUMPING STATION은 당신의 외환 거래를 더욱 흥미롭고 효과적으로 바꿔줄 혁신적인 인디케이터입니다. 단순한 보조 도구가 아니라, 강력한 알고리즘을 갖춘 완전한 거래 시스템으로서 보다 안정적인 트레이딩을 시작할 수 있도록 도와줍니다. 이 제품을 구매하시면 다음의 혜택을   무료로   받으실 수 있습니다: 전용 설정 파일: 자동 설정으로 최대의 퍼포먼스를 제공합니다. 단계별 동영상 가이드: PUMPING STATION 전략으로 거래하는 법을 배워보세요. Pumping Utility: PUMPING STATION과 함께 사용하도록 설계된 반자동 거래 봇으로, 거래를 더욱 쉽고 편리하게 만들어줍니다. ※ 구매 후 바로 저에게 메시지를 보내주세요. 추가 자료에 대한 접근 권한을 제공해드립니다. PUMPING STATION은 어떻게 작동하나요? 트렌드 컨트롤: 시장의 추세 방향을 즉시 파악합니다. 추세는
Advanced Supply Demand
Bernhard Schweigert
4.91 (296)
현재 33% 할인! 초보자나 전문 트레이더를 위한 최고의 솔루션! 이 보조지표는 우리가 다수의 독창적 기능과 새로운 공식을 통합한 독특하고 고품질이며 저렴한 거래 도구입니다. 이 업데이트를 통해 이중 시간대를 표시할 수 있습니다. 더 높은 TF를 표시할 수 있을 뿐만 아니라 차트 TF와 더 높은 TF 모두를 표시할 수 있습니다: 중첩 영역 표시. 모든 Supply Demand 트레이더들이 좋아할 것입니다. :) 중요한 정보 공개 Advanced Supply Demand의 잠재력을 극대화하려면 다음을 방문하십시오. https://www.mql5.com/ko/blogs/post/720245   진입 또는 목표의 명확한 트리거 포인트를 정확히 찾아냄으로 해서 거래가 어떻게 개선될지 상상해 보십시오. 새로운 알고리즘을 기반으로 매수자와 매도자 간의 잠재적인 불균형을 훨씬 더 쉽게 분간할 수 있습니다. 왜냐하면 가장 강한 공급영역과 가장 강한 수요 영역과 과거에 어떻게 진행 되었는지를(이전
GOLD Impulse with Alert
Bernhard Schweigert
4.64 (11)
이 지표는 Advanced Currency IMPULSE with ALERT  +   Currency Strength Exotics  의 2가지 제품의 슈퍼 조합입니다. 그것은 모든 시간 프레임에 대해 작동하며 8개의 주요 통화와 하나의 기호에 대한 강약의 충동을 그래픽으로 보여줍니다! 이 표시기는 금, 이국적인 쌍, 상품, 지수 또는 선물과 같은 기호에 대한 통화 강도 가속을 표시하는 데 특화되어 있습니다. 금, 은, 오일, DAX, US30, MXN, TRY, CNH 등의 진정한 통화 강도 가속(충동 또는 속도)을 표시하기 위해 9번째 줄에 모든 기호를 추가할 수 있습니다. 새로운 기본 알고리즘을 기반으로 구축되어 잠재적인 거래를 훨씬 더 쉽게 식별하고 확인할 수 있습니다. 이는 통화의 강세 또는 약세가 가속되는지 여부를 그래픽으로 표시하고 가속 속도를 측정하기 때문입니다. 자동차의 속도계처럼 생각하면 됩니다. 가속화할 때 Forex 시장에서 동일한 일이 분명히 더 빠르
Trend Screener
STE S.S.COMPANY
4.79 (95)
트렌드 표시기, 트렌드 트레이딩 및 필터링을 위한 획기적인 고유 솔루션, 하나의 도구 안에 내장된 모든 중요한 트렌드 기능! Forex, 상품, 암호 화폐, 지수 및 주식과 같은 모든 기호/도구에 사용할 수 있는 100% 다시 칠하지 않는 다중 시간 프레임 및 다중 통화 표시기입니다. 기간 한정 특가: 지원 및 저항 스크리너 지표는 단 100달러에 평생 제공됩니다. (원래 가격 50 달러) (제안 연장) Trend Screener는 차트에 점이 있는 화살표 추세 신호를 제공하는 효율적인 지표 추세 추종 지표입니다. 추세 분석기 표시기에서 사용할 수 있는 기능: 1. 트렌드 스캐너. 2. 최대 이익 분석이 있는 추세선. 3. 추세 통화 강도 측정기. 4. 경고가 있는 추세 반전 점. 5. 경고가 있는 강력한 추세 점. 6. 추세 화살표 Trend Screener Indicator가 있는 일일 분석 예, 일일 신호 성능...등은 여기에서 찾을 수 있습니다.   여기를 클릭하십시오. L
PZ Day Trading
PZ TRADING SLU
3.67 (3)
Effortless trading: non-repainting indicator for accurate price reversals This indicator detects price reversals in a zig-zag fashion, using only price action analysis and a donchian channel. It has been specifically designed for short-term trading, without repainting or backpainting at all. It is a fantastic tool for shrewd traders aiming to increase the timing of their operations. [ Installation Guide | Update Guide | Troubleshooting | FAQ | All Products ] Amazingly easy to trade It provides
현재 26% 할인!! 이 지표는 두 주요 지표( Advanced Currency Strength 28   &  Advanced Currency IMPULSE with ALERT )의 슈퍼 조합입니다. TICK-UNITS에 대한 통화 강도 값과 28개 Forex 쌍에 대한 경고 신호를 보여줍니다. 11개의 다른 틱 단위를 사용할 수 있습니다. 1, 2, 3, 4, 5, 6, 10, 12, 15, 20, 30초입니다. 두 번째 타이머 내에 최소 1틱이 있으면 하위 창의 Tick-Unit 막대가 표시되고 왼쪽으로 이동합니다. 단 하나의 차트로 28 Forex 페어를 스캘핑할 수 있습니다! 스캘핑 기회의 정확한 트리거 포인트를 정확히 찾아낼 수 있기 때문에 스캘핑이 어떻게 개선될지 상상해 보십시오. 그것은 1분보다 낮은 기간에 작동하는 시장의 첫 번째 통화 강도 지표입니다! 그것은 시장에 빠르게 들어오고 나가고 시장에서 작은 핍을 잘라내기를 원하는 빠른 스캘퍼를 위한 것입니다. 사
Advanced Currency IMPULSE with ALERT
Bernhard Schweigert
4.91 (489)
현재 31% 할인!! 초보자 또는 전문가 트레이더를 위한 최고의 솔루션! 이 지표는 우리가 독점 기능과 비밀 공식을 통합했기 때문에 독특하고 고품질이며 저렴한 거래 도구입니다. 단 하나의 차트로 28개 통화 쌍 모두에 대한 경고를 제공합니다. 새로운 추세 또는 스캘핑 기회의 정확한 트리거 포인트를 정확히 찾아낼 수 있기 때문에 거래가 어떻게 개선될지 상상해 보십시오! 새로운 기본 알고리즘을 기반으로 구축되어 잠재적인 거래를 훨씬 더 쉽게 식별하고 확인할 수 있습니다. 이는 통화의 강세 또는 약세가 가속되는지 여부를 그래픽으로 표시하고 가속 속도를 측정하기 때문입니다. 자동차의 속도계처럼 생각하면 됩니다. 가속화할 때 Forex 시장에서 동일한 일이 분명히 더 빠르게 발생합니다. 즉, 반대 방향으로 가속화되는 통화를 페어링하면 잠재적으로 수익성 있는 거래를 식별한 것입니다. 통화 모멘텀의 수직선과 화살표가 거래를 안내합니다! 역동적인 Market Fibonacci 23 레벨은
F-16 비행기 지표를 소개합니다. 이것은 귀하의 거래 경험을 혁신하도록 설계된 최첨단 MT4 도구입니다. F-16 전투기의 비할 데 없는 속도와 정밀성에 영감을 받아이 지표는 고급 알고리즘과 최첨단 기술을 결합하여 금융 시장에서 압도적인 성능을 제공합니다. F-16 비행기 지표를 사용하면 실시간 분석을 제공하고 매우 정확한 거래 신호를 생성하여 경쟁을 앞서갈 수 있습니다. 다양한 자산 클래스에서 수익 기회를 식별하는 데 필요한 동적 기능을 갖추고 있어 확신을 가지고 정보에 근거한 결정을 내릴 수 있습니다. 사용자 친화적인 인터페이스로 구성된 F-16 비행기 지표는 인기있는 MetaTrader 4 플랫폼과 완벽하게 통합되어 원활하고 효율적인 거래 과정을 보장합니다. 초보자 트레이더든 경험 많은 전문가든 이 지표를 쉽게 사용자 정의하여 고유한 거래 스타일과 선호도에 맞출 수 있습니다. F-16 비행기 지표의 강력함을 경험해 보세요. 이 지표는 시장 트렌드를 정확하고 민첩하게 탐색하며
Volatility Trend System - a trading system that gives signals for entries. The volatility system gives linear and point signals in the direction of the trend, as well as signals to exit it, without redrawing and delays. The trend indicator monitors the direction of the medium-term trend, shows the direction and its change. The signal indicator is based on changes in volatility and shows market entries. The indicator is equipped with several types of alerts. Can be applied to various trading ins
System Trend Pro
Aleksandr Makarov
5 (2)
System Trend Pro - This is the best trend trading indicator!!! The indicator no repaint!!!  The indicator has   MTF   mode, which adds confidence to trading on the trend (   no repaint   ). How to trade? Everything is very simple, we wait for the first signal (big arrow), then wait for the second signal (small arrow) and enter the market in the direction of the arrow. (See screens 1 and 2.) Exit on the opposite signal or take 20-30 pips, close half of it, and keep the rest until the opposite
Atomic Analyst
Issam Kassas
5 (3)
우선적으로 언급할 점은이 거래 지표가 다시 그리지 않고 지연되지 않으며 이를 통해 수동 및 로봇 거래 모두에 이상적이라는 점입니다. 사용자 매뉴얼: 설정, 입력 및 전략. Atomic Analyst는 가격의 강도와 모멘텀을 활용하여 시장에서 더 나은 이점을 찾는 PA Price Action Indicator입니다. 고급 필터를 장착하여 잡음과 거짓 신호를 제거하고 거래 잠재력을 높이는 데 도움이 됩니다. 복잡한 지표의 다중 레이어를 사용하여 Atomic Analyst는 차트를 스캔하고 복잡한 수학적 계산을 간단한 신호와 색상으로 변환하여 초보 트레이더가 이해하고 일관된 거래 결정을 내릴 수 있도록합니다. "Atomic Analyst"는 새로운 및 경험이 풍부한 트레이더를위한 종합적인 거래 솔루션입니다. 프리미엄 지표와 최고 수준의 기능을 하나의 거래 전략에 결합하여 모든 종류의 트레이더에 대한 다재다능한 선택지가되었습니다. 인트라데이 거래 및 스캘핑 전략 : 빠르고 정확한 일일
Trend Arrow Super
Aleksandr Makarov
5 (2)
Trend Arrow Super The indicator not repaint or change its data. A professional, yet very easy to use Forex system. The indicator gives accurate BUY\SELL signals. Trend Arrow Super is very easy to use, you just need to attach it to the chart and follow simple trading recommendations. Buy signal: Arrow + Histogram in green color, enter immediately on the market to buy. Sell signal: Arrow + Histogram of red color, enter immediately on the market to sell.
추측을 멈추세요. 통계적 우위로 트레이딩을 시작하세요. 주식 지수는 외환과 다르게 거래됩니다. 정해진 세션이 있고, 야간에 갭이 발생하며, 예측 가능한 통계적 패턴을 따릅니다. 이 지표는 DAX, S&P 500, 다우존스와 같은 지수를 자신 있게 거래하는 데 필요한 확률 데이터를 제공합니다. 무엇이 다른가 대부분의 지표는 무엇이 일어났는지 보여줍니다. 이 지표는 다음에 무엇이 일어날 가능성이 있는지 보여줍니다. 매 거래일마다 지표는 100일간의 과거 데이터를 기준으로 현재 설정을 분석합니다. 유사한 갭, 유사한 시가 위치를 가진 날을 찾고, 가격이 주요 레벨에 도달한 빈도를 정확히 계산합니다. 갭이 메워질지, 어제 고점이 테스트될지 더 이상 추측할 필요가 없습니다. 실제 데이터에 기반한 정확한 백분율을 얻게 됩니다. 모든 입력 설명이 포함된 전체 매뉴얼: https://www.mql5.com/en/blogs/post/766370 훌륭한 설정을 찾는 데 도움이 되는 전략 가이드: ht
Advanced Currency Strength28 Indicator
Bernhard Schweigert
4.91 (657)
현재 26% 할인 초보자 또는 전문가 트레이더를 위한 최고의 솔루션! 이 지표는 우리가 독점 기능과 새로운 공식을 통합했기 때문에 독특하고 고품질이며 저렴한 거래 도구입니다. 단 하나의 차트로 28 Forex 쌍의 통화 강도를 읽을 수 있습니다! 새로운 추세 또는 스캘핑 기회의 정확한 트리거 포인트를 정확히 찾아낼 수 있기 때문에 거래가 어떻게 개선될지 상상해 보십시오. 사용 설명서: 여기를 클릭  https://www.mql5.com/en/blogs/post/697384 그것이 첫 번째, 원본입니다! 쓸모없는 지망생 클론을 사지 마십시오. 더 스페셜  강력한 통화 모멘텀을 보여주는 하위 창의 화살표 GAP가 거래를 안내합니다! 기본 또는 호가 통화가 과매도/과매도 영역(외부 시장 피보나치 수준)에 있을 때 개별 차트의 기본 창에 경고 표시가 나타납니다. 통화 강도가 외부 범위에서 떨어질 때 풀백/반전 경고. 교차 패턴의 특별 경고 추세를 빠르게 볼 수 있는 다중 시간
Katana Scalper Pro
Yuki Miyake
4 (4)
KATANA Scalper for MT4 Product Overview Click here for the simple version: https://www.mql5.com/en/market/product/161751 KATANA Scalper for MT4 is an advanced technical analysis indicator optimized for the MetaTrader 4 platform. It is designed to solve the two biggest challenges in short-term trading (scalping and day trading): "price noise" and "reaction lag." Using a unique signal processing algorithm, it eliminates superficial market fluctuations and extracts the "core momentum" with high
Volumatic VIDyA MT4
Duc Hoan Nguyen
4.5 (4)
Special offer : ALL TOOLS , just $35 each! New tools   will be   $30   for the   first week   or the   first 3 purchases !  Trading Tools Channel on MQL5 : Join my MQL5 channel to update the latest news from me Volumatic VIDYA (Variable Index Dynamic Average) 는 트렌드를 추적하고 각 트렌드 단계에서 매수 및 매도 압력을 분석하기 위해 설계된 고급 지표입니다. 가변 지수 동적 평균(Variable Index Dynamic Average)을 핵심 동적 평활화 기술로 활용하여 이 도구는 주요 시장 구조 수준에서 가격 및 거래량 역학에 대한 중요한 통찰력을 제공합니다. MT5 버전 보기:  Volumatic VIDyA MT5 다른 제품 보기:    모든 제품 To use iCustom
Slayer Binary
Abdulkarim Karazon
5 (1)
슬레이어 바이너리는 이진 옵션 1캔들 스트라이크 화살표 표시기입니다. 이 지표는 성배를 찾는 사람들을 위한 것이 아닙니다. 일반적으로 거래에 있어 비현실적인 접근법이기 때문입니다. 이 지표는 꾸준한 성공률을 제공하며, 자금 관리와 일일 목표와 함께 사용하면 더욱 신뢰할 수 있습니다. 이 지시기에는 아래에 나열된 여러 기능이 포함되어 있습니다: 기능 재도색 없음: 지시기는 활력을 다시 칠하지 않습니다;화살표가 주어지면, 가격이 반대 방향으로 움직여도 그 화살표는 그 자리에 머무릅니다. 통계 패널: 전체 승률 %와 연속된 최대 손실-승리 신호 등 지표 성능 통계를 보여주는 패널 다이버전스 기반 검증된 논리: 이 지표는 다이버전스 전략을 사용해 매수/매도 화살표를 결정합니다. 6개 이상의 추가 필터: 인디케이터에는 승률을 높이고 무제한 콤보를 테스트할 수 있는 다양한 필터가 있습니다. 거래는 어떻게 하나요? 단순히 상승 화살표가 인쇄될 때 콜/매수를 열고, 현재 사용 중인 그 시간대의
Gold Scalper Super
Aleksandr Makarov
5 (1)
Gold Scalper Super is an easy-to-use trading system. The indicator can be used as a standalone scalping system on the M1 time frame, as well as part of your existing trading system. Bonus: when purchasing an indicator, Trend Arrow Super is provided free of charge, write to us after purchase. The indicator 100% does not repaint!!! If a signal appears, it does not disappear! Unlike indicators with redrawing, which lead to the loss of a deposit, because they can show a signal and then remove it.
제작자의 제품 더 보기
TurnPoint indicator MT5
Mariusz Piotr Rodacki
TurnPoint Indicator – Market Reversal & Trend Signal Tool The TurnPoint Indicator is designed to help traders identify potential turning points and key levels in the market. By analyzing price action, it highlights areas where reversals or continuations are likely to occur, allowing traders to anticipate trend changes more effectively. This tool incorporates advanced logic to filter signals, reducing noise and false alerts. Users can choose between breakout and pullback modes, depending on their
FREE
Dow trend bands
Mariusz Piotr Rodacki
This indicator is not only for trading but also for learning, thanks to it, you can learn to identify trend, support and resistance. You've probably heard about the Dow trend theory, where higher highs and higher lows indicate an uptrend, and lower highs and lower lows indicate a downtrend. This indicator determines this trend based on the Dow Theory. You just need to enter a number representing the number of candles between extremes. The optimal solution is the number 3 (H1 TF), unless you wa
FREE
Trend Edges
Mariusz Piotr Rodacki
5 (1)
The "Trend Edges" indicator determines whether the trend is rising or falling. It is suitable for any time frame (tested on DAX). The indicator should be treated like Bollinger Bands, meaning that if it breaks out upwards, you can buy with a stop loss below the lower edge. Find a trending pair, index or CFD. Additionally : -Sound alert on trend change. -Alert Notification -Alert Notification on your mobile phone Check my other indicator "Trend Edges histogram"
FREE
Donchian Trend Histogram
Mariusz Piotr Rodacki
Donchian channels are a tool in technical analysis used to determine the relative volatility of a market and the potential for price breakouts. Can help identify potential breakouts and reversals in price, which are the moments when traders are called on to make strategic decisions. These strategies can help you capitalize on price trends while having pre-defined entry and exit points to secure gains or limit losses. Using the Donchian channel can thus be part of a disciplined approach to managi
FREE
Cross MA histogram
Mariusz Piotr Rodacki
The Cossover MA Histogram indicator is a simple tool showing the trend based on crossover of moving averages. Simply specify two mobving averages and addicional parameters like MA method and Applied price. When fast MA is above slow MA the histogram is green, indicating an uptrend. When MA fast is below MA slow the histogram is red, indicating an downtrend.
FREE
MA Cross Histogram Oscillator (MT5) The MA Cross Histogram Oscillator is a custom indicator designed to visualize the relationship between two moving averages in the form of a color-coded histogram. Instead of drawing standard MA lines on the chart, it highlights the strength and direction of the trend by comparing the difference between a fast and a slow moving average. Green bars – bullish momentum (fast MA is above slow MA and rising). Red bars – bearish momentum (fast MA is below slow MA and
FREE
Trend Edges Histogram
Mariusz Piotr Rodacki
This indicator is an addition to "Trend Edges." The "Trend Edges histogram" indicator determines whether the trend is rising or falling. It is suitable for any time frame (tested on DAX). Find a trending pair, index or CFD. Additionally : -Sound alert on trend change. -Alert Notification -Alert Notification on your mobile phone Check my other indicators.
FREE
TurnPoint indicator MT4
Mariusz Piotr Rodacki
TurnPoint Indicator – Market Reversal & Trend Signal Tool The TurnPoint Indicator is designed to help traders identify potential turning points and key levels in the market. By analyzing price action, it highlights areas where reversals or continuations are likely to occur, allowing traders to anticipate trend changes more effectively. This tool incorporates advanced logic to filter signals, reducing noise and false alerts. Users can choose between breakout and pullback modes, depending on thei
FREE
Time Trigger EA MT5
Mariusz Piotr Rodacki
TimeTriggerEA - Automated Trading on Schedule Overview TimeTriggerEA is a sophisticated automated trading system that executes trades based on precise time triggers combined with technical analysis. Unlike traditional EAs that monitor markets continuously, TimeTriggerEA operates on a strict schedule, opening only one carefully analyzed position per day at your specified time. ️ Important Notice The EA has not been tested on the market, but you can now find the right time and direction using the
FREE
Dow Histogram v1
Mariusz Piotr Rodacki
You've probably heard about the Dow trend Theory, where higher highs and lows indicate an uptrend, and lower highs and lows indicate a downtrend. This indicator determines this trend based on the Dow Theory. You just need to enter a number representing the number of candles between extremes. The optimal solution is the number 3, unless you want to have the trend from M5 but you're on M1, then you need to multiply this number by 5. Check various combinations to trade with the trend. In the scree
FREE
MA Cross Histogram Oscillator (MT4) The MA Cross Histogram Oscillator is a custom indicator designed to visualize the relationship between two moving averages in the form of a color-coded histogram. Instead of drawing standard MA lines on the chart, it highlights the strength and direction of the trend by comparing the difference between a fast and a slow moving average. Green bars – bullish momentum (fast MA is above slow MA and rising). Red bars – bearish momentum (fast MA is below slow MA and
FREE
Comfort zone signal
Mariusz Piotr Rodacki
The " Comfort Zone Signal " indicator identifies a daily zone that, when broken, has a high probability of the market continuing the established trend . Upon signal, the indicator calculates stop loss and take profit, which can be set by you. You can also set the trend. If the price is above the MA, it looks only for long positions, if below, it looks only for short positions. You can choose to ignore the moving average and display all signals. Additionally, you have the risk percentage displ
FREE
MA Search 3
Mariusz Piotr Rodacki
This indicator allows you to overlay three different moving averages on the chart simultaneously. Each of these moving averages has additional settings such as: -Time frame -Shift -MA method -Applied price Using this indicator, you can easily set up three moving averages and find the one that suits you the best. You can also use this indicator to determine the trend when the moving averages cross.
FREE
Kombajn Signal
Mariusz Piotr Rodacki
The indicator still has a few bugs but is ready for testing. This is my first indicator that determines entry and exit points. The entry point is based on breaking the peaks determined by a channel indicating highs and lows (invisible channels). TP1 is a probable target at which most positions can be closed. The channel determining the opening and closing of positions is based on different assumptions. The red stop loss line is determined based on lows and highs. The stop loss can be adjusted a
FREE
Crossover MA Histogram
Mariusz Piotr Rodacki
The Cossover MA Histogram indicator is a simple tool showing the trend based on crossover of moving averages. Simply specify two mobving averages and addicional parameters like MA method and Applied price. When fast MA is above slow MA the histogram is green, indicating an uptrend. When MA fast is below MA slow the histogram is red, indicating an downtrend.
FREE
필터:
Vance Fill
197
Vance Fill 2024.05.31 03:17 
 

사용자가 평가에 대한 코멘트를 남기지 않았습니다

리뷰 답변