Adaptive Moving average EA
- 지표
-
Nardus Van Staden
 전문 트레이더, 소프트웨어 개발자 및 전략가입니다.
안녕하세요.
알고리즘 트레이딩의 동적인 세계에 기여하고자 열정적이고 숙련된 소프트웨어 개발자로 자신을 소개하겠습니다. 혁신적인 솔루션을 만들기 위한 깊은 열정으로 다양한 자격과 전문성을 가져왔습니다. 저는 최근 13년 동안 전문 트레이더로 활동하였으며, 경력 동안 다양한 상품을 거래하고 큰 성공을 거두었습니다. 또한 프로 트레이더를 위한 학교인 Forex Mastery의 소유자입니다. - 버전: 2.0
- 활성화: 5
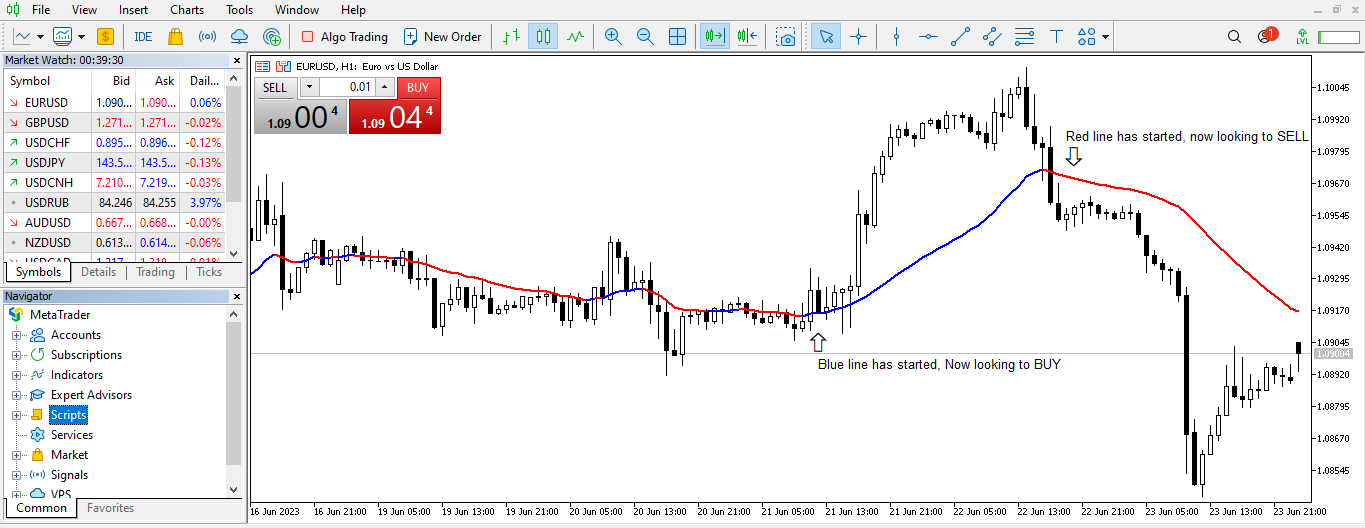
The Adaptive EMA consists of 3 lines:
Yellow, Blue and Red
If a yellow line appears, it means the market is entering Consolidation, Range, Contraction and no opportunities are available.
If a Blue line appears, It means prices are accumulating, and now being marked up, so you are now entering a buy market with a strong Bullish trend.
If a Red line appears, it means prices are now being marked down, price distribution is underway, so you are now entering a Sell market with a strong Bearish trend.
You can change the line colours as you please.
A strong and accurate piece of software for its price, developed for beginner and experienced traders.
Accuracy= 97%