Structure and Supply and Demand Zones MT5
- 지표
- 버전: 1.0
- 활성화: 5
When it comes to trading in the financial markets, there's no question that the banks have a major advantage. They have access to vast amounts of resources, including high-powered trading algorithms, in-depth market research, and teams of experienced traders. But what if you could level the playing field and trade like the banks do?
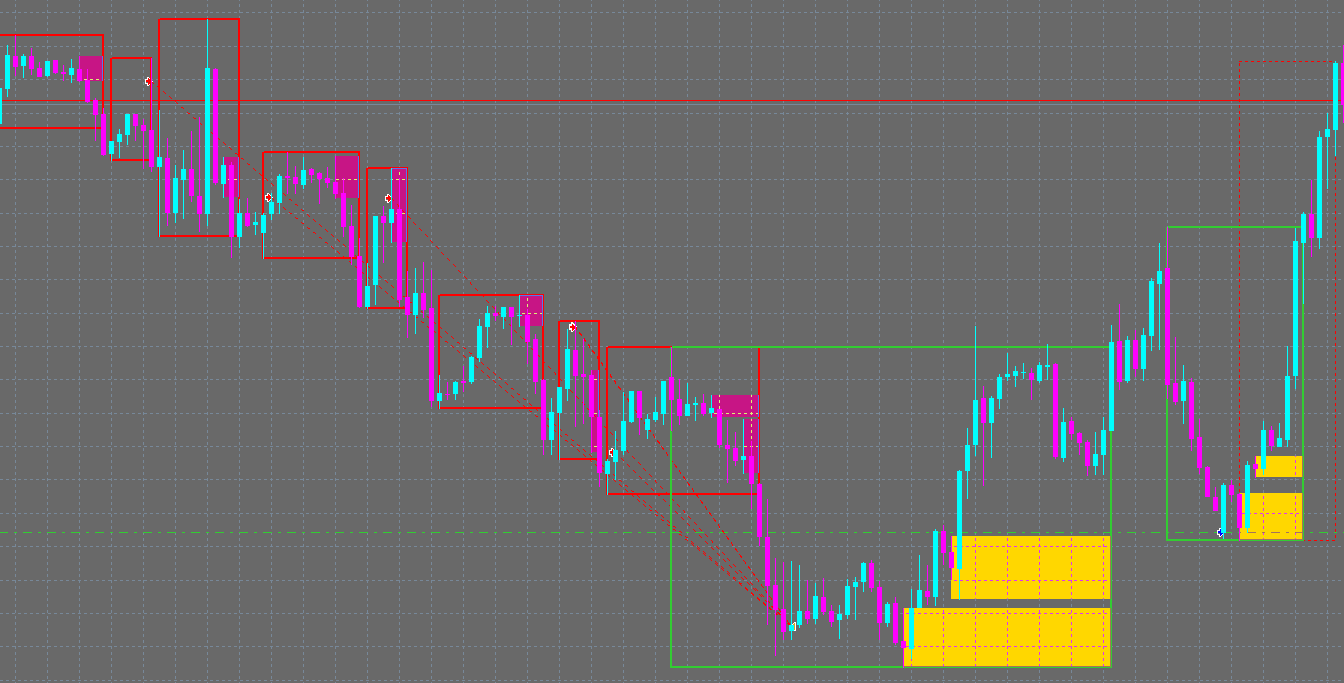
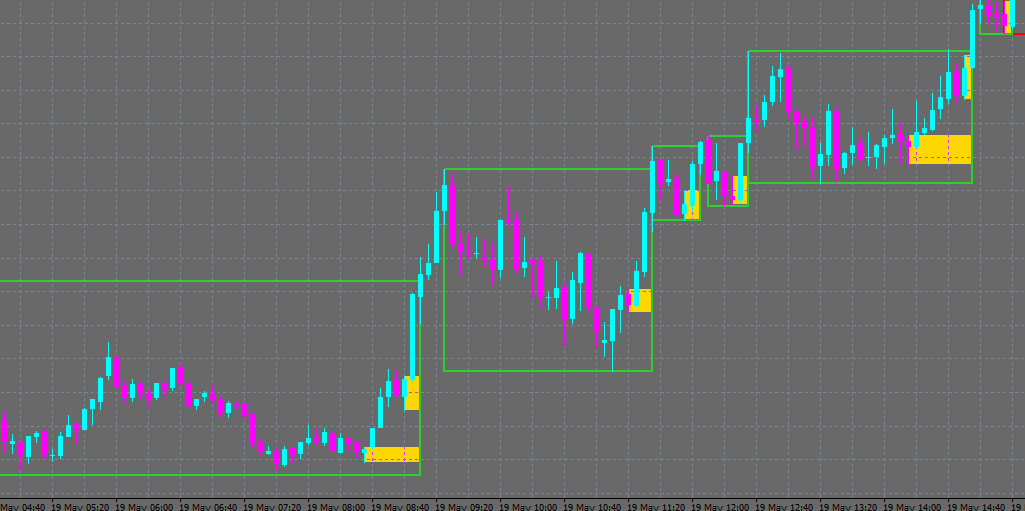
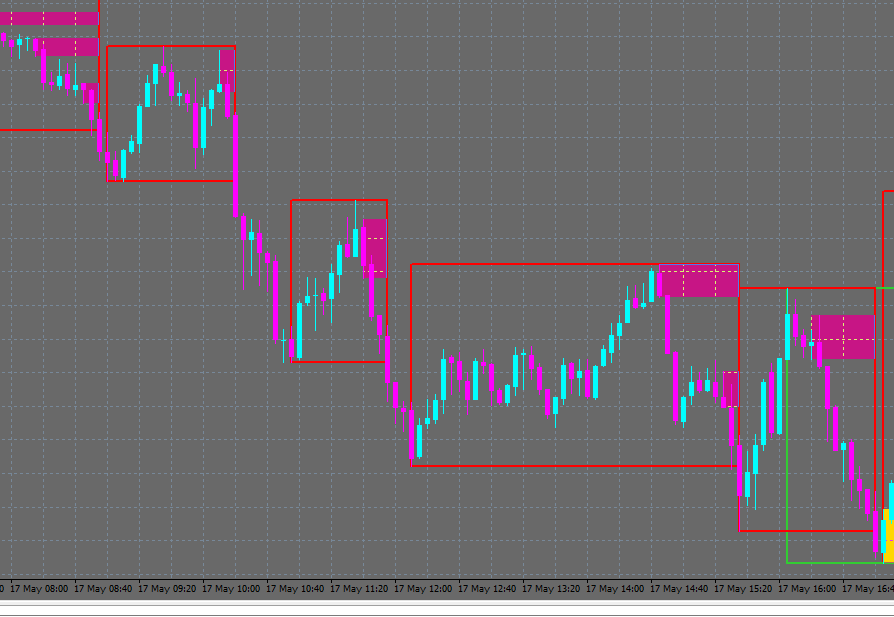
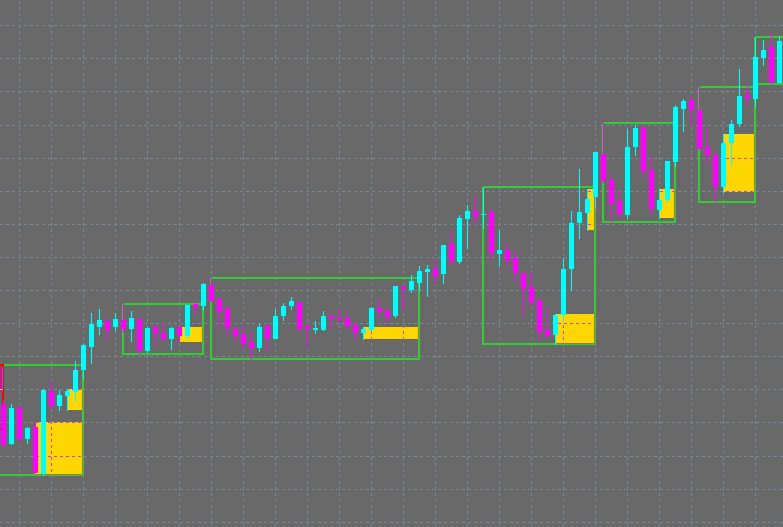
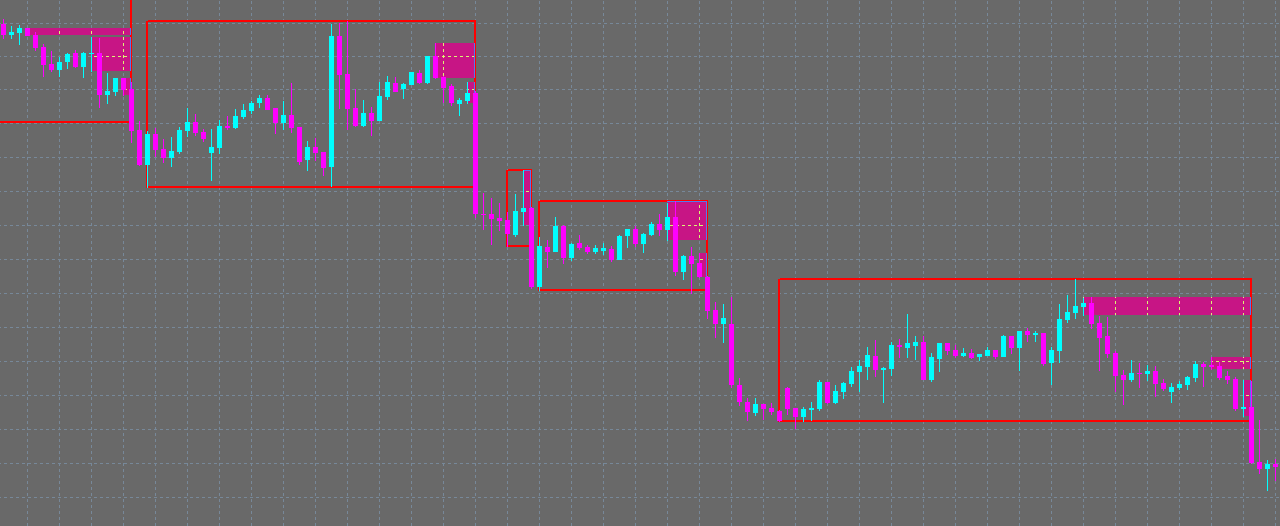
That's exactly what our Smart Money Indicator allows you to do. By providing you with critical insights into market structure and supply and demand zones, you can make more informed trading decisions that align with the strategies used by the banks. This can give you a significant competitive advantage in the market and increase your chances of success.
When you use our Smart Money Indicator, you can start to see the market in a whole new way. You'll have access to real-time data and visualizations that help you identify key trends and patterns that may be invisible to the naked eye. This allows you to anticipate price movements and take advantage of profitable opportunities before they slip away. Stop being left on the wrong side of the market and download the Smart Money Indicator now!