MACD Divergence Box Indicator FREE
- 지표
- FXsolutions
- 버전: 1.0
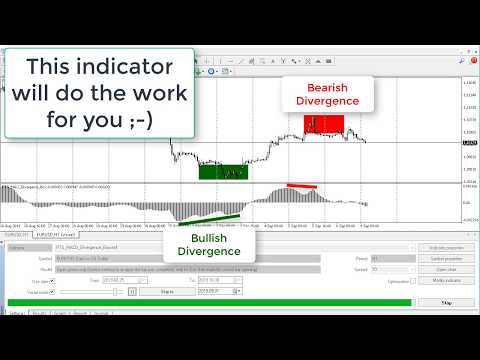
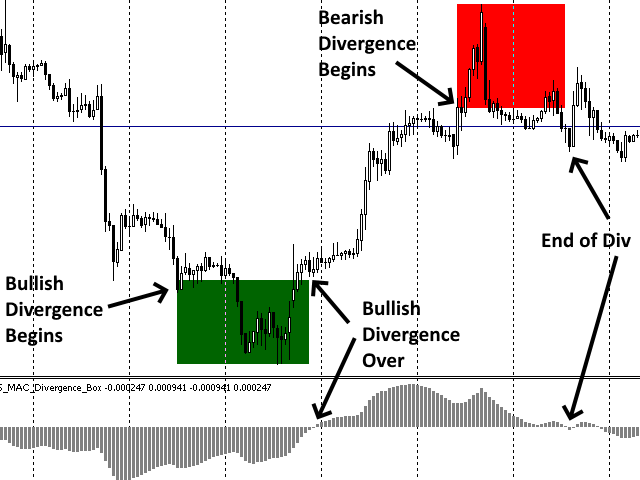
This indicator draws regular bullish and bearish divergences in real-time onto the charts.
The algorithm to detect those divergences is based on my 10+ years experience of detecting divergences visually.
The divergences are drawn as green and red rectangles on the charts. You can even do forward testing in the visual mode of the strategy tester.
This FREE Version is restricted to EURUSD and GBPUSD. The full version without restrictions is here: https://www.mql5.com/en/market/product/42732
Parameters
- Fast EMA Period: The period of the fast EMA of the MACD. Default value is 12.
- Slow EMA Period: The period of the slow EMA of the MACD. Default value is 26.
- Signal SMA Period: The period of the signal SMA of the MACD. Default value is 9.
- colorMACD: The color of the MACD in the histogram window. Default color is gray.
- colorBullishBoxes: The color of the bullish boxes in the chart window. Default color is darkgreen.
- colorBearishBoxes: The color of the bearish boxes in the chart window. Default color is red.
- maxBars: Here you can define how many candles backward the indicator should draw the divergences. Default value is 5000.
You can choose a lower value like 2000 for performance reasons (less calculation)


Very very good!!!