당사 팬 페이지에 가입하십시오
- 조회수:
- 68599
- 평가:
- 게시됨:
- 업데이트됨:
-
이 코드를 기반으로 한 로봇이나 지표가 필요하신가요? 프리랜스로 주문하세요 프리랜스로 이동
The indicator is based on several methods that can be chosen by the Method input variable:
Method 1: Fourier's extrapolation; the frequencies are calculated using the Quinn-Fernandes Algorithm
Method 2: Autocorrelation Method
Method 3: Weighted Burg Method
Method 4: Burg Method with Helme-Nikias weighting function
Method 5: Itakura-Saito (geometric) method
Method 6: Modified covariance method
Methods 2-6 are the methods of linear prediction. The linear prediction is based on finding the future values as the linear functions of the past values. Assume that we have a number of prices x[0]..x[n-1] where the higher index is compliant with the recent price. The prediction of the future price x[n] is calculated as
x[n] = -Sum(a[i]*x[n-i], i=1..p)
where a[i=1..p] - coefficients of the model, p - order of the model. The listed methods 2-6 find the coefficients a[] by decreasing the mean-root-square error on the training last n-p bars. Of course, we can reach the zero error of prediction if we directly solve the set of equations mentioned above with n=2*p by the Levinson-Durbin method. Such method of prediction is called Prony Method. Its disadvantage is the instability during the prediction of the future values of the series. That's why this method has not been included.
The other input parameters are:
LastBar - the number of the last bar in the past data
PastBars - the number of past bars used for the prediction of the future values
LPOrder - the order of the linear model as a fraction from the number of the past bars (0..1)
FutBars - the number of future bars in the prediction
HarmNo - the maximum number of frequencies for the Method 1 (0 means all frequencies)
FreqTOL - the imprecision of the frequeincies calculation for the Method 1 (if it is >0.001 it can't converge)
BurgWin - the number of the weighting function for the Method 2 (0=Rectangular 1=Hamming 2=Parabolic)
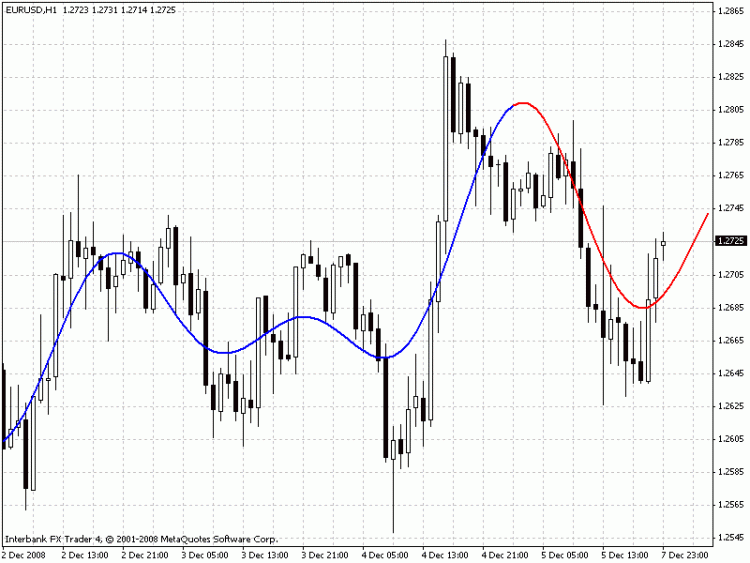
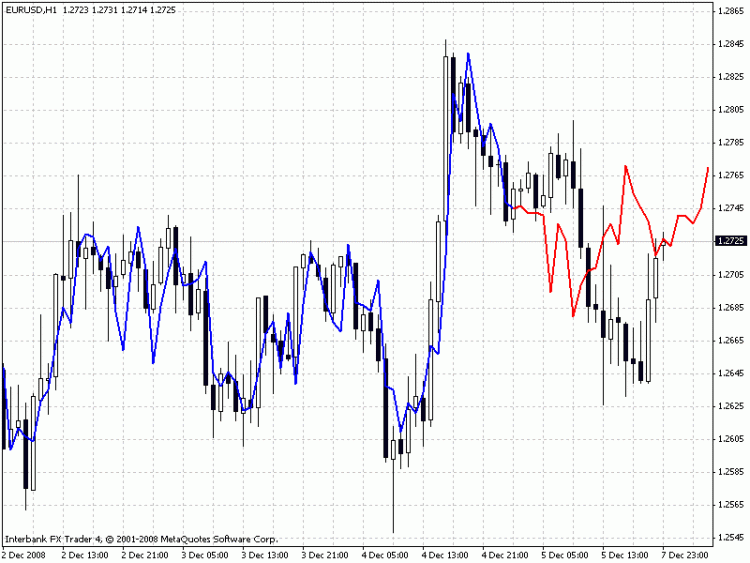
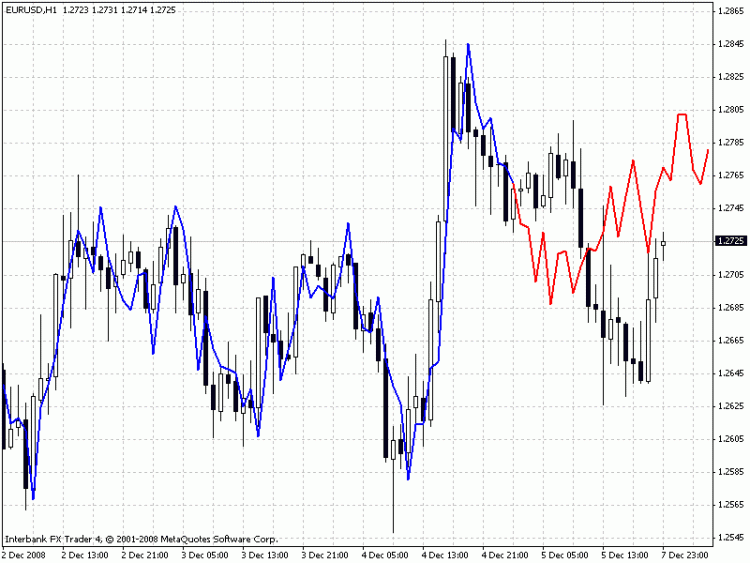
The indicator draws two lines: the blue line shows the prices of the model on the training bars, the red line shows the predicted future prices.
Examples:
Method 1 (the extrapolation of Fourier series)
Method 3 (Burg's method)
Method 6 (Modified Covariance Method)
Petition:
If somebody will be successful in developing a profitable EA based on this indicator I ask to share his/her ideas via the e-mail specified inside the code.
MetaQuotes Ltd에서 러시아어로 번역함.
원본 코드: https://www.mql5.com/ru/code/8608
 Burg Extrapolator
The EA uses the method of Burg's linear prediction that was taken from my indicator Extrapolator.mq4.
 Ryan_Jones_SM
It shows where to buy and where to sell via the arrows. If a trend occurs then it will bring profit, if there is no trend, there will be no profit.
 Capture MouseEvents on Chart
This set of functions enables one to capture mouse events on your trading chart. One can simmulate buttons to trigger actions in the EA.
 Volatility Indicator
Judging by the code of indicator, it calculates the difference between the maximum maximums and minimum minimums of prices of the candlesticks for the last 20 bars (parameter). The result is displayed in points.


