거래 로봇을 무료로 다운로드 하는 법을 시청해보세요
당사를 Facebook에서 찾아주십시오!
당사 팬 페이지에 가입하십시오
당사 팬 페이지에 가입하십시오
스크립트가 마음에 드시나요? MetaTrader 5 터미널에서 시도해보십시오

CCI_Bar - MetaTrader 5용 지표
- 조회수:
- 5605
- 평가:
- 게시됨:
-
 이 코드를 기반으로 한 로봇이나 지표가 필요하신가요? 프리랜스로 주문하세요
프리랜스로 이동
이 코드를 기반으로 한 로봇이나 지표가 필요하신가요? 프리랜스로 주문하세요
프리랜스로 이동
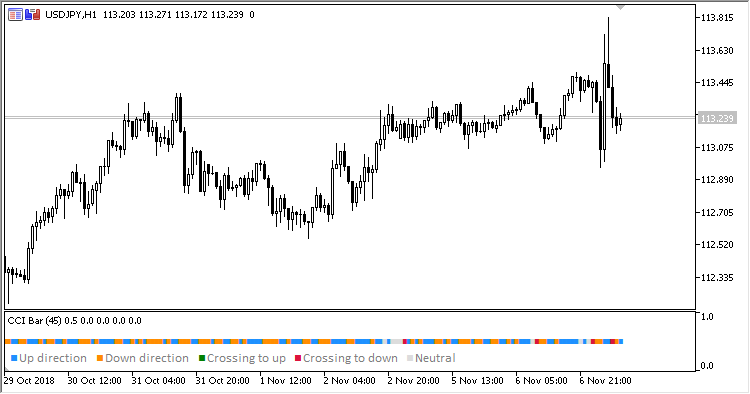
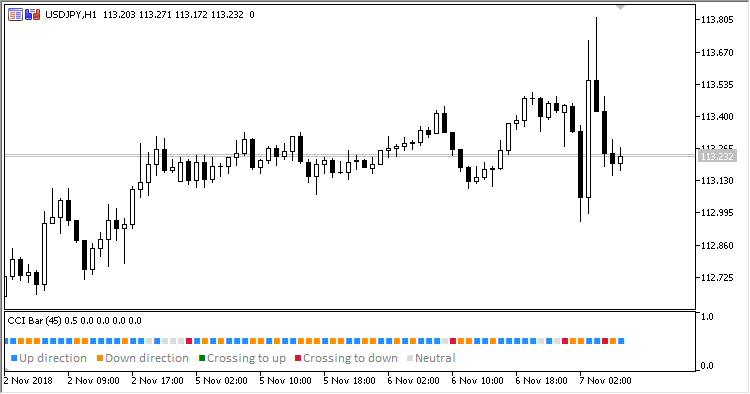
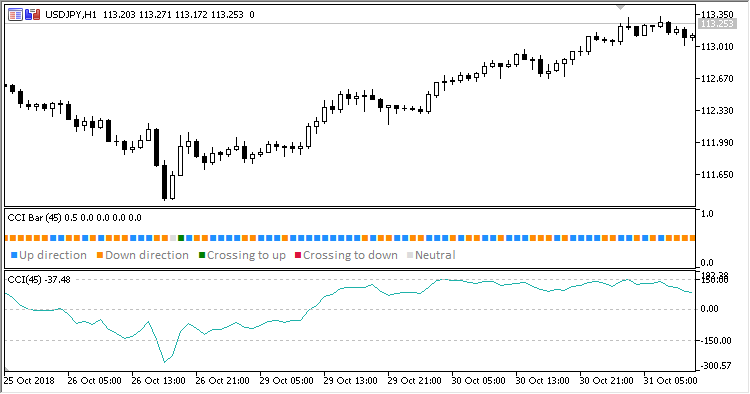
CCI Bar signal indicator. The indicator displays the colored diagram of CCI indicator status relative to its oversold/overbought levels (above/below/upward crossing/downward crossing).
There are five inputs:
- CCI period - CCI calculation period
- Overbought - overbought level
- Oversold - oversold level
- Buy entry level
- Sell entry level
- In case CCI value is within Overbought/Oversold levels
- If CCI values are increasing, blue signal pointers are set
- If CCI are falling, orange signal pointers are set
- If CCI value is beyond Overbought/Oversold levels, the gray signal pointers are set
- If Buy entry level is crossed upwards, the green signal pointer is placed
- If Sell entry level is crossed downwards, the red signal pointer is placed
MetaQuotes Ltd에서 러시아어로 번역함.
원본 코드: https://www.mql5.com/ru/code/23104
 E-Friday
Have a look at the daily bar #1. Position trailing.
Specified_Time_Range_Candles
Specified time range candles indicator
SpearmanRankCorrelation_Histogram_HTF
SpearmanRankCorrelation_Histogram indicator with the timeframe selection option available in input parameters
SpearmanRankCorrelation_Histogram
SpearmanRankCorrelation indicator implemented in the form of a color histogram