당사 팬 페이지에 가입하십시오

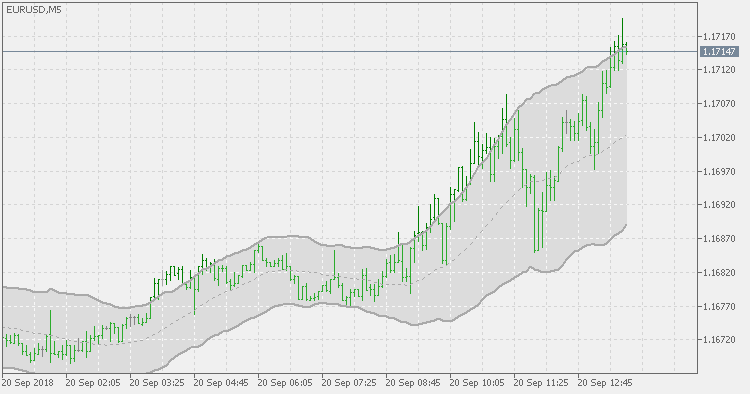
Headley's acceleration bands - MetaTrader 5용 지표

- 조회수:
- 7374
- 평가:
- 게시됨:
-
 이 코드를 기반으로 한 로봇이나 지표가 필요하신가요? 프리랜스로 주문하세요
프리랜스로 이동
이 코드를 기반으로 한 로봇이나 지표가 필요하신가요? 프리랜스로 주문하세요
프리랜스로 이동
Definition :
Acceleration Bands :
The Acceleration Bands System was introduced in 2002 by Price Headley. The concept is based on the idea of getting into a trade just as the security is trending but before its price moves heavily in one direction or another.
The Acceleration Bands measure volatility over a user-defined number of bars (default is often the past 20 bars). They are plotted using a simple moving average as the midpoint, with the upper and lower bands being of equal distance from the midpoint, similar to Bollinger Bands.
Interpretation of Acceleration Bands :
The indicator uses the concept of “acceleration” to get into and out of stocks. (It, of course, can also be used on any other type of asset where charting data can be obtained.)
When price breaks the top band, this is generally an indication that the stock has broken out and thereby “accelerated”. This might be taken as a buy signal.
JMA Z-score
JMA Z-score
Laguerre RSi with Laguerre filter - extended
Laguerre RSi with Laguerre filter - extended