거래 로봇을 무료로 다운로드 하는 법을 시청해보세요
당사를 Facebook에서 찾아주십시오!
당사 팬 페이지에 가입하십시오
당사 팬 페이지에 가입하십시오
스크립트가 마음에 드시나요? MetaTrader 5 터미널에서 시도해보십시오

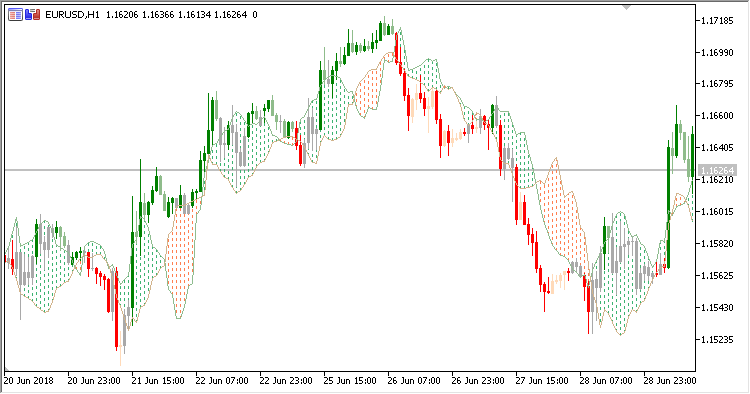
LBR_Paint_Bars - MetaTrader 5용 지표
- 조회수:
- 7741
- 평가:
- 게시됨:
-
 이 코드를 기반으로 한 로봇이나 지표가 필요하신가요? 프리랜스로 주문하세요
프리랜스로 이동
이 코드를 기반으로 한 로봇이나 지표가 필요하신가요? 프리랜스로 주문하세요
프리랜스로 이동
LBR Paint Bars indicator draws color candles depending on a trend direction. The trend is defined by the location of two volatility lines. A color cloud histogram is displayed along these two lines.
It has four inputs:
- Factor - ATR share in the cloud width calculation
- ATR period - ATR calculation period
- HL period - cloud borders calculation period
- Color Candles - display color candles (Yes/No)
Calculation:
Edge1 = Min(Lowest(Low, HL period) + Delta;
Edge2 = Max(Highest(High, HL period) - Delta;
where:
Delta = ATR(ATR period) * Factor
If color candles display is enabled (Color Candles = Yes):
- if the bullish candle is closed above the cloud, a green candle is displayed
- if the bearish candle is closed above the cloud, a light-green candle is displayed
- if the bearish candle is closed below the cloud, a red candle is displayed
- if the bullish candle is closed below the cloud, an orange candle is displayed
MetaQuotes Ltd에서 러시아어로 번역함.
원본 코드: https://www.mql5.com/ru/code/22200
Rahul_Mohindar_Osc
Rahul Mohindar oscillator
Standard_Deviation_Moving_Average_Ratio
Standard Deviations/Moving Average Ratio indicator
Hurst_Oscillator
Hurst oscillator indicator
XHullTrend_Digit_System
The indicator implements a breakout system using the XHullTrend_Digit indicator cloud