거래 로봇을 무료로 다운로드 하는 법을 시청해보세요
당사를 Facebook에서 찾아주십시오!
당사 팬 페이지에 가입하십시오
당사 팬 페이지에 가입하십시오
스크립트가 마음에 드시나요? MetaTrader 5 터미널에서 시도해보십시오

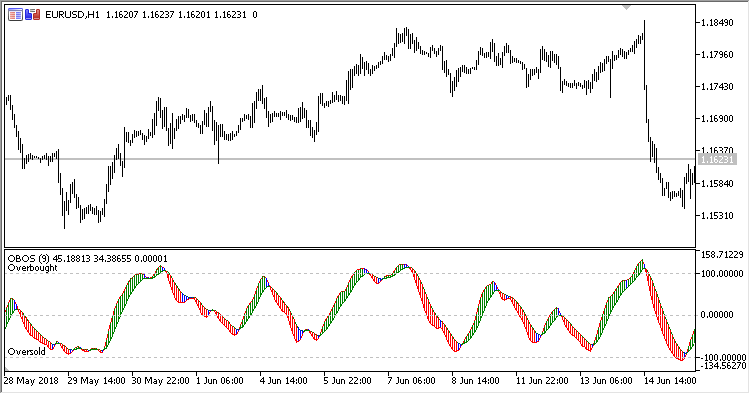
OBOS - MetaTrader 5용 지표
- 조회수:
- 12954
- 평가:
- 게시됨:
-
 이 코드를 기반으로 한 로봇이나 지표가 필요하신가요? 프리랜스로 주문하세요
프리랜스로 이동
이 코드를 기반으로 한 로봇이나 지표가 필요하신가요? 프리랜스로 주문하세요
프리랜스로 이동
Overbought/Oversold oscillator displays the market movement direction color histogram in a separate window.
The indicator has three input parameters:
- Period - calculation period
- Overbought - overbought level
- Oversold - oversold level
Calculation:
Up = EMA(EMA((WP-EMA(WP)) / StdDev(WP)))
Down = EMA(Up, Period)
where:
EMA - EMA(PRICE_WEIGHTED, Period)
StdDev - StdDev(PRICE_WEIGHTED, Period)
WP - weighted price (High+Low+Close+Close)/4
The upward movement is displayed by the green histogram
The downward movement is displayed by the red histogram
Uncertain movement is displayed by the gray histogram
MetaQuotes Ltd에서 러시아어로 번역함.
원본 코드: https://www.mql5.com/ru/code/22186