당사 팬 페이지에 가입하십시오

DiffMA_Histogram - MetaTrader 5용 지표
- 조회수:
- 4101
- 평가:
- 게시됨:
-
 이 코드를 기반으로 한 로봇이나 지표가 필요하신가요? 프리랜스로 주문하세요
프리랜스로 이동
이 코드를 기반으로 한 로봇이나 지표가 필요하신가요? 프리랜스로 주문하세요
프리랜스로 이동
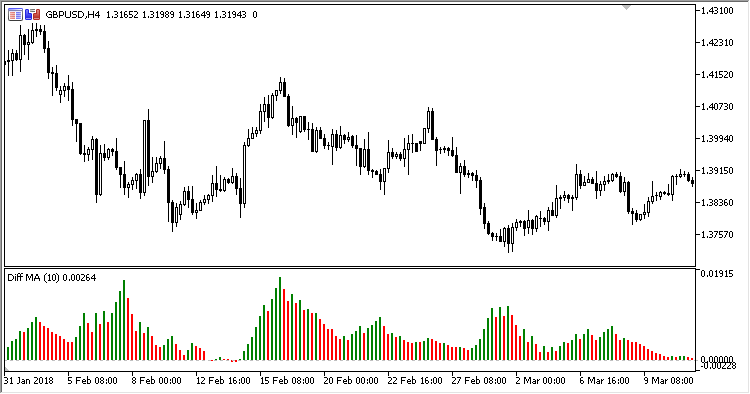
The indicator displays the difference between the DiffMA lines, i.e., two moving averages calculated within the range of one-direction candlesticks.
The calculations doe not require the availability of DiffMA - the indicator calculates it by itself.
It has two configurable parameters:
- Period - DiffMA calculation period
- Applied price - DiffMA calculation price
Calculations:
DMA = (Up - Dn)
where:
UP = SumUp / CountUp
DN = SumDn / CountDn


SumUp = Sum of SMA(Applied price, 1) for all bullish candlesticks within the Period
SumDn = Sum of SMA(Applied price, 1) for all bearish candlesticks within the Period
CountUp - number of bullish candlesticks within the Period
CountDn - number of bearish candlesticks within the Period
MetaQuotes Ltd에서 러시아어로 번역함.
원본 코드: https://www.mql5.com/ru/code/21317
DiffMA
Two moving averages on the range of one-direction candlesticks
Bears_Bulls_Impuls
An indicator of bull/bear power
Flat_Trend
A market state indicator
AbsolutelyNoLagLwma_Range_Channel_HTF
Indicator AbsolutelyNoLagLwma_Range_Channel with the timeframe selection option available in the input parameters.