당사 팬 페이지에 가입하십시오

CMC - MetaTrader 5용 지표
- 조회수:
- 5810
- 평가:
- 게시됨:
-
 이 코드를 기반으로 한 로봇이나 지표가 필요하신가요? 프리랜스로 주문하세요
프리랜스로 이동
이 코드를 기반으로 한 로봇이나 지표가 필요하신가요? 프리랜스로 주문하세요
프리랜스로 이동
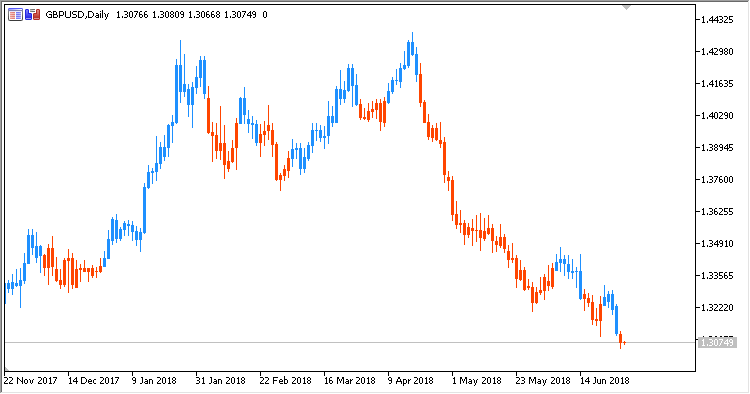
Indicator CMC (Clear Method Candles) displays colored candlesticks, based on the existing market trend. It is calculated by the "pure" method (without using any other indicators, only price) and has no configurable parameters. It is based on indicator Clear Method Histogram.
Calculations:
-
If Swing > 0, then candlesticks are blue
-
If Swing < 0, then candlesticks are red
where:
HH = Maximum(High, PrevHH)
LH = Minimum(High, PrevLH)
HL = Maximum(Low, PrevHL)
LL = Minimum(Low, PrevLL)
-
If Swing > 0 and High < HL:
Swing = -1
LL = Low
LH = High
-
If Swing < 0 and Low > LH:
Swing = 1
HH = High
HL = Low
-
Otherwise, if High < HL:
Swing = -1
LL = Low
LH = High
-
Otherwise, if Low > HL:
Swing = 1
HH = High
HL = Low
MetaQuotes Ltd에서 러시아어로 번역함.
원본 코드: https://www.mql5.com/ru/code/21274
CMH
Indicator CMH (Clear Method Histogram) displays a color histogram of the current market trend.
VC
Indicator VC (Volatility Channel by Larry Williams).
CRF
Indicator CRF (Cumulative Rotation Factor) displays the states of the market: Uptrends/downtrends/consolidation.
JB_Volatility
JB Volatility - market volatility oscillator marking its state in color.