당사 팬 페이지에 가입하십시오

CVI - MetaTrader 5용 지표
- 조회수:
- 6529
- 평가:
- 게시됨:
-
 이 코드를 기반으로 한 로봇이나 지표가 필요하신가요? 프리랜스로 주문하세요
프리랜스로 이동
이 코드를 기반으로 한 로봇이나 지표가 필요하신가요? 프리랜스로 주문하세요
프리랜스로 이동
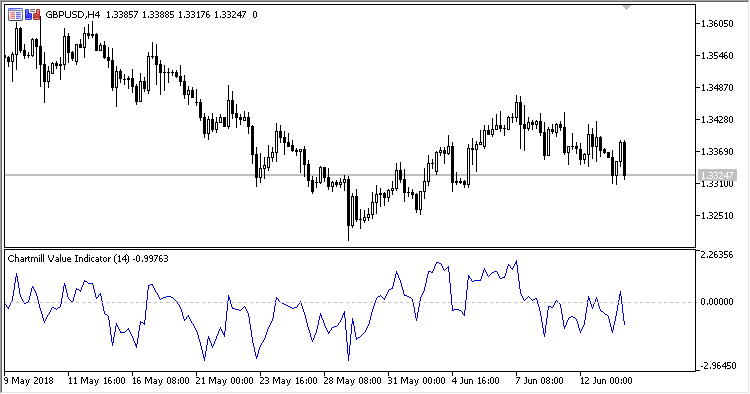
Oscillator CVI (Chartmill Value Indicator) was described by Dirk Vandycke in the Technical Analysis of Stocks & Commodities magazine in January, 2013.
CVI represents a standard deviation from moving average and can be applied to any price series over any period.
The concept is simple. As prices grow, they will finally move away from the moving average. At the end, the moving average will also start growing. When prices start flatting out or consolidating, the gap between the prices and the moving average will start decrease, while the MA will continue moving inertially for some time.
As compared to other oscillators, the indicator displays overbought/oversold areas more efficiently, since the gap between the price and the MA is divided by the average true range, which strongly hardens deviating from the moving average on longer trend-following areas.
The indicator has three configured parameters:
- Period - calculation period;
- Method - Moving Average calculation method;
- Calculation mode - deviation calculation mode:
- ATR - by ATR;
- Sqrt ATR - by square root of ATR.
Calculation:
where:
VC = MedianMA(Period, Method)
ATR - Average True Range(Period)
If Calculation mode = ATR:
otherwise:
MetaQuotes Ltd에서 러시아어로 번역함.
원본 코드: https://www.mql5.com/ru/code/21105