당사 팬 페이지에 가입하십시오

MAMA + FAMA - MetaTrader 5용 지표

- 조회수:
- 11991
- 평가:
- 게시됨:
-
 이 코드를 기반으로 한 로봇이나 지표가 필요하신가요? 프리랜스로 주문하세요
프리랜스로 이동
이 코드를 기반으로 한 로봇이나 지표가 필요하신가요? 프리랜스로 주문하세요
프리랜스로 이동
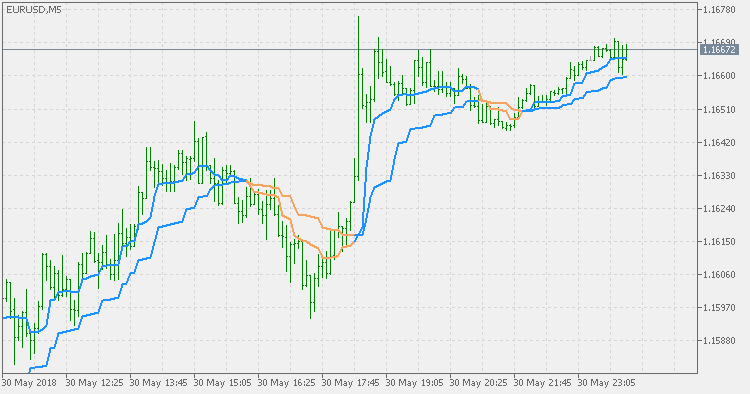
Usually MESA Adaptive Moving Average (MAMA) is displayed on chart as two values. That sometimes is misleading since it is not often explained what are the traders actually looking at then.
The second value displayed on chart is what John Ehlers calls "a Following Adaptive Moving Average (FAMA)", and this indicator uses the combined values of MAMA and FAMA to assess the trend of the market.
CCI - EMA based
Instead of using Simple Moving Average it uses EMA (Exponential Moving Average), and instead of using mean deviation it uses EMA deviation (originally published here EMA Deviation).
CCI Stochastic
This is a Stochastic of CCI. When Stochastic is applied to CCI and the bounds are in the fixed 0 to 100 range, the trend assessment can be done using that fact too.
MAMA + FAMA Oscillator
Combination of MAMA (MESA Adaptive Moving Average) and FAMA (Following Adaptive Moving Average) made as an oscillator.
MAMA + FAMA Multi Timeframe
The MESA Adaptive Moving Average (MAMA) and the Following Adaptive Moving Average (FAMA) combination made to be multi timeframe.