거래 로봇을 무료로 다운로드 하는 법을 시청해보세요
당사를 Facebook에서 찾아주십시오!
당사 팬 페이지에 가입하십시오
당사 팬 페이지에 가입하십시오
스크립트가 마음에 드시나요? MetaTrader 5 터미널에서 시도해보십시오

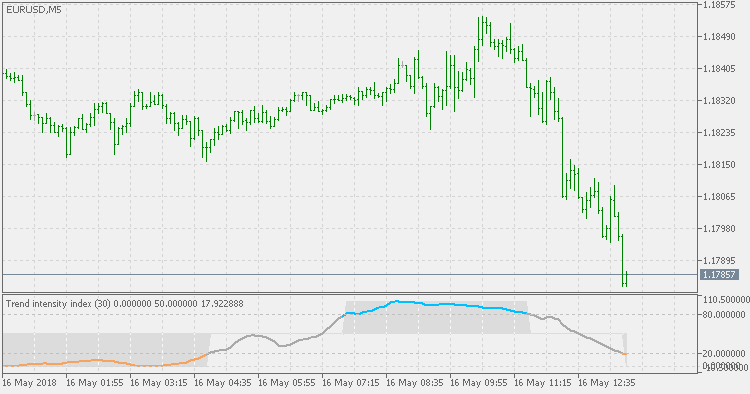
Trend Intensity Index - MetaTrader 5용 지표

- 조회수:
- 14339
- 평가:
- 게시됨:
-
 이 코드를 기반으로 한 로봇이나 지표가 필요하신가요? 프리랜스로 주문하세요
프리랜스로 이동
이 코드를 기반으로 한 로봇이나 지표가 필요하신가요? 프리랜스로 주문하세요
프리랜스로 이동
Trend Intensity Index as described by M.H.Pee in his article "Trend Intensity Index".
To calculate a 30-day Trend Intensity Index (TII), follow these steps:
- Obtain the 60-day simple Moving Average by adding the Closes for the past 60 days and dividing the result by 60.
- Find the deviation of each of the recent 30 Closes from the 60-day Moving Average. The deviation is up if the Close is above the Moving Average, and down when the Close is below the average.
- Up deviation values are obtained by subtracting the Moving Average from the Close.
- Down deviations are calculated by subtracting the Close from the Moving Average.
- The TII allows you to find out what percentage of these deviations is up or down. For a 30-day TII, you should have 30 deviations from the 60-day Moving Average.
Leader of the MACD - Extended
This version extends the basic version of Leader of the MACD with some options that are adding more flexibility to the usage of the indicator.
Trend Strength Average
Trend Strength Average uses some of the 4 regular types of averages for trend strength assessment.
Heiken Ashi Zone Trade
Heiken Ashi Zone Trade indicator is based on 3 indicators: Heiken Ashi, Accelerator Oscillator, and Awesome Oscillator.
Heiken Ashi Zone Trade - Separate
This version of Heiken Ashi Zone Trade indicator is made to display values in a separate window - that way it will not interfere with the other on-chart indicators and can be easier to read the states in some cases.