당사 팬 페이지에 가입하십시오

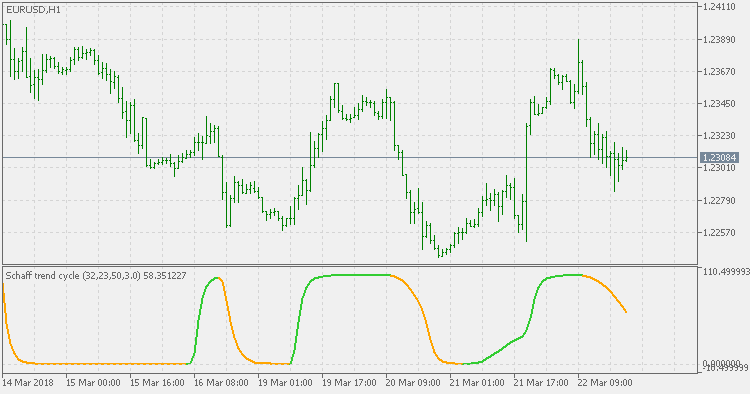
Schaff Trend Cycle - MetaTrader 5용 지표

- 조회수:
- 28901
- 평가:
- 게시됨:
-
 이 코드를 기반으로 한 로봇이나 지표가 필요하신가요? 프리랜스로 주문하세요
프리랜스로 이동
이 코드를 기반으로 한 로봇이나 지표가 필요하신가요? 프리랜스로 주문하세요
프리랜스로 이동
The Schaff Trend Cycle (STC) indicator is the product of combining Slow Stochastics and the Moving Average Convergence/Divergence (MACD). The MACD has a reputation as a trend indicator, but it's also notorious for lagging due to its slow responsive signal line. The improved signal line gives the STC its relevance as an early warning sign to detect currency trends.
How the STC Works
The STC detects up and down trends long before the MACD. It does this by using the same Exponential Moving Averages (EMAs), but adds a cycle component to factor currency cycle trends. Since currency cycle trends move based on a certain amount of days, this is factored into the equation of the STC indicator to give more accuracy and reliability than the MACD.
Since the MACD is nothing more than a series of EMAs with a signal line, the STC was improved compared to the MACD. MACD has a 12- and 26-period EMA with a nine-period signal line. STC indicator improved on this by incorporating a 23- and 50-period EMA with a cycle component used as the 10-period signal line. Since we can factor cycle trends based on X amount of days, we can then know how far and how long a trend lasts in terms of potential pips to earn.
In terms of indicators both old and new, the STC indicator is quite original in its conception. Never before has an indicator been developed using a cycle component. Most use some form of Moving Average, particularly EMAs, as a base because it's easier to calculate and it focuses on recent prices rather than a simple Moving Average's long data set of closing prices.
MACD of average
This is a MACD that can use average for input price instead of using "pure" price. That can help in filtering some false signals, but the main purpose of this code is to show how simple some things can be done using MetaTrader 5. In addition to all usual options when it comes to this type of indicators, option to have color changes based on MACD slope change or MACD crossing signal line.
RSI of average
A very well known RSI of average is made with, all in all, 3 lines of a code in a main loop (color assignment on RSI slope change included in those 4 lines). This one can be used as template for some other indicator and can provide a simplicity solution for those that think that everything is very complicated in MetaTrader 5.
 ErrorDesc
Printing GetLastError() and MqlTradeResult retcode as text description.
Renko 2.0 Offline
This non-trading utility generates custom symbol information on 1M chart. Configure using Tick Size, Pip Size, Points or R. Now with Asymetric Reversals!