SD Indicator MT4
- インディケータ
- バージョン: 3.0
- アップデート済み: 30 3月 2023
- アクティベーション: 10

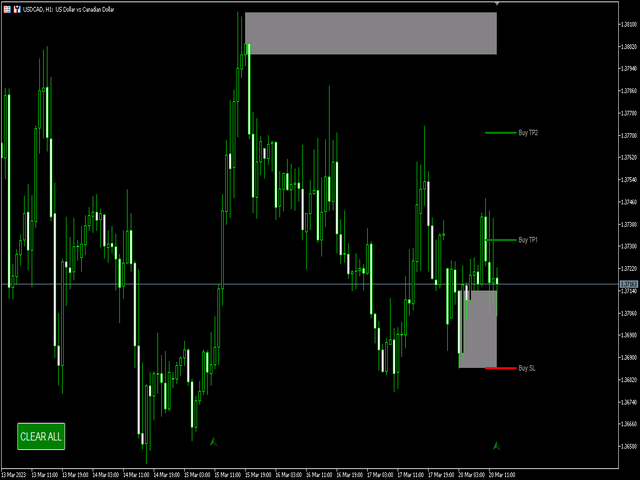
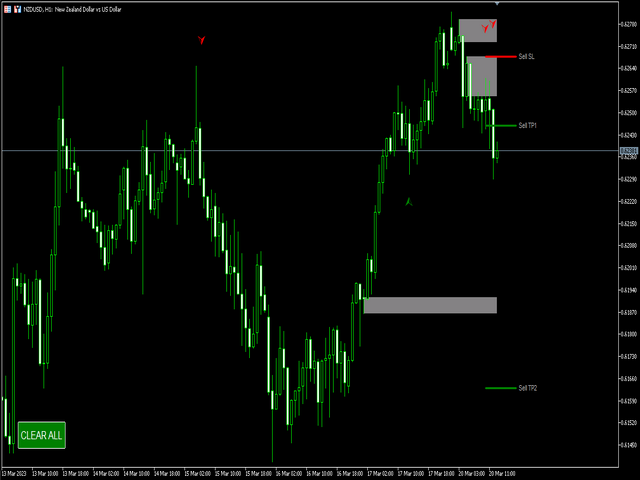
The SD Indicator is a powerful tool in the world of Forex trading, that combines two classical strategies: Support/Resistance levels and Supply/Demand zones.
The indicator helps traders to identify potential trading opportunities in the market with high accuracy.
Support and resistance levels are key price levels where buying and selling pressure converge, leading to potential price reversals. The SD Indicator identifies these levels in real-time and provides traders with a clear picture of where the market may turn. This information can be used to make informed trading decisions.
Supply and demand zones are areas where buying and selling pressure are imbalanced, leading to significant price movements. These zones can be identified by finding areas where price has previously stalled or reversed. The SD Indicator helps traders to identify these zones and provides insight into potential trading opportunities.
By combining these two classical strategies, the indicator offers traders a unique perspective on the market. This indicator is designed to provide accurate and reliable information, making it an essential tool for traders of all levels.
The indicator is easy to use and can be customized to suit individual trading styles. It can be used on a range of timeframes, from intraday to long-term trading. Additionally, this indicator works well with other technical analysis tools, such as moving averages and trend lines, further enhancing its effectiveness.
Overall, the SD Indicator is a must-have tool for any Forex trader looking to gain an edge in the market. Its ability to identify key support and resistance levels, as well as supply and demand zones, make it a valuable asset in any trading strategy.
Some of signals of the indicator are being published in Telegram for free: https://t.me/realforexrobots
Join us!
Some of signals of the indicator are being published in Telegram for free: https://t.me/realforexrobots
Join us!
Currency pairs, timeframe, terminal
Trading on any currency pair is possible.
Timeframe - any, but it's recommended to select higher timeframes.
Terminal - MetaTrader 4.
Parameters
- TimeFrame - timeframe, on which the indicator will search entering points. Even if the SD Indicator is set on a different timeframe, it still will be working on that timeframe, that was specified in this parameter.
- AddCandle - if "true", the indicator will take into account several additional candles to make entering points more safe.
- StopLossIndent - if "true", the indicator will change its automatic safe StopLoss level.
- SLIndent - an indent from the automatic safe StopLoss level, if parameter "StopLossIndent"=true.
- AutoTrailingStop - if "true", the indicator will automatically count a current TrailingStop level. Good parameter for tests.
- TrailingStop - TrailingStop value in points. If "0" - disabled. Works only if parameter "AutoTrailingStop"=false.
- Ignore_TP2 - if "true", the indicator will not wait for a TakeProfit2 level to be reached.
- PushNotifications - if "true", the indicator will send Push-notifications, when there is a trading signal.
- PlayAlertSound - if "true", the indicator will play alert sound, when there is a trading signal.
- ShowAlerts - if "true", the indicator will show alerts, when there is a trading signal.
- ShowChannels - if "true", the indicator will additionally draw price channels on a chart.
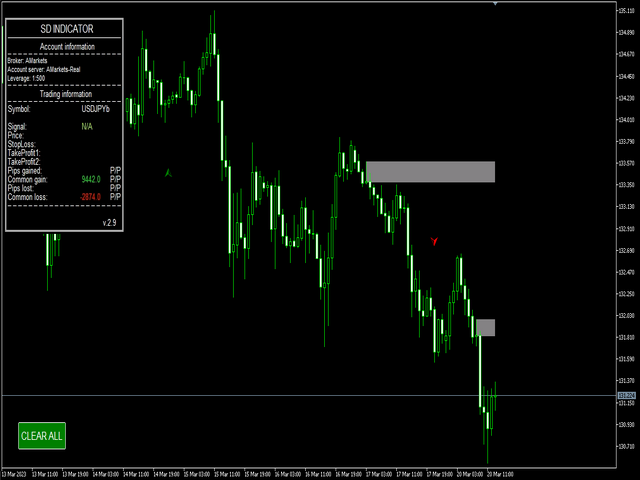
- InformationPanel - if "true", the indicator will display an information panel.
- Panel_Language - language of the information panel.
- TextColor - font color of the information panel.
Default parameters can be used.