Perfected RSI HTF
- インディケータ
- バージョン: 1.10
- アップデート済み: 14 7月 2022

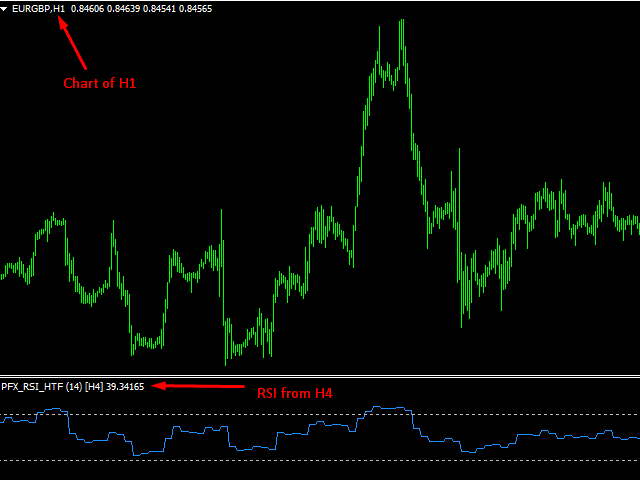
Perfected RSI (Relative Strength Index) HTF (Higher Time Frame) is perhaps the most advanced and reliable HTF indicator. Highly optimized in terms of execution, the indicator comes with standard settings of the RSI indicator which is supplied with the MT4 platform.
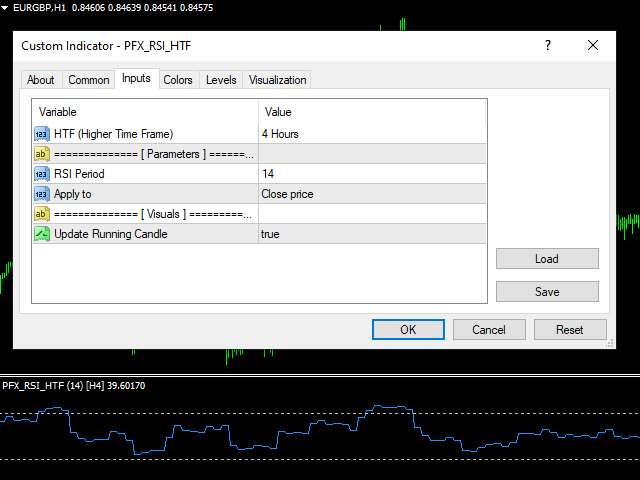
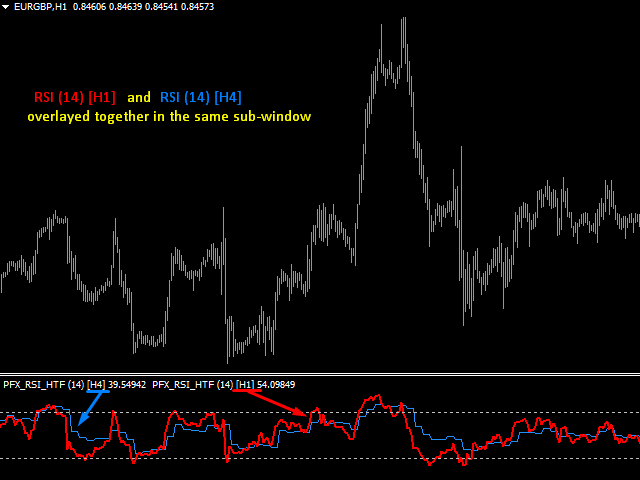
Place the indicator on the chart, any timeframe. You may select a higher time frame in indicator inputs. The same indicator can be used on a chart multiple times to draw RSI from multiple timeframes or for different RSI period values.
A must-have tool to overlay the RSI from a higher time frame on the existing chart with a lower time frame.
"People who don’t use the tools given to them only injure themselves."
"We shape our tools and afterward our tools shape us."
Key Features
- Highly Optimized: Perhaps the fastest RSI HTF indicator out there. Only updates the newly appeared candles and doesn't update the past candles. Filters duplicate ticks received in MT4. This feature alone makes it extremely suitable for running on VPS.
- Update Running Candle: Some EAs don't require reading the running candle [0] value. Thus ignoring its case saves good value CPU cycles on VPS. This is another feature contributing to optimization.
- Error Checks: Indicator overlays MA from higher time from or current time frame. In case erroneously we toggle the chart's time frame to a higher time frame than that selected in the indicator for overlaying, it will shift to the current time frame.
- All Parameters of the Standard RSI are applicable.
- Coded With Care: Unlike many poorly coded indicators out there, this will never explode (shattering of buffer values) when newer candles appear due to dragging of the chart on the left or bulk appearance of candles on right after sudden connection of a disconnected terminal.
Errors or Bug Fixing
Though extreme care and testing has been done for this indicator, we are still humans and mistakes/bugs can arise. Please report the same and we will always be ready to fix them up at the earliest.