The Oscillometer
- インディケータ
- バージョン: 3.6
- アップデート済み: 7 2月 2023
- アクティベーション: 5
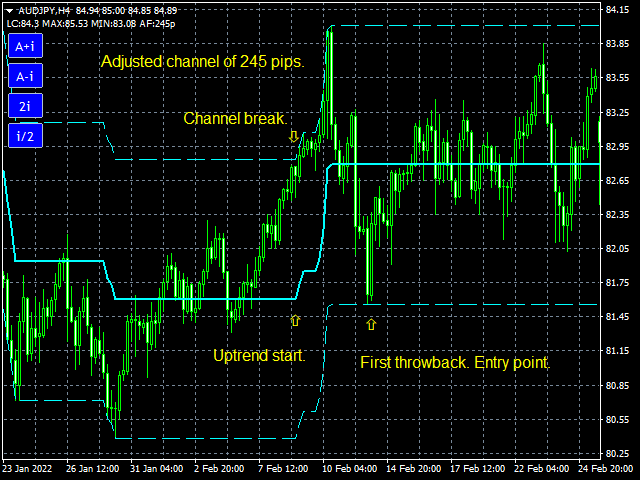
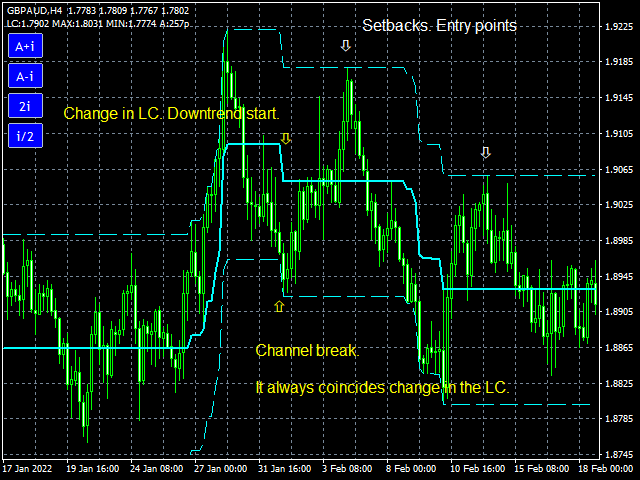
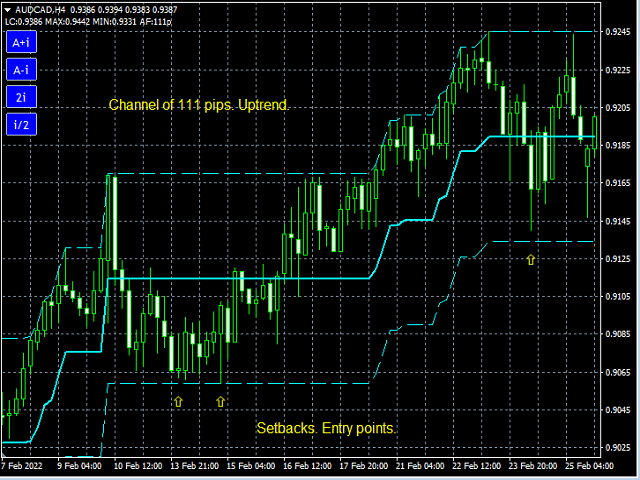
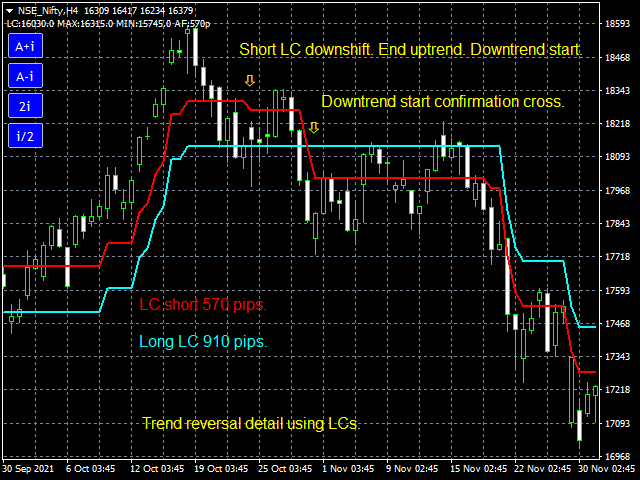
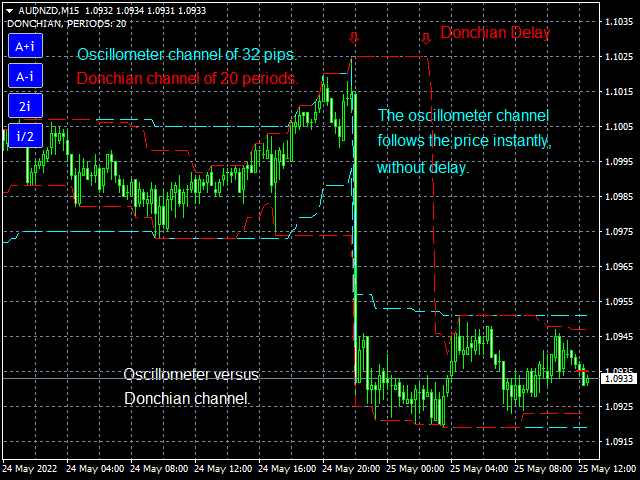
It is a new indicator that frames the price movement and tracks it. It consists of oscillation channel and its center line CL. For its calculation it is only necessary to introduce the amplitude of the channel. Because of this, it is a non-lagging indicator as it is not calculated based on a number of previous candlesticks. It removes any level of noise, showing the underlying price movement cleanly via the center line. It allows you to easily identify the beginnings and ends of the trend, which will occur when the price breaks the channel. It also allows you to identify retracement points, which will occur when the price touches the limits of the channel without breaking it. All this in a visually obvious way. The indicator is applicable to any class of securities.
Features:
- It allows to dynamically vary the amplitude of the channel, on the graph, by means of the blue controls.
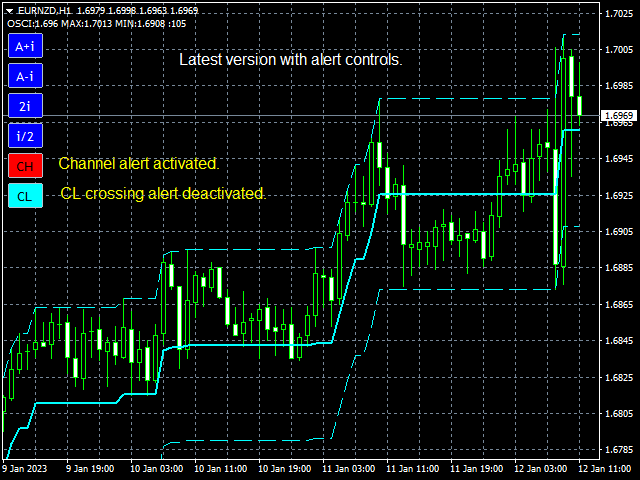
- It has channel and center line alerts, through two controls.
- It is independent of the time frame in which it is. Being transferable from one time frame to another without further ado.
- It has built-in candle filtering function.
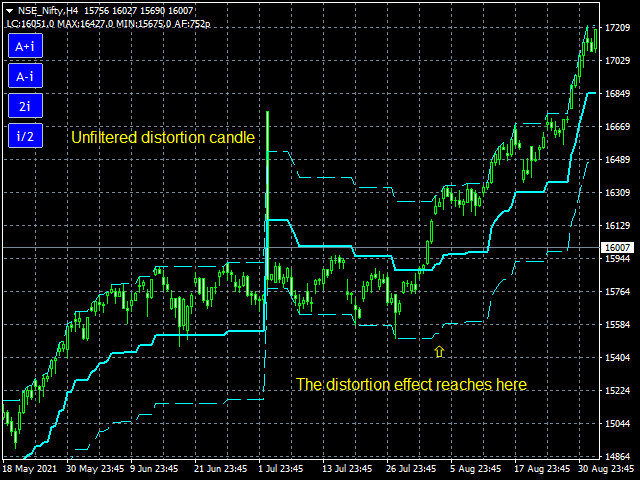
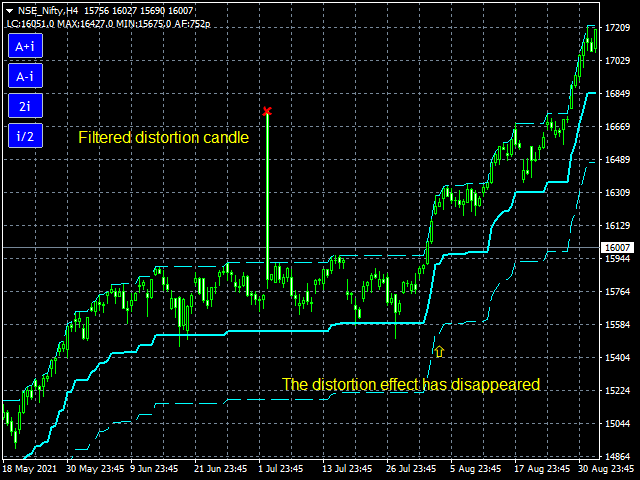
- The indicator is robust to price distortions.
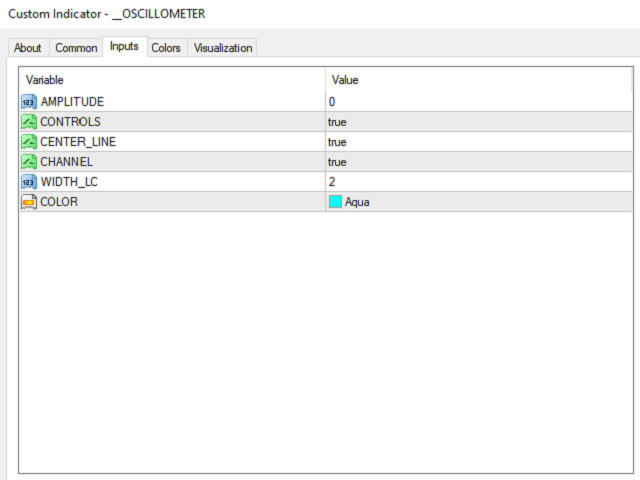
- The indicator has only one parameter for its calculation: the amplitude of the channel, given in pips. With value 0, the indicator calculates one by default.
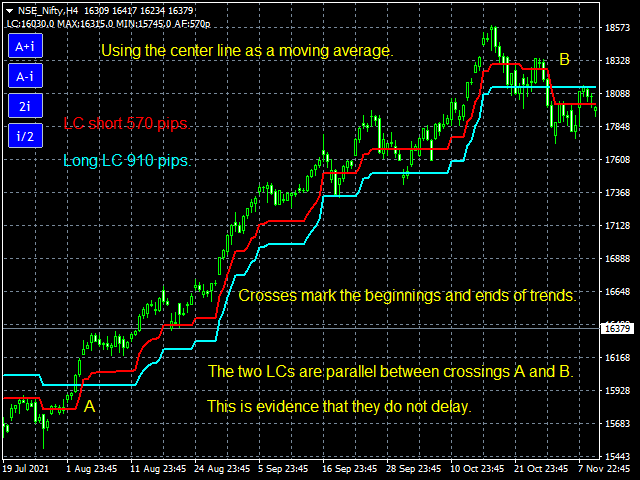
- Both the channel and the central line can be deactivated. If only the central line is used, it can be used as a moving average, but the central line is not behind the price and the moving average is.
- At the top left of the graph, the values of the center line and the limits of the channel on the first formed candle, as well as the amplitude in pips, are displayed. When placing the cursor on the indicator, it shows us the amplitude in pips.
Blue controls.
They are four. The top two, marked with A+i and A-i , increase or decrease the amplitude by incrementing . The two lower ones, marked with 2i and i/2 , increase or decrease the increment by multiplying it, or dividing it, by 2. All this in pips.
Alert controls.
-CH: activates the channel break alert.
-CL: activates the centerline crossover alert (a crossover is considered when the current candle closes on the opposite side of the center line of the close of the previous candle), with red signal on the candlestick.
Controls turn red when activated.
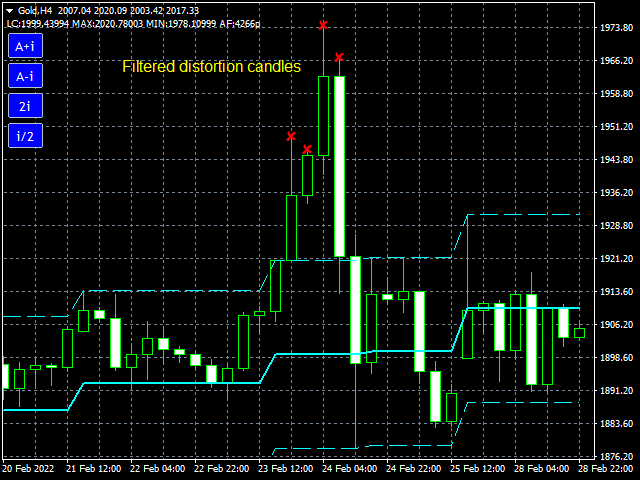
Filtering candles.
By double clicking on a candle it is filtered, being marked with a yellow mark. This feature allows the indicator to ignore candlesticks that are clearly a price distortion or manipulation. With a new double click on the candle its filtering is deactivated.
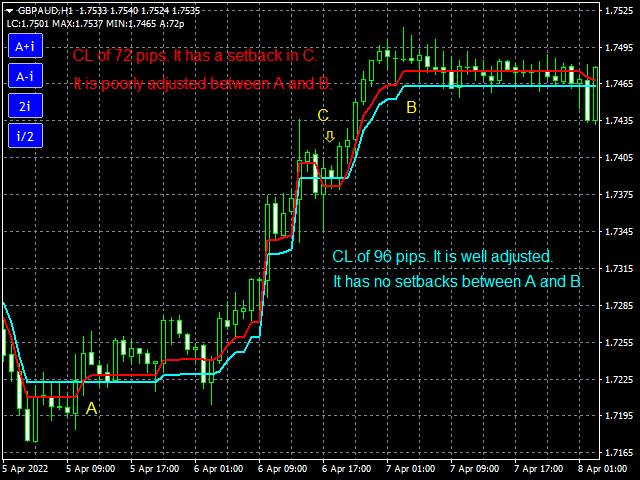
Indicator adjustment.
For the indicator to be useful it is necessary to adjust it to the price, modifying it with the controls until it shows no setbacks and frames the price cleanly. Visually it will be immediately appreciated when the indicator is well adjusted to the price for any section of interest. Once set, the amplitude will be set in the indicator's parameter box.
Stop loss.
It will always be placed outside the channel. A few pips above or below this.
Trailling stop.
Matches the amplitude of the channel.
Recommended indicator: Digital Trend Detector, Deviation Index.
Contact email: fve2022@hotmail.com