Inputs controller

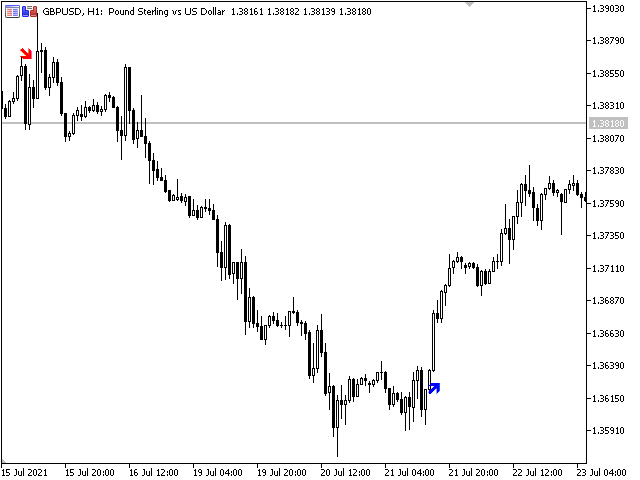
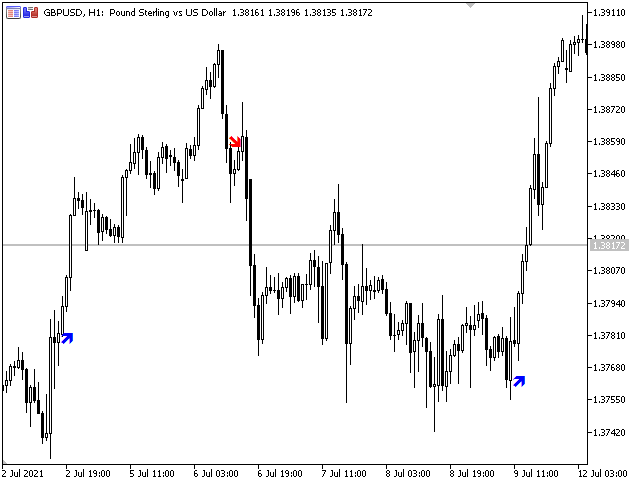
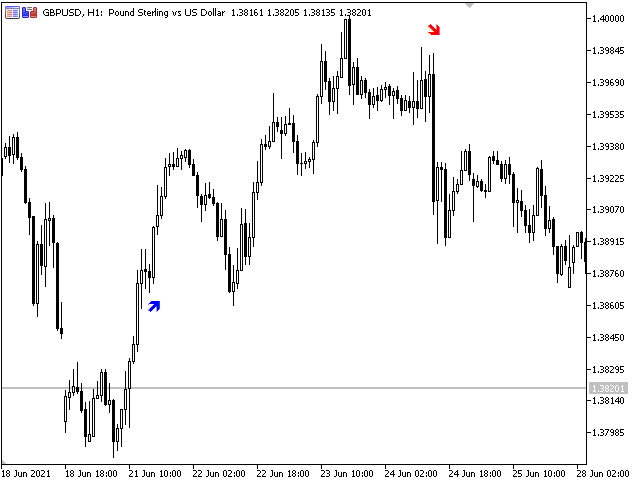
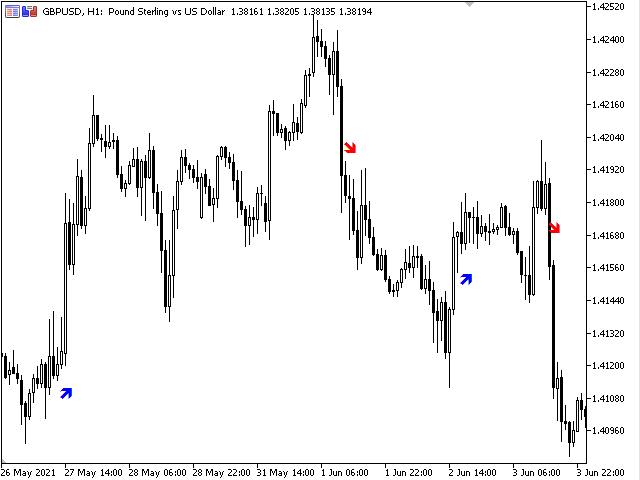
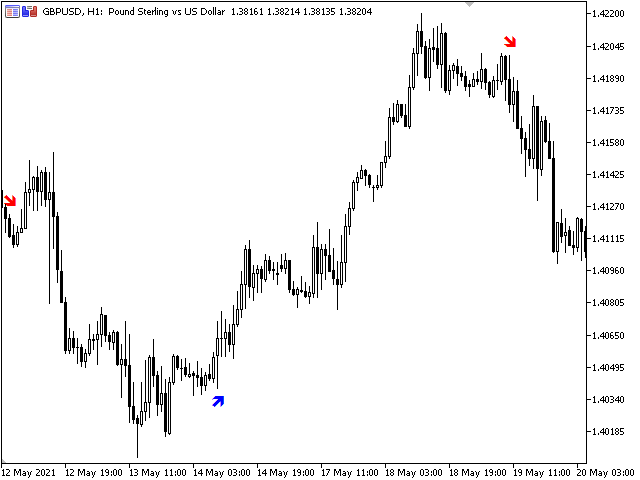
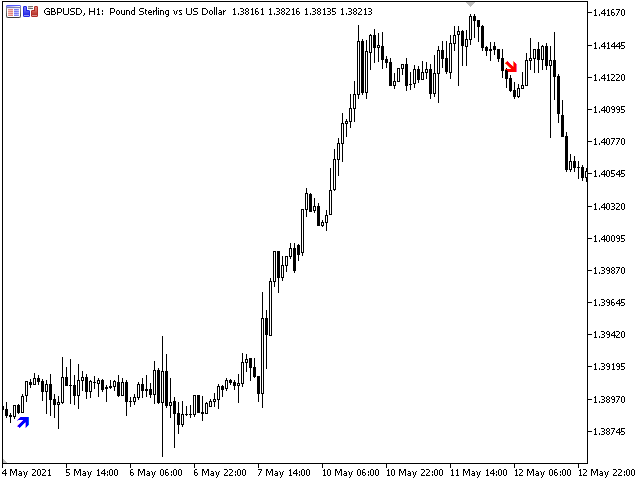
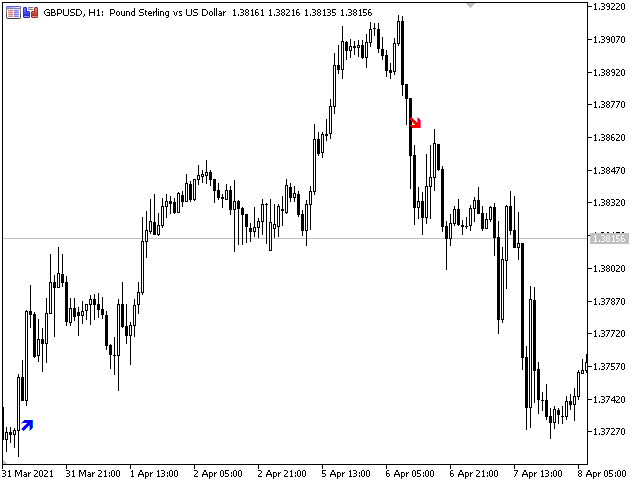
I want again that the wedge light on all the indicators did not converge. No matter how hard you search, you still will not find an indicator that will always and in all conditions give you exclusively profitable signals. As you can see, everything is quite simple, and you don’t even need to analyze anything, in fact. In general, I would say that the Signal No Problem indicator can be a great help for creating your own trading system. It goes without saying that you don’t need to trade only by arrows, add some filters, but don’t overdo it. The indicator was created on the basis of the original indicators for searching for extreme points, the indicator is well suited for determining a reversal or a large sharp jerk to one side, thanks to it you will know when this happens, it will notify you with the appearance of a blue dot to buy red to sell.
おすすめのプロダクト
SimSim Arrow 2MA は 2 つの標準 MA インジケーターです。矢印の交点が取引のシグナルとなります。 MetaTrader 4 用バージョン インジケーターのパラメーターは標準の MA インジケーターに似ており、1 つは低速 MA、もう 1 つは高速 MA です。 交差点で取引のシグナルが発生します。  インジケーターは、高速 MA ラインが低速 MA ラインを交差すると信号を生成します。 操作に対して「CONTROL DEAL」を有効にすると、インジケーター信号に基づいた取引が自動的に開始されます。 インジケーターは、信頼性の高い信号装置として本来の目的に使用できます。 ただし、その二次的な目的は、「 CONTROL DEAL 」ユーティリティのシグナルプロバイダーとして機能することです。 インジケーターとこのユーティリティの共生により、シグナルを確認するだけでなく、それに応じて取引を行うこともできます。 これらのシグナルを効果的に活用したい場合は、無料ユーティリティ「 SimSim Control Deal MT5 」をダウンロードしてください。 「SimS
概要 Advanced Key Levels Predictor EA は、MetaTrader 5 向けに開発された高度なエキスパートアドバイザー(EA)であり、先進的なテクニカル分析と予測アルゴリズムを組み合わせて、市場の重要なレベルを特定し、将来の価格動向を予測します。このEAは、視認性に優れたインジケーターを用いた高度なチャート表示機能を備え、トレーダーの意思決定を支援します。 主な機能 キーレベルの検出 サポート & レジスタンスの自動識別 :高度なアルゴリズムにより重要な価格レベルを自動的に検出 フィボナッチ・リトレースメント :23.6%、38.2%、50%、61.8%、78.6% の主要なフィボナッチ水準を表示 ピボットポイント :日ごとのピボットポイントと対応するサポート/レジスタンスを表示 レベル強度分析 :過去の価格反応に基づいて各レベルの信頼性を評価 予測分析 線形回帰予測 :統計的手法により将来の価格動向を予測 移動平均トレンド分析 :モメンタムに基づいた傾向予測を実施 RSIによる短期予測 :RSIパターンを用いて短期的な価格変動を予測 信頼スコ
The indicator is designed to work on any trading platform. The program is based on proprietary algorithms and W.D.Ganna's mathematics, allowing you to calculate target levels of price movement based on three points with the highest degree of certainty. It is a great tool for stock trading. The indicator has three buttons: NEW - call up a triangle for calculation. DEL - delete the selected triangle. DELS - completely remove all constructions. The probability of achieving the goals is more than 80
Visual Keltner Volatility Expansion Indicator Unleash the Power of Volatility with Precision! The Visual Keltner Volatility Expansion Indicator is a cutting-edge tool meticulously crafted for traders who seek to master market volatility and identify high-probability trading opportunities. Priced at just $65, this indicator offers an unparalleled combination of simplicity and effectiveness, empowering you to adapt and optimize it to your unique trading style. What Does It Do? This indicator leve
Exclusive Bollinger is a professional indicator based on the popular Bollinger Bands indicator and provided with an advanced algorithm. Unlike the standard Bollinger , my Exclusive Bollinger provides better signals and is equipped with flexible settings allowing traders to adjust this indicator to their trading style. In the indicator, you can set up alerts (alert, email, push), so that you won't miss a single trading signal. Exclusive Bollinger for the MetaTrader 4 terminal :  https://www.mql5.
The Pivot Point Pioneer indicator is based on unique indicators capable of detecting extreme points. It is ideal for identifying reversals or sharp price movements in one direction. Thanks to this indicator, you will be informed about upcoming events: a blue dot will appear for a buy signal, and a red dot for a sell signal. This technical indicator allows you to assess the current state of the market and make a decision about entering a trend movement with minimal risk. It uses a process of an
AdaptiveMomentumCCI Indicator The AdaptiveMomentumCCI is a custom technical indicator for MetaTrader 5 that enhances the traditional Commodity Channel Index (CCI) by incorporating adaptive period adjustments, momentum analysis, and signal filtering. It calculates a smoothed CCI based on a user-defined price source (e.g., HLC/3, OHLC/4, or close), with its period dynamically adjusted using the Average True Range (ATR) to reflect market volatility. The indicator features a dual-line system with
Технический индикатор Universal Oscillator является комбинацией торговых сигналов самых популярных и широко используемых осцилляторов. Индикатор представлен гистограммами, а также линиями fast и slow MA, что позволяет расширить список получаемых торговых рекомендаций и работать как по тренду, так и в боковом движении рынка. Таким образом, гистограммы позволяют определить момент пробоя ценовых значений и движение в новой фазе рынка, а линии указывают на зоны перекупленности и перепроданности.  Ос
DYJ TRADINGVIEWはマルチインジケーターレーティングシステムであり、レーティングシグナルカウントと分析ツールを使用して、グローバル市場への参入機会を見つけます DYJ TRADINGVIEWには、市場分析用の10の組み込みインジケーターがあります。 指標ベースの分析は、多くのトレーダーがどの取引を行うか、どこで取引を開始および終了するかを決定するのに役立つために使用されます。 互いに補完し合うことができるいくつかの異なるタイプを使用します。 あなたの市場をフォローするために私たちを使用してください、あなたはより正確な取引を見つけることができます。 格付けに参加しているトレンド指標には、DYJ POWERSIGNAL、ADX、SMA、ボリンジャーバンドが含まれます。 格付けに参加しているオシレーターには、MACD、RSI、ストキャスティクス、アリゲーターが含まれます。 シグナルの数が3以上のときにシグナルを売買する同じ方向を示す3つのインジケーターがある場合、市場取引を開始します。 Input [GENERAL] ViewName           =  "
Victory Channel is a forex trend arrow indicator for identifying potential entry points. I like it, first of all, because it has a simple mechanism of work, adaptation to all time periods and trading tactics. Created on the basis of a regression channel with filters. We display the signals of the Victory Channel indicator on the chart of the price function using a mathematical approach. How it works - when the price breaks through the overbought/oversold zone (channel levels), a buy or sell si
KasTon Trend System: The Complete 2-in-1 Trading Strategy Identify the Trend, Confirm the Signal, and Trade with Confidence! Do you suffer from confusion while trading? Do you find it difficult to determine the market's direction? Are you tired of losing money on false signals? The KasTon Trend System is here as an integrated solution to all these problems. This is not just an indicator; it is a complete trading strategy built on the synergy of two powerful, custom-built indicators. Our main g
MT4版  |  FAQ Owl Smart Levels Indicator は、 Bill Williams の高度なフラクタル、市場の正しい波構造を構築する Valable ZigZag、エントリの正確なレベルをマークする Fibonacci レベルなどの一般的な市場分析ツールを含む 1 つのインジケーター内の完全な取引システムです。 利益を得るために市場と場所に。 戦略の詳細な説明 インジケータを操作するための指示 顧問-取引助手 プライベートユーザーチャット ->購入後に私に書いて、私はプライベートチャットにあなたを追加し、あなたはそこにすべてのボーナスをダウンロードすることができます 力はシンプルさにあります! Owl Smart Levels 取引システムは非常に使いやすいので、専門家にも、市場を勉強し始めて自分で取引戦略を選択し始めたばかりの人にも適しています。 戦略と指標に秘密の数式や計算方法が隠されているわけではなく、すべての戦略指標は公開されています。 Owl Smart Levels を使用すると、取引を開始するためのシグナルをすばやく確認し、注文を出すための
The ChanLun or Chan theory is one of the most popular trading theories in China. But it seems like that it has little influence in western countries. Actually, the Chan Theory is based on a sophisticated mathematical model. The basic idea ChanLun is to simplify the bar chart by its model. With the help of ChanLun, a trader can analyze and predict the trend of future goods, stocks. In ChanLun, there are several basic elements called fractals, strokes, line segments and pivots . A trader should pa
Your Pointer is no ordinary Forex channel. This corridor is built on the basis of the analysis of several candles, starting from the last one, as a result of which the extremes of the studied interval are determined. They are the ones who create the channel lines. Like all channels, it has a middle line as well as a high and low line. This channel is worth watching for its unusual behavior. The use of the Your Pointer indicator allows the trader to react in time to the price going beyond the bo
MercariaPattern1-2-3 відстежує рух ціни, знаходить трьоххвильові структури 1-2-3 та підсвічує момент, коли сценарій підтверджується пробоєм ключового рівня. MercariaPattern1-2-3 tracks price movement, detects three-leg 1-2-3 structures and highlights the moment when the scenario is confirmed by a key level breakout. Індикатор збирає локальні свінги в компактну фігуру 0–1–2–3 , чекає підтвердженого пробою та будує стрілку входу з готовими рівнями SL/TP. The indicator combines local swings into a
Hunter Trend: Arrow Indicator for Binary Options Trading Hunter Trend is an arrow indicator designed for trading binary options (turbo options) on the M1 timeframe, allowing for short-term trading opportunities. How to Trade with this Tool: Signals may appear when a candlestick forms. Once such a signal appears, wait for the closure of that candlestick. Upon the opening of a new candlestick, open a trade for 1-2 candlesticks in the indicated direction. In this case, for 1-2 minutes. A blue dot
The Optimized MACD Divergence indicator is a powerful tool designed to identify potential trading opportunities by detecting divergences between price action and the MACD indicator. It combines classic divergence analysis with candlestick pattern recognition and volume filtering to provide more accurate and reliable signals. How it Works The indicator operates on the following principles: MACD Calculation:   It calculates the MACD indicator using user-defined parameters for fast EMA, slow EMA,
Multi-Level Correlation Analysis of Currencies, Cryptocurrencies, Indices, and Stocks Discover hidden relationships between assets and make data-driven decisions using advanced correlation analysis. "Interaction and Correlation Indicator" is a professional trading tool designed for deep analysis of interdependencies across Forex, cryptocurrencies, indices, and stocks. The indicator calculates the dynamics between fast and slow moving averages (MA) for selected currency pairs, cross rates, and in
STRICTLY FOR BOOM INDEX ONLY!!!!! Here I bring the Maximum Trend Arrows OT1.0 MT5 indicator. This indicator is made up of a combination of different trend indicators for entries and exits, for entries an orange arrow will paint on the chart below the current market and a red flag for closing of trades and it produces buy arrows only. When the orange arrow appears, it will appear along with it's sound to notify you. The 1H timeframe is recommended, don't use it anywhere else than on the 1H timefr
(このテキストは元の英語テキストから自動翻訳によって生成されました。) MetaTrader のチャートには、 Bid (または特定の銘柄の場合は Last )の相場価格に基づいたバー/ローソク足のみが表示されます。しかし、 Ask (売り)相場価格と、それらの間の Spread (スプレッド)も考慮する必要があるため、これで全てが理解できるわけではありません。 初心者トレーダーは皆、取引を始めたばかりの頃にこの罠に陥り、何かがおかしいと感じてしまいます。基本を学んだ後、 Spread (スプレッド)を考慮する必要があること、そして… 「買い」ポジションは Ask 価格でオープンし、 Bid 価格でクローズします。 「売り」ポジションは Bid 価格でオープンし、 Ask 価格でクローズします。 しかし、チャートに表示されるのは通常、過去の Bid または Last の気配値のみであるため、日中に Spread がいつ拡大するかを正確に把握したり、ストップロスやリバーサル注文を出すのに最適な価格レベルを把握したりすることが非常に困難です。 このインジケーターの目的は、過去のティックデ
このインジケータは、AB = CDリトレースメントパターンを検出します。 AB = CDリトレースメントパターンは、初期価格セグメントが部分的にリトレースされ、プルバックの完了から等距離の動きが続く4ポイントの価格構造であり、すべての調和パターンの基本的な基盤です。 [ インストールガイド | 更新ガイド | トラブルシューティング | よくある質問 | すべての製品 ] カスタマイズ可能なパターンサイズ カスタマイズ可能なACおよびBD比率 カスタマイズ可能なブレイクアウト期間 カスタマイズ可能な線、色、サイズ CD fiboレベルに基づいてSLおよびTPレベルを表示します パターンとブレイクアウトの視覚/音声/プッシュ/メールアラート AB = CDリトレースメントは、かなり拡大して再描画できます。物事を簡単にするために、このインディケーターはひねりを実装します。トレードをシグナルする前に、正しい方向へのドンチャンブレイクアウトを待ちます。最終結果は、非常に信頼性の高い取引シグナルを備えた再描画インジケーターです。ドンチャンのブレイクアウト期間が入力として入力されます。 強
Improved version of the free HMA Trend indicator (for MetaTrader 4) with statistical analysis. HMA Trend is a trend indicator based on the Hull Moving Average (HMA) with two periods. HMA with a slow period identifies the trend, while HMA with a fast period determines the short-term movements and signals in the trend direction. The main differences from the free version: Ability to predict the probability of a trend reversal using analysis of history data. Plotting statistical charts for analyzi
ATrend
Zaha Feiz
4.82 (17)
ATrend: その仕組みと使い方 仕組み MT5プラットフォーム向けの「ATREND」インジケーターは、テクニカル分析手法の組み合わせを利用して、トレーダーに堅牢な買いと売りのシグナルを提供するように設計されています。このインジケーターは主に、ボラティリティ測定のために平均真の範囲(ATR)を活用し、潜在的な市場動向を特定するためのトレンド検出アルゴリズムを併用しています。 購入後にメッセージを残すと、特別なボーナスギフトが贈呈されます。 主な特徴: - ダイナミックなトレンド検出: インジケーターは市場トレンドを評価し、シグナルを適宜調整することで、トレーダーが優位な市場環境に合わせて戦略を立てるのを支援します。     - ボラティリティ測定: ATRを使用することで、インジケーターは最適なストップロス(SL)とテイクプロフィット(TP)レベルを決定するために不可欠な市場ボラティリティを測定します。 - シグナルの視覚化: インジケーターは、チャート上に買いと売りのシグナルを視覚的に表示することで、トレーダーの意思決定を強化します。 操作手順 入力とセッティング - TimeF
This indicator helps to visualize the Bollinger Band status of 28 pairs. With the feature of color panel, alert, and notification features, user can catch the potential Bollinger Bounce opportunities from 28 main pairs on one Dashboard quickly. Dashboard Bollinger Band is an intuitive and handy graphic tool to help you to monitor all 28 pairs and provide trading signals based on the Bollinger Bounce Rules (Overbought/Oversold and Bollinger Band Cross). Color legend clrOrange: price is above the
PipFinite Trend PRO MT5
Karlo Wilson Vendiola
4.84 (557)
Breakthrough Solution For Trend Trading And Filtering With All Important Features Built Inside One Tool! Trend PRO's smart algorithm detects the trend, filters out market noise and gives entry signals with exit levels. The new features with enhanced rules for statistical calculation improved the overall performance of this indicator. Important Information Revealed Maximize the potential of Trend Pro, please visit www.mql5.com/en/blogs/post/713938 The Powerful Expert Advisor Version Automatin
Heiken Ashi Smoothed Strategy is a very simple but powerful system to get forex market trend direction. This indicator is actually 2 indicators in 1 pack, Heiken Ashi and Heiken Ashi Smoothed Moving Average both included. Because HA (Heiken Ashi) and HAS (Heiken Ashi Smoothed) are calculated in the same one system event with necessary buffers and loop only, so it is the FAST, OPTIMIZED and EFFICIENT HA having the combined indicator of MetaTrader 5. You can choose to display HA and HAS in the sam
Trend Scanner is a trend indicator that helps to determine the current and forecast market direction using an advanced algorithm. Thanks to flexible alert settings, the indicator will promptly warn you about a trend reversal. The indicator is intuitive and easy to use, and will be an excellent filter in your trending trading strategies. The lines of this indicator are also an excellent dynamic level for stop loss, and is used as one of the types of trailing stop in Trading Panel . To fine-tune t
Promotion $66 lifetime for you. The principle of this indicator is very simple: detecting the trend with Moving Average, then monitoring the return point of graph by using the crossing of Stochastic Oscillator and finally predicting BUY and SELL signal with arrows, alerts and notifications. The parameters are fixed and automatically calculated on each time frame. Example: If you install indicator on EURUSD, timeframe M5: the indicator will detect the main trend with the Moving Average on this ti
STRUCTURAL TREND LINES - MT5 Indicator Simple indicator that automatically draws trend lines based on market structure. Features: - 3 degrees of structure detection (short, medium, long term) - Configurable swing strength for each degree - Single color per degree for clean visualization - Adjustable number of lines per degree - Customizable colors and line widths How it works: The indicator identifies swing highs and lows based on the strength parameter, then connects these points to create t
Indicator for trend trading Doesn't redraw The algorithm uses reliable and proven time indicators It is recommended to use with common manufacturer's filters as resistance support levels Or standard Bollinger Bands or ZigZag indicators It can also be combined with the RSI indicator to determine whether a currency pair or index is overbought or oversold. The indicator is designed to work on small timeframes from m1 to m15
このプロダクトを購入した人は以下も購入しています
このインジケーターを購入すると、プロ仕様のトレードマネージャーを無料で差し上げます。 まず第一に、このトレーディングシステムがノンリペイント、ノンリドロー、ノンラグのインジケーターであることを強調する価値がある。これにより、手動取引とロボット取引の両方に理想的なものになっています。 オンラインコース、マニュアル、プリセットのダウンロード。 「スマートトレンドトレーディングシステム MT5」は、新規および経験豊富なトレーダー向けにカスタマイズされた包括的なトレーディングソリューションです。10以上のプレミアムインジケーターを組み合わせ、7つ以上の堅実なトレーディング戦略を備えており、多様な市場状況に対応する多目的な選択肢となっています。 トレンドフォロー戦略:トレンドを効果的に乗り越えるための正確なエントリーとストップロス管理を提供します。 リバーサル戦略:潜在的なトレンドの反転を特定し、トレーダーがレンジ相場を活用できるようにします。 スキャルピング戦略:高速で正確なデイトレードおよび短期取引のために設計されています。 安定性:すべてのインジケーターはノンリペイント、ノンリドロー、ノ
このインジケーターを購入された方には、以下の特典を 無料 で提供しています: 各トレードを自動で管理し、ストップロスとテイクプロフィットを設定し、戦略ルールに基づいてポジションを決済する補助ツール 「Bomber Utility」 様々な銘柄に合わせたインジケーターの設定ファイル(セットファイル) 「最小リスク」、「バランスリスク」、「待機戦略」 の3つのモードで使用できる Bomber Utility 用の設定ファイル このトレーディング戦略をすぐに導入・設定・開始できる ステップバイステップのビデオマニュアル ご注意: 上記の特典を受け取るには、MQL5のプライベートメッセージシステムを通じて販売者にご連絡ください。 オリジナルのカスタムインジケーター 「Divergence Bomber(ダイバージェンス・ボンバー)」 をご紹介します。これは、MACDのダイバージェンス(乖離)戦略に基づいた 「オールインワン」型のトレーディングシステム です。 このテクニカルインジケーターの主な目的は、価格とMACDインジケーターの間に発生するダイバージェンスを検出 し、将来の価格の動きを示す
まず第一に、この取引インジケーターは再描画されず、再描画されず、遅延しないことを強調する価値があります。これにより、手動取引とロボット取引の両方に理想的なものになります。 ユーザーマニュアル:設定、入力、戦略。 アトミックアナリストは、価格の強さとモメンタムを利用して市場でより良いエッジを見つけるためのPA価格アクションインジケーターです。ノイズや誤ったシグナルを除去し、取引ポテンシャルを高めるための高度なフィルターを備えています。複雑なインジケーターの複数のレイヤーを使用して、アトミックアナリストはチャートをスキャンし、複雑な数学的計算をシンプルなシグナルと色に変換します。これにより、どのような初心者トレーダーでも理解して使用し、一貫した取引の決定を行うことができます。 「アトミックアナリスト」は、新規および経験豊富なトレーダー向けにカスタマイズされた包括的な取引ソリューションです。プレミアムインジケーターとトップノッチの機能を1つの取引戦略に組み合わせ、すべてのタイプのトレーダーにとって汎用性のある選択肢にします。 デイリートレーディングとスキャルピング戦略:高速で正確なデイ
Azimuth Pro
Ottaviano De Cicco
5 (1)
発売プロモーション Azimuth Proは先着100名様限定で 299ドル でご提供します。最終価格は 499ドル となります。 リテールとインスティテューショナルのエントリーの違いはインジケーターではなく、ロケーションにあります。 多くのトレーダーは、モメンタムを追いかけたり、遅行シグナルに反応して、任意の価格レベルでエントリーします。機関投資家は、需給が実際にシフトする構造的なレベルに価格が到達するのを待ちます。 Azimuth Proはこれらのレベルを自動的にマッピングします:スイングアンカーVWAP、マルチタイムフレーム構造ライン、高確率ロケーションにのみ出現するABCパターン。 Azimuth Proは、構造分析とインテリジェントな自動化の両方を求めるプロフェッショナルトレーダー向けに構築されています。 Azimuthが外科的精度で市場構造をマッピングする一方、Azimuth Proはインテリジェンスレイヤーを追加します:トレーディングスタイルの自動検出、スマート設定された移動平均線、20年のデータでバックテストされた最適化パラメータ。その結果、お使いの銘柄と
Gold Sniper Scalper Proは、MetaTrader 5向けのプロフェッショナルなindicatorで、トレーダーがエントリーポイントを特定し、リスクを効果的に管理するために設計されています。 このindicatorは、シグナル検出システム、Entry/SL/TPの自動管理、ボリューム分析、リアルタイムパフォーマンス統計を含む包括的な分析ツールセットを提供します。 システムを理解するためのユーザーガイド   |   他の言語のユーザーガイド 主な機能 シグナル検出システム このindicatorは、price actionと市場構造の分析に基づいて潜在的なエントリーポイントを自動検出します。トレード機会を検出すると: - BUY(青)またはSELL(赤)の矢印がchart上に表示されます - ローソク足が色付けされ、シグナルゾーンが識別されます - Entry/SL/TPレベルが自動計算されます シグナルは価格がEntryレベルに触れた時のみ発動し、市場に確認されていないシグナルをフィルタリングします。 インテリジェントなEntry/SL/TP管理 - Ent
Berma Bands
Muhammad Elbermawi
5 (7)
Berma Bands (BBs) インジケーターは、市場のトレンドを特定して活用したいトレーダーにとって貴重なツールです。価格と BBs の関係を分析することで、トレーダーは市場がトレンド段階にあるか、レンジ段階にあるかを判断できます。 詳細については、[ Berma Home Blog ] をご覧ください。 バーマ バンドは、上部バーマ バンド、中部バーマ バンド、下部バーマ バンドの 3 つの異なる線で構成されています。これらの線は価格の周りにプロットされ、全体的な傾向に対する価格の動きを視覚的に表します。これらのバンド間の距離から、ボラティリティや潜在的な傾向の反転についての洞察を得ることができます。 バーマ バンドの線がそれぞれ離れると、市場が横ばいまたはレンジ相場の期間に入っていることを示すことがよくあります。これは、明確な方向性の偏りがないことを示しています。トレーダーは、これらの期間中にトレンドを特定するのが難しいと感じる可能性があり、より明確なトレンドが出現するまで待つ場合があります。 バーマ バンドの線が 1 本の線に収束すると、強いトレンド環境の兆候となること
Quantum TrendPulse を ご紹介します。これは、   SuperTrend   、   RSI   、および Stochastic のパワーを 1 つの包括的なインジケーターに組み合わせて、取引の可能性を最大限に引き出す究極の取引ツールです。精度と効率を求めるトレーダー向けに設計されたこのインジケーターは、市場のトレンド、勢いの変化、最適なエントリー ポイントとエグジット ポイントを自信を持って特定するのに役立ちます。 主な特徴: SuperTrend 統合: 現在の市場動向に簡単に追従し、収益性の波に乗ることができます。 RSI精度: 買われすぎと売られすぎのレベルを検出し、市場の反転のタイミングに最適で、SuperTrendのフィルターとして使用されます。 確率的精度: 確率的振動を活用して、変動の激しい市場で隠れたチャンスを見つけます。SuperTrend のフィルターとして使用されます。 マルチタイムフレーム分析:   M5 から H1 または H4 まで、さまざまなタイムフレームで市場を常に把握します。 カスタマイズ可能なアラート: カスタム取引条件が満たされ
優れたテクニカルインジケーター「Grabber」をご紹介します。これは、すぐに使える「オールインワン」トレーディング戦略として機能します。 ひとつのコードに、市場のテクニカル分析ツール、取引シグナル(矢印)、アラート機能、プッシュ通知が強力に統合されています。 このインジケーターを購入された方には、以下の特典を無料で提供します: Grabberユーティリティ:オープンポジションを自動で管理するツール ステップバイステップのビデオマニュアル:インジケーターのインストール、設定、取引方法を解説 カスタムセットファイル:インジケーターをすばやく自動設定し、最大限の成果を出すための設定ファイル 他の戦略はもう忘れてください!Grabberだけが、あなたを新たなトレードの高みへと導いてくれるのです。 Grabber戦略の主な特徴: 推奨タイムフレーム:M5〜H4 対応通貨ペア・資産:どれでも使用可能ですが、私が実際に検証した以下を推奨します(GBPUSD、GBPCAD、GBPCHF、AUDCAD、AUDUSD、AUDSGD、AUDCHF、NZDUSD、NZDCAD、EURCAD、EURUSD、E
サポート線と抵抗線のプロットにうんざりしていませんか? サポートレジスタンス は、非常に興味深いひねりを加えてチャート内のサポートとレジスタンスラインを自動検出およびプロットするマルチタイムフレームインジケーターです。価格レベルは時間とともにテストされ、その重要性が高まるにつれて、ラインは太くなり、暗くなります。 [ インストールガイド | 更新ガイド | トラブルシューティング | よくある質問 | すべての製品 ] 一晩でテクニカル分析を強化 チャートを閲覧せずに重要な価格レベルを検出 一目ですべての価格レベルの相対的な強さを認識する すべての取引で最大30時間のプロットラインを節約 インジケーターは、すべての価格レベルの年齢を表示します インジケーターは再描画されていません 過去および現在の価格レベルは近接によって崩壊し、現在の市場行動に合わせて調整されます。動作は、必ずしもピークではない場所に線が引かれます。 価格レベルは、時間とともに拒否されるにつれて、より暗く、より広くなります ノイズを避けるために、重要でない価格レベルは定期的にクリアされます カスタマイズ可能な時間枠の
ARIPoint
Temirlan Kdyrkhan
1 (1)
ARIPoint is a powerful trading companion designed to generate high-probability entry signals with dynamic TP/SL/DP levels based on volatility. Built-in performance tracking shows win/loss stats, PP1/PP2 hits, and success rates all updated live. Key Features: Buy/Sell signals with adaptive volatility bands Real-time TP/SL/DP levels based on ATR Built-in MA Filter with optional ATR/StdDev volatility Performance stats panel (Success, Profit/Loss, PP1/PP2) Alerts via popup, sound, push, or email Cu
これまでに、 素晴らしいバックテスト結果、 驚くべき数値を持つ ライブ口座のパフォーマンス証明 、そして あらゆる場所での統計情報 がある取引インジケーターを購入し、しかし使用後に 口座を破綻させてしまった ことは何度ありますか? シグナル単独を信用すべきではありません。そもそもなぜそれが表示されたのかを知る必要があります。そして、それこそがRelicusRoad Proの得意とすることです! ユーザーマニュアル + 戦略 + トレーニングビデオ + VIPアクセス付きプライベートグループ + モバイル版利用可能 市場の見方を変える新しい方法 RelicusRoadは、FX、先物、仮想通貨、株式、指数に対応する、 世界で最も強力で最高の取引インジケーター であり、トレーダーが口座を 成長させる ために必要なすべての情報とツールを提供します。 初心者 から 上級者 まで、 すべてのトレーダー が成功できるよう、 テクニカル分析 と 取引計画 を提供します。 これは、将来の市場を 予測する のに十分な情報を提供する 主要な取引インジケーター です。私たちは、チャート上で意味をなさない複
Gartley Hunter Multi - An indicator for searching for harmonic patterns simultaneously on dozens of trading instruments and on all possible timeframes. Manual (Be sure to read before purchasing) | Version for MT4 Advantages 1. Patterns: Gartley, Butterfly, Shark, Crab. Bat, Alternate Bat, Deep Crab, Cypher 2. Simultaneous search for patterns on dozens of trading instruments and on all possible timeframes 3. Search for patterns of all possible sizes. From the smallest to the largest 4. All fou
Weis Wave with Alert MT5
Trade The Volume Waves Single Member P.C.
4.94 (17)
Rental/Lifetime Package Options and Privileges  Rent Monthly Six Months   Yearly/Lifetime Weis Wave with Speed with Alert+Speed Index x x x Manual  x x x Quick Set up Video x x x Blog x x x Lifetime Updates x x x Setup and Training Material x x Discord Access Channel "The SI traders"          x Rectangle Break Alert Tool      x How to trade with it:    http://www.tradethevolumewaves.com   ** If you purchase please contact me to setup your  : Training Room and  complete manual access.  Wei
WARNING: This indicator is distributed EXCLUSIVELY on MQL5.com MT4 version:   https://www.mql5.com/it/market/product/160363 MT5 version:   https://www.mql5.com/it/market/product/160410 ============================================================================================= MAX RIBBON ver 1.00 The indicator that shows you the TREND clearly and unambiguously! ============================================================================================= DESCRIPTION MAX RIBBON is an advanced tre
次世代の自動化された需要と供給のゾーン。どのチャートでも機能する新しい革新的なアルゴリズム。すべてのゾーンは、市場の価格行動に従って動的に作成されています。 2種類のアラート --> 1) 価格がゾーンに達したとき 2) 新しいゾーンが形成されたとき もう 1 つの役に立たない指標はありません。実績のある完全な取引戦略を手に入れることができます。     新機能:     価格が需給ゾーンに達したときにアラートを出す     新しい需給ゾーンが作成されたときにアラートを発します     プッシュ通知アラート     ピップ単位のゾーン幅ラベル     MTF のもう 1 つのタイムフレーム。したがって、現在より 2 時間足高いのではなく、現在より 3 時間足し上に見えるようになります。     アラート/ゾーン/MTF 機能を有効/無効にするボタン あなたが得る利点:     取引から感情を取り除きます。     取引エントリをオブジェクト化します。     確率の高いセットアップで利益を上げましょう。     描画ゾーンから時間を節約します。
ACB Breakout Arrows MT5
KEENBASE SOFTWARE SOLUTIONS
5 (1)
ACB Breakout Arrows インジケーターは、特別なブレイクアウトパターンを検出することで、市場における重要なエントリーシグナルを提供します。このインジケーターはチャートを常に監視し、一方向に勢いが定着してきた段階で、主要な値動きの直前に精度の高いエントリーシグナルを表示します。 マルチシンボル・マルチタイムフレームスキャナーはこちらから - ACB Breakout Arrows MT5 用スキャナー 主な機能 ストップロスとテイクプロフィットの水準が自動で表示されます。 すべての時間足のブレイクアウトシグナルを監視できるMTFスキャナーダッシュボードを搭載。 デイトレーダー、スイングトレーダー、スキャルパーに最適。 シグナル精度を高めるための最適化されたアルゴリズム。 損益分岐点やスキャルピングターゲットに使える特別なライン(クイックプロフィットライン)。 勝率、平均利益などのパフォーマンス分析メトリクスを表示。 リペイントなし。 トレードの確認 - 低確率のトレードを除外するために ACB Trade Filter インジケーター を使用してください。 強い買い:
The Trend Forecaster indicator utilizes a unique proprietary algorithm to determine entry points for a breakout trading strategy. The indicator identifies price clusters, analyzes price movement near levels, and provides a signal when the price breaks through a level. The Trend Forecaster indicator is suitable for all financial assets, including currencies (Forex), metals, stocks, indices, and cryptocurrencies. You can also adjust the indicator to work on any time frames, although it is recommen
TREND FLOW PRO TREND FLOW PRO は、市場の方向を表示するリペイントなしのインジケーターです。トレンドの反転だけでなく、大口市場参加者の初回および再エントリーを特定します。チャート上の BOS マークは、実際のトレンド転換と上位タイムフレームの重要なレベルを示します。データはリペイントされず、各バーの確定後もチャート上に残ります。 戦略例を含む詳細な PDF ガイド は、プライベートメッセージでリクエストして受け取ることができます。 インジケーターの主な要素: BOS FLOW ― トレンド波動と実際のトレンド転換。これは大口参加者のエントリーと、その存在の確認を示します(数字で表示)。 BOS FILL ― トレンド方向にローソク足を着色します。大口プレイヤーのエントリーポイントや、トレンドが変化するポイントを示します。 シグナルレベル: BOS ― 強さが未確定な参加者のエントリー(多くの場合、メイントレンド内の調整)。 Move SL ― 大口参加者がポジションをどのように移動させているかを視覚的に表示します。トレーダーはストップロス調整の参考として使用
SynaptixQuant Dominance Matrix: Institutional-Grade Market State Extraction Engineered for traders who require a data-driven view of market behaviour beyond surface-level indicators. The Synaptix Quant (SQ) Dominance Matrix is not a conventional currency strength display. Behind its intentionally streamlined interface runs a sophisticated analytical architecture designed to quantify market conditions with precision. Every output is generated through layered signal processing built to identify d
Elliott Wave Trend was designed for the scientific wave counting. This tool focuses to get rid of the vagueness of the classic Elliott Wave Counting using the guideline from the template and pattern approach. In doing so, firstly Elliott Wave Trend offers the template for your wave counting. Secondly, it offers Wave Structural Score to assist to identify accurate wave formation. It offers both impulse wave Structural Score and corrective wave Structure Score. Structural Score is the rating to sh
これはほぼ間違いなく、MetaTraderプラットフォームで見つけることができる最も完全な調和価格形成自動認識インジケーターです。 19種類のパターンを検出し、フィボナッチプロジェクションをあなたと同じように真剣に受け止め、潜在的逆転ゾーン(PRZ)を表示し、適切なストップロスとテイクプロフィットレベルを見つけます。 [ インストールガイド | 更新ガイド | トラブルシューティング | よくある質問 | すべての製品 ] 19の異なる調和価格形成を検出します プライマリ、派生および補完フィボナッチ投影(PRZ)をプロットします 過去の価格行動を評価し、過去のすべてのパターンを表示します この指標は、独自の品質とパフォーマンスを分析します 適切なストップロスとテイクプロフィットのレベルを表示します ブレイクアウトを使用して適切な取引を通知します すべてのパターン比をグラフにプロットします 電子メール/音声/視覚アラートを実装します スコット・M・カーニーの本に着想を得て、この指標は最も純粋で急を要するトレーダーのニーズを満たすように設計されています。ただし、トレードを容易にする
現在33%オフ 初心者にもエキスパートトレーダーにも最適なソリューション このインジケーターは独自の機能と新しい公式を多数内蔵しており、ユニークで高品質かつ手頃な取引ツールです。このアップデートでは、2つの時間枠ゾーンを表示できるようになります。より長いTFだけでなく、チャートTFとより長いTF(ネストゾーンを表示)の両方を表示できます。すべてのSupply Demandトレーダーの皆さんのお気に召すはずです。:) 重要情報の公開 Advanced Supply Demandの可能性を最大化するには、 https://www.mql5.com/ja/blogs/post/720245 にアクセスしてください。   エントリーまたはターゲットの正確なトリガーポイントを正確に特定できれば取引がどのように改善されるか想像してみてください。新しい基盤となるアルゴリズムに基づいて構築されているため、買い手と売り手の間の潜在的な不均衡をさらに簡単に特定できます。これは、最も強い需要と供給のゾーンと、過去のパフォーマンス(古いゾーンを表示)がグラフィカルに表現されるためです。これらの機能は、最適な
スイングトレーディング は、トレンドの方向のスイングと可能な反転スイングを検出するように設計された最初のインジケーターです。トレーディングの文献で広く説明されているベースラインスイングトレーディングアプローチを使用します。インディケータは、いくつかの価格と時間のベクトルを調査して、全体的なトレンドの方向を追跡し、市場が売られ過ぎまたは買われ過ぎて修正の準備ができている状況を検出します。 [ インストールガイド | 更新ガイド | トラブルシューティング | よくある質問 | すべての製品 ] むち打ちを起こさずに市場スイングの利益 インジケーターは常にトレンドの方向を表示します 色付きの価格帯は機会のベースラインを表します 色付きのダッシュは、可能な反転スイングを表します この指標は、独自の品質とパフォーマンスを分析します 複数時間枠のダッシュボードを実装します カスタマイズ可能なトレンドおよびスイング期間 電子メール/サウンド/プッシュアラートを実装します インジケータは再描画またはバックペインティングではありません Swing Tradingとは Swing Tradingは
まず第一に、この取引ツールはノンリペイント、ノンリドロー、ノンラグの指標であり、プロの取引に理想的ですことを強調する価値があります。 オンラインコース、ユーザーマニュアル、デモ。 スマートプライスアクションコンセプトインジケーターは、新米から経験豊富なトレーダーまで、非常 に強力なツールです。Inner Circle Trader AnalysisやSmart Money Concepts Trading Strategiesなど、20以上の有用な指標を1つに組み合わせています。このインジケーターはスマートマネーコンセプトに焦点を当て、大手機関の取引方法を提供し、彼らの動きを予測するのに役立ちます。 特に、流動性分析に優れており、機関がどのように取引しているかを理解しやすくしています。市場のトレンドを予測し、価格の動きを慎重に分析するのに優れています。機関の戦略とトレードを合わせることで、市場の動向についてより正確な予測ができます。このインジケーターは多目的であり、市場構造を分析し、重要な注文ブロックを特定し、さまざまなパターンを認識するのに優れています。 このインジケーター
発見が困難で頻度が少ないため、分岐は最も信頼できる取引シナリオの1つです。このインジケーターは、お気に入りのオシレーターを使用して、通常の隠れた分岐点を自動的に見つけてスキャンします。 [ インストールガイド | 更新ガイド | トラブルシューティング | よくある質問 | すべての製品 ] 取引が簡単 通常の隠れた発散を見つけます 多くのよく知られている発振器をサポート ブレイクアウトに基づいて取引シグナルを実装します 適切なストップロスおよび利益レベルを表示します 設定可能なオシレーターパラメーター カスタマイズ可能な色とサイズ バー単位でサイズ別に分岐をフィルタリング パフォーマンス統計を実装します 電子メール/音声/視覚アラートを実装します 幅広い市場の見通しを提供するために、異なるオシレーターを使用して、干渉なしで同じチャートにインジケーターを何度もロードできます。このインジケーターは、次のオシレーターをサポートしています。 RSI CCI MACD オスマ 確率的 勢い 素晴らしい発振器 加速器発振器 ウィリアムズパーセントレンジ 相対活力指数 特に外国為替市場では、
Was: $299  Now: $99  Supply Demand uses previous price action to identify potential imbalances between buyers and sellers. The key is to identify the better odds zones, not just the untouched ones. Blahtech Supply Demand indicator delivers functionality previously unavailable on any trading platform. This 4-in-1 indicator not only highlights the higher probability zones using a multi-criteria strength engine, but also combines it with multi-timeframe trend analysis, previously confirmed swings a
Bill Williams Advanced is designed for automatic chart analysis using Bill Williams' "Profitunity" system. The indicator analyzes four timeframes at once. Manual (Be sure to read before purchasing) Advantages 1. Analyzes the chart using Bill Williams' "Profitunity" system. Signals are displayed in a table in the corner of the screen and on the price chart. 2. Finds all known AO and AC signals, as well as zone signals. Equipped with a trend filter based on the Alligator. 3. Finds "Divergence Bar
これはMT5のインジケーターで、再描画なしで取引に参入するための正確なシグナルを提供します。 外国為替、暗号通貨、金属、株式、インデックスなど、あらゆる金融資産に適用できます。かなり正確な見積もりを提供し、取引を開始して終了するのに最適な時期を教えてくれます。1つのシグナルを処理しただけでインジケーターの元が取れた例の 動画 (6:22)をご覧ください。Entry PointsPro インジケーターの助けを借りたほとんどのトレーダーの最初の1週間の結果が改善しています。 Telegramグループ に登録してください。Entry Points Proインジケーターのメリットは次の通りです。 再描画のないエントリーシグナル 再描画されるインジケーターでは一度表示されたシグナルが削除されて大きな金銭的損失につながることがありますが、これと異なり、表示されて確認されたシグナルは消えることがありません。 エラーなしの取引開始 インジケーターアルゴリズムによって取引を開始する(資産を売買する)理想的な瞬間を見つけることができます。それを使用するすべてのトレーダーの成功率が向上します。 あら
Market Structure Patterns
Samuel Manoel De Souza
4.47 (19)
Available for   MT4   and   MT5 . Join the Market Structure Patterns channel to download materials available for study and/or additional informations. Related posts: Market Structure Patterns - Introdução Get it now with 50% off | Previously priced at $90 | Offer valid until December 31 | A major upgrade is coming soon, and the original price will be adjusted. Market Structure Patterns   is an indicator based on   smart money concepts   that displays   SMC/ICT   elements that can take your tra
FOOTPRINTORDERFLOW: The Authoritative Guide ( This indicator is also compatible with economic providers that do not offer DOM data and BID/ASK data, It also supports various foreign exchange transactions ) 1. Overview FOOTPRINTORDERFLOW  is an advanced Order Flow analysis tool designed for MetaTrader 5 (MT5). Unlike traditional candlestick charts that only show OHLC (Open, High, Low, Close), this indicator parses real-time Tick data to visualize the microstructure inside every candle. It helps y
作者のその他のプロダクト
The original BoomTroom trend indicator. With this indicator, you do not need to sit near the computer and wait for the inflection point to appear day and night. How important it is to determine the trend in the stock market or the Forex market! Still not sure how to determine the inflection point of a trend? Are you still worried about how to draw short-term and long-term trend lines? Run this smart utility. You will see pivot points of varying strength, as well as long-term and short-term tre
The Forex market can go through many different price paths to reach a point in the future. The future is dynamic. Therefore, planning a trade with a possible future scenario is an essential step for your success. For these purposes, we present to your attention Trend Units. A unique author's strategy that simultaneously determines the strength of trends and points of entry into the market, visualizing it using arrows on the chart. The indicator is optimally adapted for trading on time periods
Trend Sys, an indicator designed to detect trends in price movement and allows you to quickly determine the direction of the trend. The best way to trade Trend Sys is to enter the market when Trend Sys peaks and goes the other way. This is a sign of a trend reversal. I hope you enjoy this indicator and leave your comments to make it even better. Good luck and happy trading.
Using the Trend Moment indicator, you can find not only overbought and oversold zones, but also be able to identify the strongest reversals of the current trend. This will take your trading to a whole new level. Forget about slipping in oscillators, be it Stochastic or RSI or any other oscillator. Trend Moment signals 100% do not redraw and do not require adjusting the parameters - the indicator will work equally well on any chart, even with default parameters.
Trend Sens is a universal indicator, the values of which are calculated based on different indicators. The iPump indicator is a versatile indicator that combines the advantages of three categories of indicators. You get 3 indicators in 1 product. Trend Sense itself appeared in the process of many years of work with financial assets. The indicator has become a consequence of those desires and requirements, for the analysis that I personally would like to use for trading.
With the development of information technologies and a large number of participants, financial markets are less and less amenable to analysis by outdated indicators. Conventional technical analysis tools, such as the Moving Average or Stochastic, in their pure form are not able to determine the direction of the trend or its reversal. Can one indicator indicate the correct direction of the future price, without changing its parameters, in the history of 14 years? At the same time, not to lose ad
The Trend Map indicator is designed to detect trends in price movement and allows you to quickly determine not only the direction of the trend, but also to understand the levels of interaction between buyers and sellers. It has no settings and therefore can be perceived as it signals. It contains only three lines, each of which is designed to unambiguously perceive the present moment. Line # 2 characterizes the global direction of the price movement. If we see that the other two lines are above
Trend LineA is a powerful trend indicator equipped with everything you need to trade and at the same time very easy to use. The indicator calculates the most probable zones of trend stop / reversal, zones of confident trend movements. The indicator works on all timeframes and currency pairs. The indicator gives quite accurate signals and it is customary to use it both in trend and flat markets. It is advisable to use the indicator in combination with other instruments for more reliable signals
Original Trrend Arrow trend indicator showing buy and sell areas. With this indicator, you do not need to sit near the computer and wait for the inflection point to appear day and night. The indicator is very easy to use. When an up arrow appears, open a buy deal. When a down arrow appears, open a sell trade. The indicator works on all timeframes and currency pairs. It is advisable to use the indicator in combination with other instruments for more reliable signals and making a more balanced
One of the biggest challenges traders face is finding the trading system that's right for them. Trend Op indicator predicts the most likely short-term price movement based on complex mathematical calculations. This indicator is designed to detect trends in price movement and allows you to quickly determine not only the direction of the trend, but also to understand the levels of interaction between buyers and sellers. It has no settings and therefore can be perceived as it signals.
The Trend Hist indicator is designed to display on a chart and visually evaluate the trailing algorithm by inside bars. This indicator finds strong trend movements of a currency pair on a given number of bars, and also finds a correction to this trend. If the trend is strong enough, and the correction becomes equal to the one specified in the parameters, then the indicator signals this.
The Trend Slow indicator uses the author's algorithm for analyzing price behavior and displays the result of complex work in the form of lines. For simplicity, the algorithm automatically changes the line color according to its direction. The indicator has a parameter to enable alerts when the color changes, thus helping the trader to identify new market trends. This system will help you find high-probability trades in the direction of strong trends.
The Effect indicator shows the points of potential market reversal. Simple, visual and efficient trend detection. Ready-made trading system. The intelligent algorithm of the indicator determines the trend with good probability. Uses just one parameter for settings. The indicator does not redraw and does not lag. Works on all currency pairs and all timeframes. You should remember that using a combination of forecasting tools, it is advisable to choose 2-3 indicators for trading. Otherwise, thei
American traders say: “Trend is your friend”, which means “Trend is your friend”. And indeed it is! By trading with the trend, you reduce your risks and gain an advantage, as you increase the mathematical expectation of completed trades and, therefore, earn more profit. Together with the Going straight indicator you will trade with the trend with ease! This is one of the most effective ways to deal with market trends. Trading strategies using the channel indicator belong to the classic methods
Schrodinger Channel is a non-redrawing channel indicator based on moving averages, it takes into account not simple moving averages, but twice smoothed ones, which, on the one hand, makes it possible to more clearly determine the market movement, and on the other hand, makes the indicator less sensitive. Signals are not redrawn and can be used immediately after they appear. This means that there is no need to wait for a new confirming bar. The lower and upper bands are used as support / resista
The Direction Arrows indicator tracks the market trend while ignoring the sharp market fluctuations and noise around the average price. The indicator implements a kind of technical analysis based on the idea that the market is cyclical in nature. It catches the trend and shows favorable moments of entering the market with arrows. The indicator can be used both for pipsing on small periods and for long-term trading.
The Incognito RSI indicator is an advanced internal strength index. It transforms the signal so that the low-frequency components lag behind much more than the high-frequency components. In general, the data of the last bar has more weight than the previous data, like an exponential moving average. The indicator demonstrates not the relative strength of the compared trading instruments, but the internal strength of a single instrument, therefore it is the “Internal Strength Index”. This is an
The Oscillator Trend indicators are most useful in identifying trend decay. Nobody canceled the divergence. Correct use of this signal will give you a certain head start in the market. When working in flat. The principle of operation of the oscillator is based on the measurement of fluctuations. The indicator tries to determine the maximum or minimum of the next swing - an exit from the overbought and oversold zones. Do not forget that these signals are most interesting at the borders of the fl
Purpose Trend - analyzes the current trend gives an excellent understanding of which direction the market is aimed at, at what point it should be expected in the near future. Unfortunately, most of the popular indicators in practice give a huge number of false signals, since they all work without any consideration of global trends. That is why in today's conditions, when the market is far from stable price movement, it is almost impossible to build a strategy without using trend indicators. Ho
BitTerraCoin is a unique trading system! It goes through the entire history and all currency pairs with one single setting. Works using sharp tick movements. Recommendations for working with a scalpel: It is recommended to work on liquid Forex pairs with a low spread. The lower the commission and the spread, the greater the profit. You can start using it with $ 100 and 0.01 lot. You can work on any hourly period, on any currency pair and on the server of any broker. Details: The MaxSpread par
The Make Use trend indicator copes with the main task of trading: to find an entry point to the market at the moment of trend initiation and an exit point at the moment of its completion. A stable movement of quotations in a certain direction is called a trend in trading. In this case, the movement itself can be downward, upward or sideways, when the market movement does not have a pronounced direction. The Make Use trend indicator is important for identifying trends in financial markets. Howev
Trend Thyrogen is a trend trading strategy, filtering and all the necessary features built into one tool! Intelligent indicator algorithm with generates input signals and output levels. The principle of operation of the indicator is to automatically determine the current state of the market when placed on a chart, analyze historical data based on historical data and display instructions for further actions on the trader's screen. The system itself shows in the form of arrows when to buy and wh
The Channel Token indicator automatically builds a trend movement tracking channel. The price is in its trend movement in a certain range, and not a chaotic spread of the price, it is not clear in which direction. And if the price deviates within a certain range, it means that the boundaries of these ranges are support and resistance lines and form the Channel Token channel. Channel Token - an indicator in which the indicator period is automatically calculated based on the number of bars of t
The bot uses 4 MACD indicators and two MAs in its work, thus a zone is formed for trading on the breakdown of the Bands channel and, accordingly, with a minimum stop level and only one deal. The bot also takes into account parameters such as slippage, spread and volatility. Entry is made only when there is sufficient volatility. Thus, the bot works using sharp tick movements. It is recommended to work on liquid Forex pairs with a low spread. The lower the commission and the spread, the greater
The Trend Long indicator accompanies long trends. It can be used only to determine the global trend, but not as an entry point. Any reliable entry indicator can be used for the entry point. Or the standard RSI, based on overbought / oversold levels. The indicator can be used without restrictions on instruments or timeframes. Experiment with the parameters! The parameters are not linear! When you specify a period, you only specify a period to determine the price range for a certain interval. Th
This is no ordinary channel. Everyone should analyze it and find a way to use it in their trading strategies. Like all channels, it has a middle line as well as a high and low line. This channel is worth watching for its unusual behavior. The use of the Channel Reliable indicator allows the trader to react in time to the price going beyond the boundaries of the channel set for it. This corridor is built on the basis of the analysis of several candles, and changes in the parameter of the number
The principle of operation of the Patern Trend indicator is to work on a channel breakout. The parameters and width of the channel are selected in such a way that the closing in the red is sufficiently balanced, which is shown on the chart by the inscriptions near the arrows. You can see that the arrow signal does not appear every time the channel is broken. Because the indicator has a volatility filter that has a big impact on the entry. In total on the chart (EURUSD / H1) you can see that th
Signal Switched is a channel indicator designed to work with support and resistance levels and help traders find opportunities to enter the market. It is also protected by arrows that help to enter the market correctly. Channel indicators are among the most popular technical analysis tools on Forex and Signal Switched is a promising market analysis tool. Signal Switched can be used as a base for building a strategy or as an addition to an existing one. Signal Switched is a limited range (corr
Quatre is a trend indicator, it indicates well the points of the beginning of the trend and its completion or reversal. This indicator is characterized by the following behavior: After a trend movement appears on the market, the indicator sends a signal of its beginning in the form of arrows. Quatre is a mathematical averaging of prices, and based on this, one can assume the direction of price movement (trend) in the future. Against the background of insignificant fluctuations, it is possible t
This tool scans the market looking for the correct entry. You can see and evaluate it yourself, perhaps it will suit you for a number of tasks related to forecasting price movements. It uses only price data and analytics to calculate entry points. Does not use auxiliary indicators. It has two parameters for customization. Setting the indicator. Interval - price analysis interval. Subterfuge - analysis correction interval.
フィルタ:
レビューなし
レビューに返信