DsPMO
- インディケータ
- バージョン: 1.0
- アクティベーション: 5

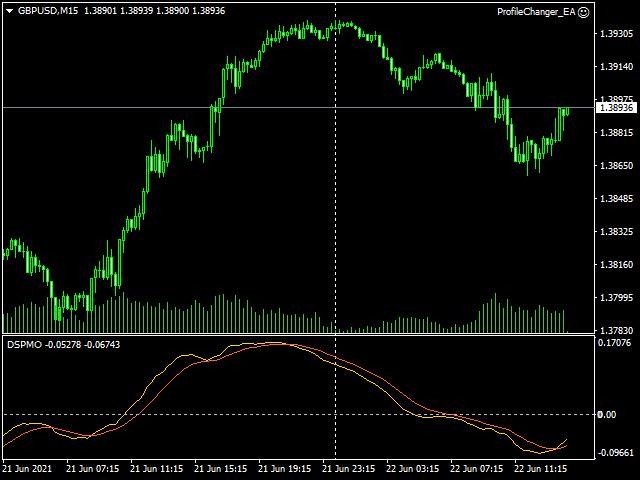
Double Smoothed Price Momentum Oscillator
The Momentum Oscillator measures the amount that a security’s price has changed over a given period of time. The Momentum Oscillator is the current price divided by the price of a previous period, and the quotient is multiplied by 100. The result is an indicator that oscillates around 100. Values less than 100 indicate negative momentum, or decreasing price, and vice versa.
Double Smoothed Price Momentum Oscillator examines the price changes in the determined period, smoothed twice and shows the result with a signal.