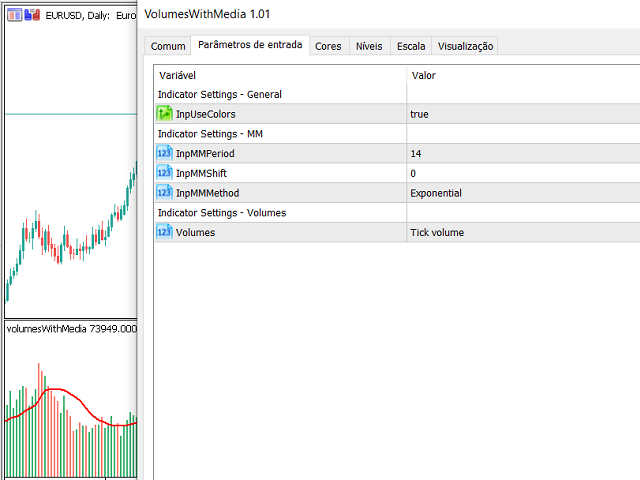
VolumesWithMedia
- インディケータ
-
Jonathan Pereira
 Como Desenvolvedor de Sistemas dedicado e apaixonado, adoro me aventurar no mundo da programação, tanto profissionalmente quanto em meu tempo livre. Dominando Java, Python e MQL5, minha experiência se estende a outras áreas, como SQL, bancos de dados relacionais e não relacionais, PySpark, Hadoop
 - バージョン: 1.1
- アップデート済み: 11 7月 2021
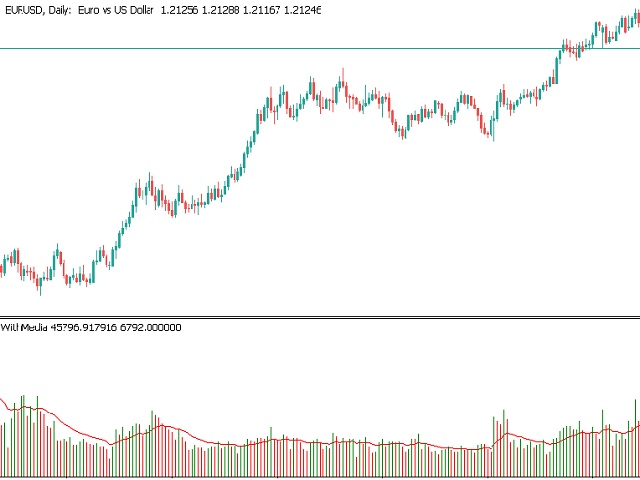
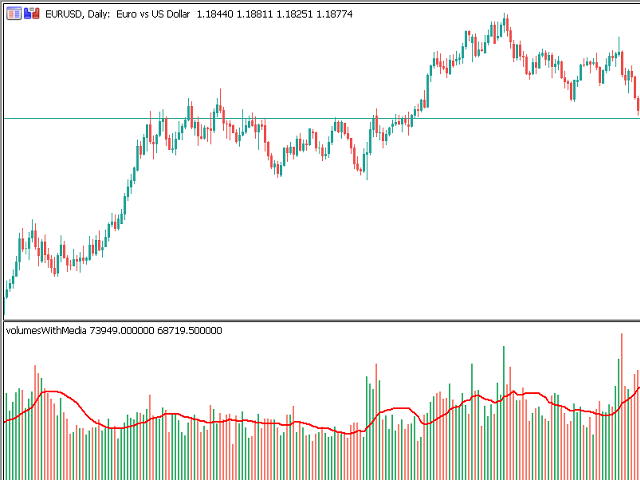


The indicator you created is too perfect. Thank you so much. But I have one small favor to ask. I would like to see 100 or 200 trading volumes to reduce the resources of my computer. Or I would like to be able to set the volume for as many candles as I want. Thank you very much.