Real NonRePaint MultiTimeFrame RSI
- インディケータ
- バージョン: 1.1
- アップデート済み: 1 10月 2021
- アクティベーション: 9

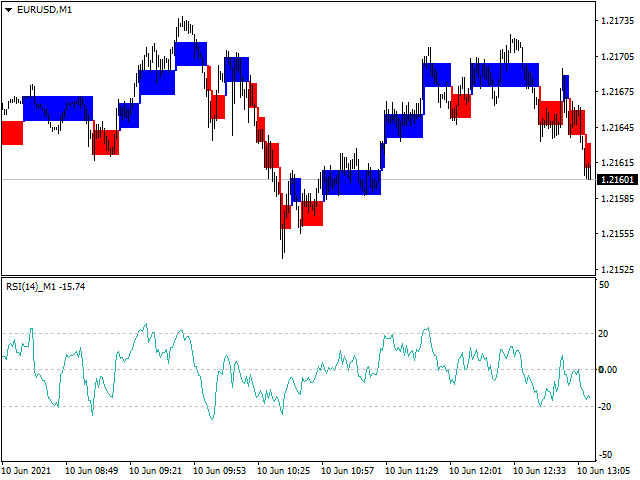
Indicator from the Real Non RePaint MultiTimeFrame (Real NRP MTF) series.
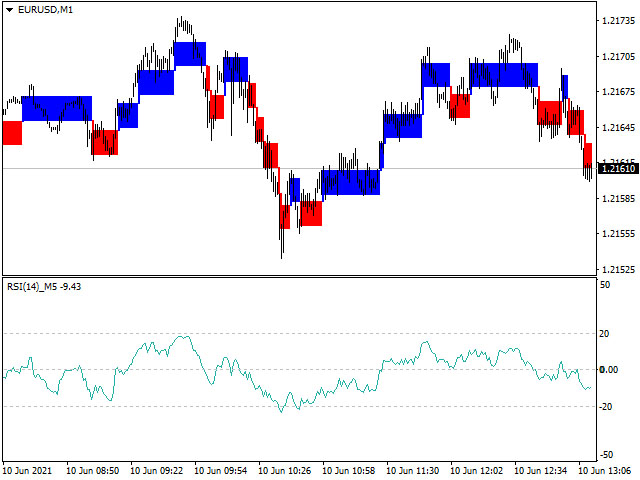
Specially designed to display the RSI standard indicator reading from the Senior TimeFrame (TF) to the Junior.
The indicator differs from the standard scale - symmetrical relative to 0. Add 50.0 to the readings to get the standard values.
Does not look into the future for history at the senior TF.
DOES NOT DIFFER from the standard real-time indicator readings (including bias), but shows the actual indicator readings on the history for the older TF.
It can display the readings of the current TF.
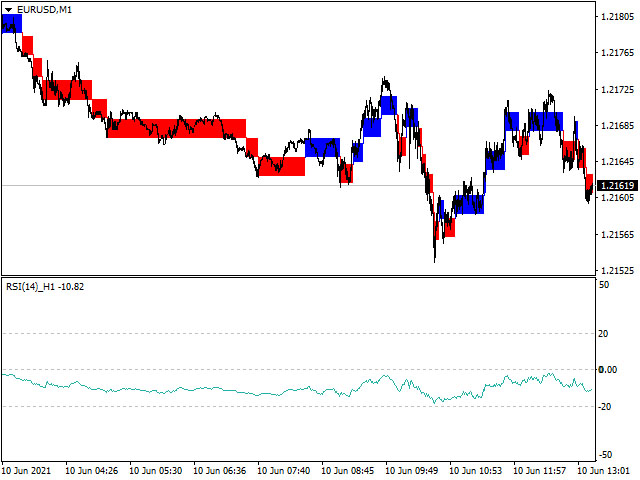
Starting with the current Timeframe Parametr does not make sense - you can use the standard indicator.
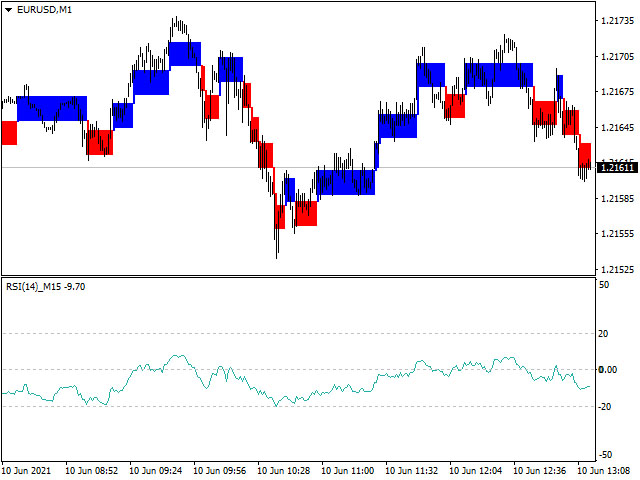
Parameters: RSI TimeFrame - the worker timeframe (has to be more or equal current)
RSI Period - the indicator period.
Critical is the state and correspondence of the history of the current and senior TF. Check completeness before use.