Security

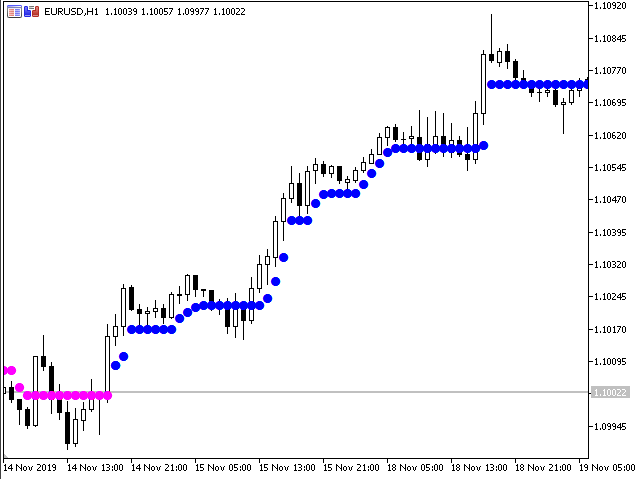
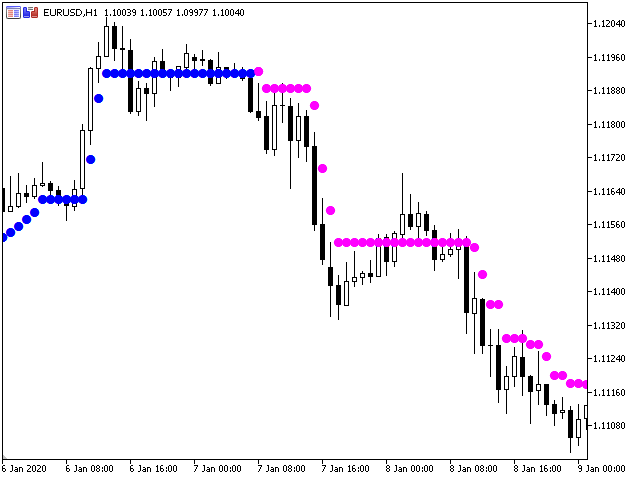
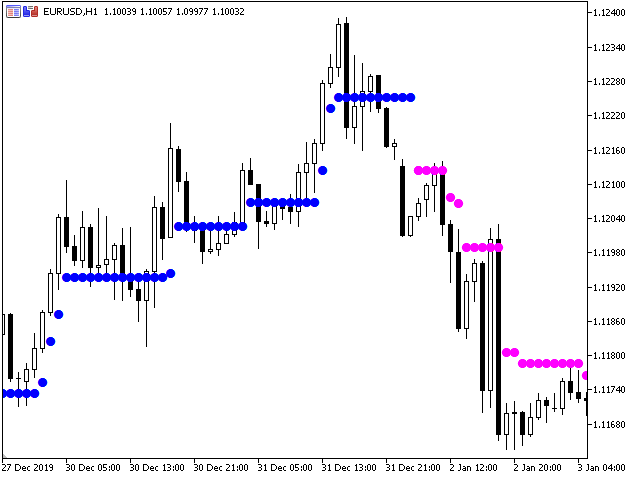
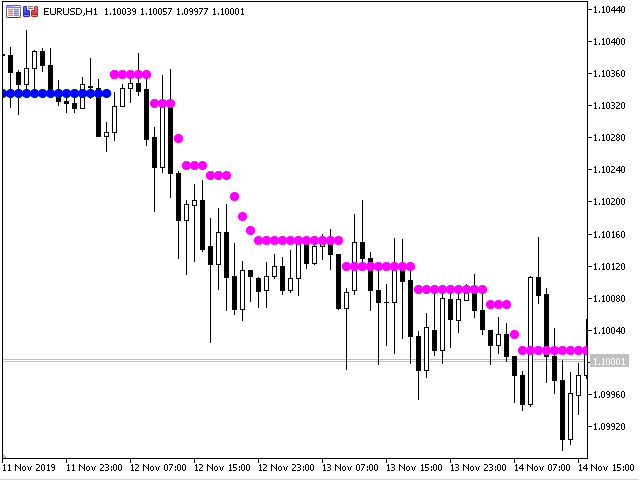
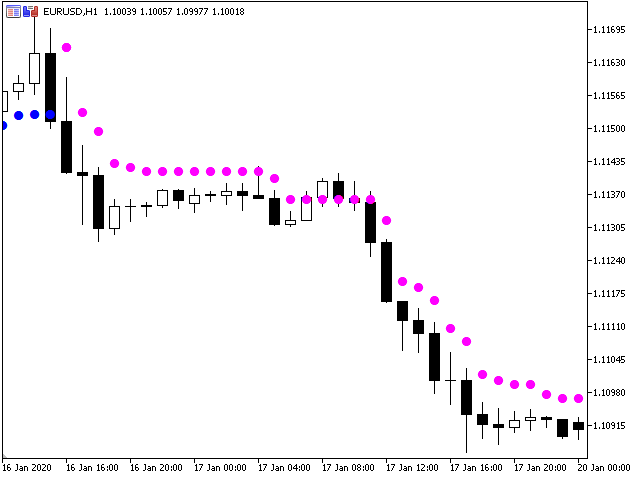
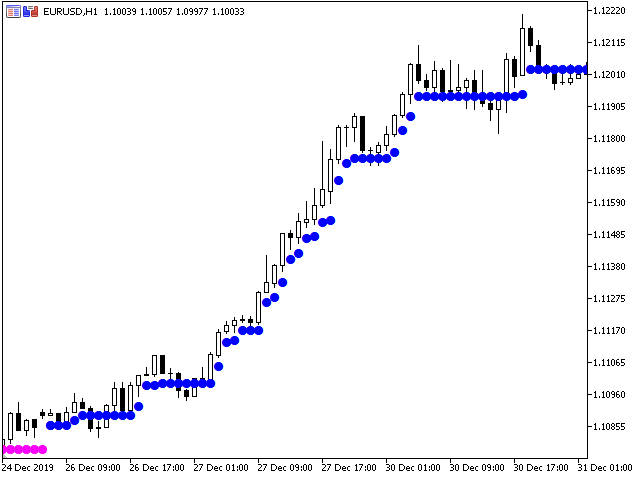
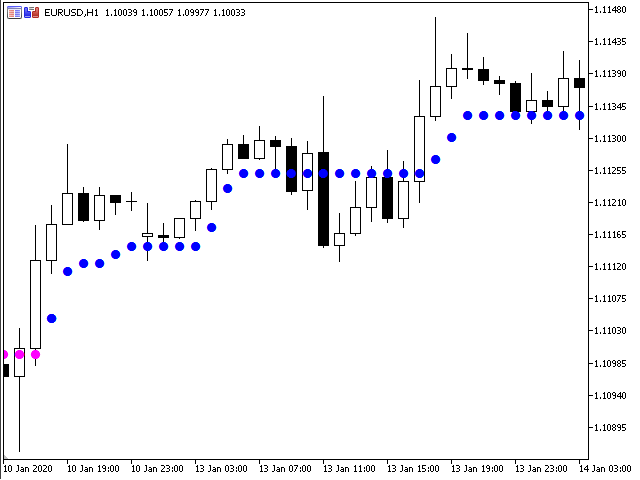
The main application of the Security indicator is to generate buy and sell signals. Determining the market trend is an important task for traders. The Security indicator implements an advanced algorithm for visualizing the market trend. The main purpose of the indicator is to assess the market. Probably, almost every trader has dreamed of non-lagging MAs at least once. I have embodied this dream in my indicator. With this indicator, you can predict future values. The indicator is designed to determine either a trend or short-term buy or sell signals. The indicator will protect your open position on any timeframe and currency pair.
おすすめのプロダクト
Pivot Points Classic – L’indicatore essenziale per ogni trader tecnico Questo indicatore disegna automaticamente i livelli di Pivot Point più utilizzati dai trader professionisti, con supporto completo a 4 metodi di calcolo:   Metodi supportati : • Traditional • Fibonacci • Woodie • Camarilla   Caratteristiche principali :  Calcolo su timeframe superiore (multi-timeframe)  Visualizzazione chiara dei livelli P, R1, R2, R3, S1, S2, S3   Etichette dinamiche con nome e valore del livello  Colori per
FREE
Pivot Point Supertrend (corresponds to Pivot Point Super Trend indicator from Trading View) Pivot Point Period:    Pivot point defined as highest high and highest low... input 2 = defining highest high and highest low with 2 bars on each side which are lower (for highest high) and are higher (for lowest low calculation) ATR Length  : the  ATR  calculation is based on 10 periods ATR Factor: ATR multiplied by 3
FREE
DailySessions
Davide Zunino
4.67 (6)
The indicator represents the session boxes for the Asian, European and American sessions. It is possible to change the time of each session, such as color. It is also possible to disable the display of each session. You will find in input parameters variables to modify in format hh:mm. In Colors tab you can change the color of boxes of each sessions. If you need some implementations please contact me.
FREE
The ultimate signal filter. Get clear, non-repainting arrows only when the trend on M1, M5, M15, and H1 timeframes are fully aligned, confirming strong momentum for scalping or short-term trades. Full Product Description Non-Repainting Arrows: Built using precise closing price data ( rates_total - 1 and iBarShift ), ensuring signals are final and never shift or disappear after the bar closes. What you see is what you get. High-Confidence Signals: Filters out noise by requiring agreement acros
FREE
LT Super Trend
BacktestPro LLC
4.89 (18)
スーパートレンド指標は、トレーダーが市場のトレンドの方向や潜在的なエントリーと出口のポイントを特定するために使用する人気のあるテクニカル分析ツールです。価格の動きとボラティリティに基づいてシグナルを提供するトレンド追従型の指標です。 スーパートレンド指標には、上昇トレンドを示すライン(通常は緑色で表示)と下降トレンドを示すライン(通常は赤色で表示)の2つがあります。トレンドの方向に応じて、ラインは価格チャートの上または下にプロットされます。 スーパートレンド指標を効果的に使用するためには、次の手順に従ってください: 1. トレンドの方向を特定する:スーパートレンドラインを確認して、市場が上昇トレンドか下降トレンドかを判断します。緑色のラインは上昇トレンドを示し、赤色のラインは下降トレンドを示します。 2. エントリーシグナル:スーパートレンドラインの色が変わった場合、トレンドの反転の可能性を示すエントリーの検討を行います。例えば、スーパートレンドラインが赤から緑に変わった場合、下降トレンドから上昇トレンドへの変化を示し、購入の機会を示しています。 3. エグジットシグナル:
FREE
The indicator draws daily support and resistance lines on the chart, as well as the Pivot level (reversal level). Adapted to work in MT5 The standard timeframe for calculating support and resistance levels is D1. You can choose other timeframes according to your strategy (for example, for M1-M15, the optimal timeframe for calculations is H1) The function for calculating support and resistance levels has been updated; in this calculation option, fibonacci levels are taken into account, respec
FREE
Arrow Trends – Clear Trade Entry Signals for MetaTrader 5 Arrow Trends is a professional arrow indicator for MetaTrader 5 designed to provide trade entry signals in the direction of the prevailing trend. Whether you are scalping, day trading, or swing trading, Arrow Trends helps you identify strong opportunities. Key Features: Non-Repainting Signals: Once an arrow appears, it never disappears. Trend-Focused Entries: Signals align with the dominant market direction. Multi-Timeframe Ready: From 1-
The selective pin bar is designed to identify reversals. To use the selective pin bar effectively, traders typically look for Strong Rejection: The tail of the pin bar should extend significantly beyond the surrounding price action. It indicates that there was a sharp rejection of higher or lower prices during the trading period. A strong rejection suggests that the market sentiment may be changing.
FREE
Are you tired of drawing trendlines every time you're analyzing charts? Or perhaps you would like more consistency in your technical analysis. Then this is for you. This indicator will draw trend lines automatically when dropped on a chart. How it works Works similar to standard deviation channel found on mt4 and mt5. It has 2 parameters: 1. Starting Bar 2. Number of bars for calculation The   starting bar   is the bar which drawing of the trend lines will begin, while the   number of bars for c
FREE
Free automatic Fibonacci is an indicator that automatically plots a Fibonacci retracement based on the number of bars you select on the BarsToScan setting in the indicator. The Fibonacci is automatically updated in real time as new highest and lowest values appears amongst the selected bars. You can select which level values to be displayed in the indicator settings. You can also select the color of the levels thus enabling the trader to be able to attach the indicator several times with differe
FREE
Description : Rainbow MT5 is a technical indicator based on Moving Average with period 34 and very easy to use. When price crosses above MA and MA changes color to green, then this is a signal to buy. When price crosses below MA and MA changes color to red, then this is a signal to sell. The Expert advisor ( Rainbow EA MT5 ) based on Rainbow MT5 indicator is now available here . MT4 version is available here .
FREE
Follow The Line MT5
Oliver Gideon Amofa Appiah
4.6 (35)
This indicator obeys the popular maxim that: "THE TREND IS YOUR FRIEND" It paints a GREEN line for BUY and also paints a RED line for SELL. (you can change the colors). It gives alarms and alerts of all kinds. IT DOES NOT REPAINT and can be used for all currency pairs and timeframes. Yes, as easy and simple as that. Even a newbie can use it to make great and reliable trades. NB: For best results, get my other premium indicators for more powerful and reliable signals. Get them here: https://www.m
FREE
My Candle Patterns
Francisco Gomes Da Silva
5 (1)
この指標は、こちらからダウンロードできるMy candleの完全版のデモ版です: Candle Patterns Creator 完全版では、独自のローソク足ルールを作成したり、従来のローソク足パターンを戦略に合わせてより正確に修正することができます。 この指標にはいくつかのローソク足ルールの例が含まれていますが、ここではいくつかをご紹介します: Pattern Rule Candle Green C > O Candle Red C < O Doji C = O Hammer (C > O and (C-O) *2 < O-L and (C-O) *0.5 > H-C) or (C < O and (O-C) *2 < C-L and (O-C) *0.5 > H-O) Hammer Green C > O and (C-O) *2 < O-L and (C-O) *0.5 > H-C Hammer Red C < O and (O-C) *2 < C-L and (O-C) *0.5 > H-O Marubozu  (C > O and C-O > (H-L) * 0.7 ) or
FREE
Donchian Channel is an indicator created by Richard Donchian. It is formed by taking the highest high and the lowest low of the last specified period in candles. The area between high and low is the channel for the chosen period. Its configuration is simple. It is possible to have the average between the upper and lower lines, plus you have alerts when price hits one side. If you have any questions or find any bugs, please contact me. Enjoy!
FREE
FX Clock
Abderrahmane Benali
FXClock – Professional Clock Indicator for Traders Please leave a 5 star rating if you like this free tool! Thank you so much :) The FXClock indicator is a practical and simple tool that displays time directly on your trading platform, allowing you to track multiple key pieces of information at the same time. It is specially designed to help traders synchronize their trading with market hours and global sessions. Key Features: Displays the broker server time with precision. Displays your local c
FREE
The idea of the system is to indentify the reversal patterns using the calculation of the composite candle. The reversal patterns is similar to the "Hammer" and "Hanging Man" patterns in Japanese candlestick analysis. But it uses the composite candle instead the single candle and doesn't need the small body of the composite candle to confirm the reversal. Input parameters: Range - maximal number of bars, used in the calculation of the composite candle. Minimum - minimal size of the composite can
FREE
2本の加重移動平均線(WMA)をチャート上に表示し、低モメンタムおよびレンジ相場を自動検出するプロフェッショナル向けインジケーターです。 WMA1は始値を基準に計算され、軽微なオフセット付きでトレンド方向を示します。 WMA2は終値を基準に計算され、モメンタムの確認に使用されます。 2本のWMA間の距離が縮小すると、ローソク足は自動的にグレー表示となり、市場がレンジまたは調整局面に入っていることを警告します。 すべての通貨ペア、指数、商品、そして全時間足で使用可能です。 SuperSmooth WMA Trading System Proへアップグレード Pro版では、エントリー/イグジットシグナル、ロング/ショートのローソク足カラー表示、上位足EMAトレンドフィルター、MACDモメンタム確認、SMA方向フィルター、リアルタイムアラート、時間足フィルター設定機能を追加。 すべてのフィルターが一致した場合のみシグナルを生成し、誤シグナルを大幅に削減します。 このインジケーターが役に立つと感じた場合は、ぜひレビューをご検討ください。あなたのフィードバックは、他のトレーダーがこのツールを
FREE
概要 このインジケーターは、クラシックな ドンチャンチャネル を強化したバージョンで、実践的なトレード機能を追加しています。 標準の3本線(上限、下限、中央線)に加え、 ブレイクアウト を検出し、チャート上に矢印で視覚的に表示します。また、チャートを見やすくするために、 現在のトレンド方向と逆側のラインのみを表示 します。 インジケーターの機能: 視覚的シグナル :ブレイクアウト時にカラフルな矢印を表示 自動通知 :ポップアップ、プッシュ通知、Eメール RSIフィルター :市場の相対的な強弱に基づいてシグナルを検証 カスタマイズ可能 :色、ラインの太さ、矢印コード、RSI閾値など 動作原理 ドンチャンチャネルは次のように計算します: 上限線 :直近N本のクローズ済みローソク足の最高値 下限線 :直近N本のクローズ済みローソク足の最安値 中央線 :最高値と最安値の平均値 上方ブレイクアウト は終値が上限線を超えたときに発生し、 下方ブレイクアウト は終値が下限線を下回ったときに発生します。 インジケーターは以下を行います: 3本のドンチャンラインを描画 方向転換後の最初のブレイクアウト
FREE
Indicator Description 4 Hull MA Color + Envelopes is a powerful trend-following indicator for MetaTrader 5 that combines four Hull Moving Averages (HMA) with Moving Average Envelopes to clearly identify market direction, trend strength, and potential reversal or pullback zones. This indicator is designed to reduce noise, react quickly to price movement, and provide a clean visual structure for professional trading.   Key Features   4 Hull Moving Averages (20, 50, 100, 200) Automatic color change
FREE
Tabajara V5
Flavio Javier Jarabeck
4.83 (36)
Metatrader 5 version of the famous Andre Machado's Tabajara indicator. If you don't know Andre Machado's Technical Analysis work you don't need this indicator... For those who need it and for those several friend traders who asked this porting from other platforms, here it is... FEATURES 8-period Moving Average 20-period Moving Average 50-period Moving Average 200-period Moving Average Colored candles according to the inflexion of the 20-period MA SETTINGS You can change the Period of all MA's
FREE
Candle Countdown — MT5用 正確なローソク足カウントダウン Candle Countdown は、 現在のローソク足が閉じるまでの残り時間 をチャート上に表示するシンプルで正確なツールです。 エントリーがローソク足のクローズに依存する場合、数秒の違いが重要になります。 このインジケーターは正確な時間を表示し、焦らずに判断できるようサポートします。 ローソク足のクローズ時間を正確に把握するためのインジケーターです。 表示内容: ローソク足が閉じるまでの残り時間 サーバー現在時刻 スプレッド ストップレベル(Stop Level) タイマーはティックに依存せず、プラットフォームの内部タイマーによって更新されるため、市場の動きが少ない場合でも安定した表示を維持します。 これにより、低ボラティリティの環境でも滑らかで安定したカウントダウンを実現します。 情報は背景付きのブロック内に表示されるため、どのチャートカラーでも見やすく、分析の妨げになりません。 ローソク足のクローズが近づくと、タイマーの色が変化し、視覚的に状況を把握しやすくなります。 MT4版はこちら: Cand
FREE
Full Description Overview Drawdown Controller Calculator Indicator is an advanced professional risk-management tool for MetaTrader 5 , specially designed for traders who use multiple running trades, pending orders, grid systems, and martingale strategies . This indicator allows you to see the future drawdown in advance — not only for currently running trades, but also for all pending orders combined , assuming they get triggered step by step. Instead of guessing or hoping, you will know ex
FREE
Harmonic Pattern Suite Pro Introduction Harmonic Pattern Suite Pro is an indicator designed to identify and display harmonic structures on the chart based on X-A-B-C-D sequences. Its purpose is to present pattern formations that meet geometric and proportional criteria, providing a clear visual representation directly on the chart. The indicator automates the detection process, removing the need for manual measurement of ratios and allowing the user to review the structural configuration withou
FREE
Easy GOLD MT5
Franck Martin
3.91 (43)
Easy Gold is the latest addition to the BotGPT family. It is surprising and very powerful. It is ideal for beginners due to its simplicity.  There is absolutely nothing to do, it's 100% automated, simply indicate the percentage of risk you want to take per trade and the EA is ready. Whatever your capital, the EA takes care of everything. Optimized on (XAUUSD).  Unleash all the power with the professional version (AGI Gold) and its connection to the neural network, available in my store. My othe
FREE
Raymond Cloudy Day Indicator for MT5 – Pivot-Based Reversal and Trend Levels Raymond Cloudy Day Indicator is a pivot-based level indicator for MetaTrader 5 (MT5). It was developed by Ngo The Hung based on Raymond’s original idea and is designed to give a structured view of potential reversal zones, trend extensions and support/resistance levels directly on the chart. The default settings are optimised for XAUUSD on the H1 timeframe, but the indicator can be tested and adjusted for other symbols
FREE
Indicator Description Range Filter Pro is a sophisticated trading tool for XAUUSD (Gold) that combines adaptive price filtering with volume analysis and real-time market monitoring. Designed for both novice and professional traders, this indicator helps identify trend direction, potential reversals, and significant market movements through its multi-layered approach. Key Components 1.Dynamic Range Filter 2.Volatility-Adjusted Bands 3.Volume-Enhanced Candles 4.Professional Trading Dashboard 5.M
FREE
Smart Trendlines – No.1 Trendlines Indicator Smart Trendlines is a precision tool that automatically draws trendlines based on every valid pivot point, helping traders identify key support and resistance zones. It continuously adjusts as new market pivots form, providing a live and accurate reflection of price structure. Whether you’re tracking trends, preparing for reversals, or anticipating breakouts — this indicator keeps you one step ahead. It works seamlessly across all assets including For
Airplane   Trend   entry points should be used as potential market reversal points. The indicator works using the cyclic-wave dependence function. Thus, all entry points will be optimal points where the movement changes. The simplest way to use the indicator is to open a trade in the direction of an existing trend. The best result is obtained by combining the indicator with fundamental news, it can act as a news filter, that is, it can show how the market reacts to this or that news. The defa
「Haven Key Levels PDH PDL」   インジケーターは、トレーダーがチャート上の主要なレベルを視覚化するのに役立ちます。次のレベルを自動的にマークします: DO (Daily Open)   — 日足の始値。 NYM (New York Midnight)   — ニューヨーク時間の深夜0時のレベル。 PDH (Previous Day High)   — 前日の高値。 PDL (Previous Day Low)   — 前日の安値。 WO (Weekly Open)   — 週足の始値。 MO (Monthly Open)   — 月足の始値。 PWH (Previous Week High)   — 前週の高値。 PWL (Previous Week Low)   — 前週の安値。 CMH (Current Month High)   — 当月の高値。 CML (Current Month Low)   — 当月の安値。 PMH (Previous Month High)   — 前月の高値。 PML (Previous Month Low)   — 前月の
FREE
Pivot Points are used by Forex traders to find support and resistance levels based on the previous day's price action. There are various ways to calculate pivot points, including averaging the open, high, low, and close of the previous day's chart price. Forex Traders use a combination of pivot points with moving averages to find trading opportunities in the currency markets. Pivot points are very useful tools that use the previous bars' highs, lows and closings to project support and resist
FREE
このプロダクトを購入した人は以下も購入しています
ARIPoint is a powerful trading companion designed to generate high-probability entry signals with dynamic TP/SL/DP levels based on volatility. Built-in performance tracking shows win/loss stats, PP1/PP2 hits, and success rates all updated live. Key Features: Buy/Sell signals with adaptive volatility bands Real-time TP/SL/DP levels based on ATR Built-in MA Filter with optional ATR/StdDev volatility Performance stats panel (Success, Profit/Loss, PP1/PP2) Alerts via popup, sound, push, or email Cu
このインジケーターを購入された方には、以下の特典を 無料 で提供しています: 各トレードを自動で管理し、ストップロスとテイクプロフィットを設定し、戦略ルールに基づいてポジションを決済する補助ツール 「Bomber Utility」 様々な銘柄に合わせたインジケーターの設定ファイル(セットファイル) 「最小リスク」、「バランスリスク」、「待機戦略」 の3つのモードで使用できる Bomber Utility 用の設定ファイル このトレーディング戦略をすぐに導入・設定・開始できる ステップバイステップのビデオマニュアル ご注意: 上記の特典を受け取るには、MQL5のプライベートメッセージシステムを通じて販売者にご連絡ください。 オリジナルのカスタムインジケーター 「Divergence Bomber(ダイバージェンス・ボンバー)」 をご紹介します。これは、MACDのダイバージェンス(乖離)戦略に基づいた 「オールインワン」型のトレーディングシステム です。 このテクニカルインジケーターの主な目的は、価格とMACDインジケーターの間に発生するダイバージェンスを検出 し、将来の価格の動きを示す
Power Candles V3 - 初の自己最適化ストレングス・インジケーター Power Candles V3 は、ストレングス分析をそのままトレード可能なシステムへと変えます。チャートを市場の強さで色分けするだけでなく、バックグラウンドでリアルタイムの自動最適化を実行し、あなたの銘柄に最適な Stop Loss、Take Profit、シグナル閾値を提示します。ワンクリックでライブトレードに適用できます。 このツールは Stein Investments エコシステムの一部です。  18 種のツール一覧、AI によるセットアップ提案、  そしてコミュニティ参加はこちら: https://stein.investments Version 3 の新機能 - AUTO-OPTIMIZER チャート読み込み時、そして各バーの確定ごとに、Power Candles V3 は該当銘柄の過去データ上で 3,000 を超えるトレードの組み合わせ をシミュレーションします: 2 つの戦略 を並列でテスト: Momentum (MOM) と Reversal (REV) 3 段階のシグナル閾値
優れたテクニカルインジケーター「Grabber」をご紹介します。これは、すぐに使える「オールインワン」トレーディング戦略として機能します。 ひとつのコードに、市場のテクニカル分析ツール、取引シグナル(矢印)、アラート機能、プッシュ通知が強力に統合されています。 このインジケーターを購入された方には、以下の特典を無料で提供します: Grabberユーティリティ:オープンポジションを自動で管理するツール ステップバイステップのビデオマニュアル:インジケーターのインストール、設定、取引方法を解説 カスタムセットファイル:インジケーターをすばやく自動設定し、最大限の成果を出すための設定ファイル 他の戦略はもう忘れてください!Grabberだけが、あなたを新たなトレードの高みへと導いてくれるのです。 Grabber戦略の主な特徴: 推奨タイムフレーム:M5〜H4 対応通貨ペア・資産:どれでも使用可能ですが、私が実際に検証した以下を推奨します(GBPUSD、GBPCAD、GBPCHF、AUDCAD、AUDUSD、AUDSGD、AUDCHF、NZDUSD、NZDCAD、EURCAD、EURUSD、E
このインジケーターを購入すると、プロ仕様のトレードマネージャーを無料で差し上げます。 まず第一に、このトレーディングシステムがノンリペイント、ノンリドロー、ノンラグのインジケーターであることを強調する価値がある。これにより、手動取引とロボット取引の両方に理想的なものになっています。 オンラインコース、マニュアル、プリセットのダウンロード。 「スマートトレンドトレーディングシステム MT5」は、新規および経験豊富なトレーダー向けにカスタマイズされた包括的なトレーディングソリューションです。10以上のプレミアムインジケーターを組み合わせ、7つ以上の堅実なトレーディング戦略を備えており、多様な市場状況に対応する多目的な選択肢となっています。 トレンドフォロー戦略:トレンドを効果的に乗り越えるための正確なエントリーとストップロス管理を提供します。 リバーサル戦略:潜在的なトレンドの反転を特定し、トレーダーがレンジ相場を活用できるようにします。 スキャルピング戦略:高速で正確なデイトレードおよび短期取引のために設計されています。 安定性:すべてのインジケーターはノンリペイント、ノンリドロー、ノ
Quantum TrendPulse を ご紹介します。これは、   SuperTrend   、   RSI   、および Stochastic のパワーを 1 つの包括的なインジケーターに組み合わせて、取引の可能性を最大限に引き出す究極の取引ツールです。精度と効率を求めるトレーダー向けに設計されたこのインジケーターは、市場のトレンド、勢いの変化、最適なエントリー ポイントとエグジット ポイントを自信を持って特定するのに役立ちます。 主な特徴: SuperTrend 統合: 現在の市場動向に簡単に追従し、収益性の波に乗ることができます。 RSI精度: 買われすぎと売られすぎのレベルを検出し、市場の反転のタイミングに最適で、SuperTrendのフィルターとして使用されます。 確率的精度: 確率的振動を活用して、変動の激しい市場で隠れたチャンスを見つけます。SuperTrend のフィルターとして使用されます。 マルチタイムフレーム分析:   M5 から H1 または H4 まで、さまざまなタイムフレームで市場を常に把握します。 カスタマイズ可能なアラート: カスタム取引条件が満たされ
Azimuth Pro
Ottaviano De Cicco
5 (7)
Azimuth Pro V2:MT5向けシンセティック・フラクタル構造分析と確認済みエントリー 概要 Azimuth Pro は Merkava Labs によるマルチレベルスイング構造インジケーターです。4つのネストされたスイングレイヤー、スイングアンカーVWAP、ABCパターン検出、3タイムフレーム構造フィルタリング、そして確定バーでの確認済みエントリー — 1つのチャートで、ミクロスイングからマクロサイクルまでを網羅するワークフロー。 これはブラインドシグナル製品ではありません。ロケーション、コンテキスト、タイミングを重視するトレーダーのための構造ファーストワークフローです。 V2発売記念オファー — Azimuth Pro V2をUSD 399で(次の100本)。最終価格:USD 499。 1. V2での変更点 シンセティック・マルチタイムフレームエンジン 上位タイムフレーム分析をMeridian Proと同じ独自のシンセティックアーキテクチャで一から再構築。よりクリーンなHTFコンテキスト、安定したライブ動作、従来のMTF同期問題なし。シンセティックエンジンは 固定比率タ
これはMT5のインジケーターで、再描画なしで取引に参入するための正確なシグナルを提供します。 外国為替、暗号通貨、金属、株式、インデックスなど、あらゆる金融資産に適用できます。かなり正確な見積もりを提供し、取引を開始して終了するのに最適な時期を教えてくれます。1つのシグナルを処理しただけでインジケーターの元が取れた例の 動画 (6:22)をご覧ください。Entry PointsPro インジケーターの助けを借りたほとんどのトレーダーの最初の1週間の結果が改善しています。 Telegramグループ に登録してください。Entry Points Proインジケーターのメリットは次の通りです。 再描画のないエントリーシグナル 再描画されるインジケーターでは一度表示されたシグナルが削除されて大きな金銭的損失につながることがありますが、これと異なり、表示されて確認されたシグナルは消えることがありません。 エラーなしの取引開始 インジケーターアルゴリズムによって取引を開始する(資産を売買する)理想的な瞬間を見つけることができます。それを使用するすべてのトレーダーの成功率が向上します。 あら
FX Trend NG:次世代マルチマーケット・トレンドインテリジェンス 概要 FX Trend NG は、複数の時間足に対応したプロフェッショナル向けトレンド分析およびマーケット監視ツールです。 市場全体の構造を数秒で把握することができます。 複数のチャートを切り替える必要はありません。どの銘柄がトレンド中なのか、どこでモメンタムが弱まっているのか、そしてどの時間足で強い整合性があるのかを瞬時に確認できます。 ローンチ特別オファー – FX Trend NG を $30(6ヶ月) または $80 永久ライセンス でご利用いただけます。 すでに Stein Investments のユーザーですか? -> メッセージを送信 して、プライベートグループへアクセスしてください。 セットアップや詳細情報が必要ですか? -> Stein Investments 公式ページ をご覧ください。 1. FX Trend NG が他と異なる理由 3ステート・トレンドロジック ― Buy と Sell だけではない • 多くのインジケーターは Buy または Sell の2状態のみを表示します。
マーケットメーカーのためのツール。 Meravith は次の機能を提供します: すべての時間足を分析し、現在有効なトレンドを表示します。 強気と弱気の出来高が等しくなる流動性ゾーン(出来高均衡)を強調表示します。 異なる時間足のすべての流動性レベルをチャート上に直接表示します。 テキスト形式の市場分析を生成し、参考情報として表示します。 現在のトレンドに基づいて目標値、サポートレベル、ストップロスを計算します。 取引のリスクリワード比を算出します。 口座残高に基づいてポジションサイズを計算し、潜在的な利益を推定します。 また、市場に大きな変化があった場合には警告を表示します。 インジケーターの主要ライン: 強気/弱気の出来高エグゾーストライン ― 目標値として機能します。 市場のトレンドを示すライン。市場が強気か弱気かによって色が変わり、トレンドのサポートとして機能します。主にその色が市場センチメントを示します。 出来高均衡ライン(Eq)。Eq(Volume Equilibrium)ラインはシステムの中核です。これは買い手と売り手の出来高のバランスポイントを表します。市場の流動性を示し
SignalTech MT5 is a trading system for EURUSD, USDCHF, USDJPY, AUDUSD, NZDUSD, EURJPY, AUDJPY, NZDJPY, CADJPY H2 and H3 Timeframe.  It can generate signals with Buy/Sell Arrows and Pop-Up/Sound Alerts. Each signal has clear Entry and Stop Loss levels, which should be automatically flagged on the chart, as well as potential Targets 1, 2, and 3. The Entry and TP levels are fixed after the trade is taken. The exit level is dynamic. If there are signs of a potential short-term trend reversal, the
BTMM State Engine Pro is a MetaTrader 5 indicator for traders who use the Beat The Market Maker approach: Asian session context, kill zone timing, level progression, peak formation detection, and a multi-pair scanner from a single chart. It combines cycle state logic with a built-in scanner dashboard so you do not need the same tool on many charts at once. What it does Draws the Asian session range; session times can follow broker server offset or be set in inputs. Tracks level progression (L
Bill Williams Advanced is designed for automatic chart analysis using Bill Williams' "Profitunity" system. The indicator analyzes four timeframes at once. Manual (Be sure to read before purchasing) Advantages 1. Analyzes the chart using Bill Williams' "Profitunity" system. Signals are displayed in a table in the corner of the screen and on the price chart. 2. Finds all known AO and AC signals, as well as zone signals. Equipped with a trend filter based on the Alligator. 3. Finds "Divergence Bar
まず第一に、この取引インジケーターは再描画されず、再描画されず、遅延しないことを強調する価値があります。これにより、手動取引とロボット取引の両方に理想的なものになります。 ユーザーマニュアル:設定、入力、戦略。 アトミックアナリストは、価格の強さとモメンタムを利用して市場でより良いエッジを見つけるためのPA価格アクションインジケーターです。ノイズや誤ったシグナルを除去し、取引ポテンシャルを高めるための高度なフィルターを備えています。複雑なインジケーターの複数のレイヤーを使用して、アトミックアナリストはチャートをスキャンし、複雑な数学的計算をシンプルなシグナルと色に変換します。これにより、どのような初心者トレーダーでも理解して使用し、一貫した取引の決定を行うことができます。 「アトミックアナリスト」は、新規および経験豊富なトレーダー向けにカスタマイズされた包括的な取引ソリューションです。プレミアムインジケーターとトップノッチの機能を1つの取引戦略に組み合わせ、すべてのタイプのトレーダーにとって汎用性のある選択肢にします。 デイリートレーディングとスキャルピング戦略:高速で正確なデイ
ご紹介     Quantum Breakout PRO は 、ブレイクアウト ゾーンの取引方法を変革する画期的な MQL5 インジケーターです。 13年以上の取引経験を持つ経験豊富なトレーダーのチームによって開発されました。     クォンタム ブレイクアウト プロ   は、革新的でダイナミックなブレイクアウト ゾーン戦略により、あなたのトレーディングの旅を新たな高みに押し上げるように設計されています。 クォンタム ブレイクアウト インジケーターは、5 つの利益ターゲット ゾーンを備えたブレイクアウト ゾーン上のシグナル矢印と、ブレイクアウト ボックスに基づいたストップロスの提案を提供します。 初心者トレーダーにもプロのトレーダーにも適しています。 量子EAチャネル:       ここをクリック 重要!購入後、インストールマニュアルを受け取るためにプライベートメッセージを送ってください。 推奨事項: 時間枠: M15 通貨ペア: GBPJPY、EURJPY、USDJPY、NZDUSD、XAUUSD アカウントの種類: ECN、Raw、またはスプレッドが非常に低い R
OmniSync Projection
Antonio-alin Teculescu
5 (1)
Chronos Fractal Engine is an innovative price projection indicator for MetaTrader 5, designed to transform your technical analysis by intelligently identifying and projecting historical price patterns. Built upon an advanced correlation algorithm and the fractal principles of the market, this powerful tool visualizes potential future price movements, giving you a unique edge in your trading decisions. What is Chronos Fractal Engine? At its core, the Chronos Fractal Engine employs a sophisticat
FX Power: 通貨の強弱を分析して、より賢い取引を実現 概要 FX Power は主要通貨と金の実際の強弱をあらゆる市場状況で理解するための必須ツールです。強い通貨を買い、弱い通貨を売ることで、 FX Power は取引の意思決定を簡素化し、高い確率の取引機会を見出します。トレンドを追従する場合でも、極端なデルタ値を使用して反転を予測する場合でも、このツールはあなたの取引スタイルに完全に適応します。ただ取引するだけではなく、 FX Power で賢く取引をしましょう。 1. なぜ FX Power がトレーダーにとって非常に有益なのか 通貨と金のリアルタイム強弱分析 • FX Power は主要通貨と金の相対的な強弱を計算し、マーケットダイナミクスに関する明確な洞察を提供します。 • どの資産がリードしているか、または後れを取っているかを監視して、取引するペアを賢く選びましょう。 マルチタイムフレームの包括的なビュー • 短期、中期、長期のタイムフレームで通貨と金の強弱を追跡し、マーケットトレンドに基づいて取引戦略を調整できます。 • スキャルピングからスイングトレード
Berma Bands
Muhammad Elbermawi
5 (8)
Berma Bands (BBs) インジケーターは、市場のトレンドを特定して活用したいトレーダーにとって貴重なツールです。価格と BBs の関係を分析することで、トレーダーは市場がトレンド段階にあるか、レンジ段階にあるかを判断できます。 詳細については、[ Berma Home Blog ] をご覧ください。 バーマ バンドは、上部バーマ バンド、中部バーマ バンド、下部バーマ バンドの 3 つの異なる線で構成されています。これらの線は価格の周りにプロットされ、全体的な傾向に対する価格の動きを視覚的に表します。これらのバンド間の距離から、ボラティリティや潜在的な傾向の反転についての洞察を得ることができます。 バーマ バンドの線がそれぞれ離れると、市場が横ばいまたはレンジ相場の期間に入っていることを示すことがよくあります。これは、明確な方向性の偏りがないことを示しています。トレーダーは、これらの期間中にトレンドを特定するのが難しいと感じる可能性があり、より明確なトレンドが出現するまで待つ場合があります。 バーマ バンドの線が 1 本の線に収束すると、強いトレンド環境の兆候となること
Gartley Hunter Multi - An indicator for searching for harmonic patterns simultaneously on dozens of trading instruments and on all possible timeframes. Manual (Be sure to read before purchasing) | Version for MT4 Advantages 1. Patterns: Gartley, Butterfly, Shark, Crab. Bat, Alternate Bat, Deep Crab, Cypher 2. Simultaneous search for patterns on dozens of trading instruments and on all possible timeframes 3. Search for patterns of all possible sizes. From the smallest to the largest 4. All fou
メタポイントプロ   これは、取引における推測を排除し、市場が既に決定を下したポイントを示すトレンドフォローツールです。この指標は、トレンド、動向、構造が変化する重要なポイントを特定し、主要プレーヤーがポジションを取るべき価格の戻り領域を強調表示します。 単に値動きを見るだけでなく、その背後にある論理を理解できます。すべてのシグナルはローソク足が確定した後に記録され、再描画されることなくチャート上に保存されるため、自信を持って状況を分析し、意思決定を行うことができます。トレード目標(利益確定)も表示されます。 この指標の有効性について完全に確信を持っていただくために、自動統計機能をご利用いただけます。 方向転換のたびに、インジケーターはストップロスレベルとそのインテリジェントな段階的移動(Move SL)も表示します。これは非常に重要です。     削減する   リスク   ポジション別。 損切り/利益確定/リスクリワード 右側に内蔵されたパネルには、現在の世界的なトレンドの方向における市場参入ポイントが表示され、過去のデータからもこれらのシグナルが確認できます。 任意の時間枠/ツール
「 Dynamic Scalper System MT5 」インジケーターは、トレンド波の中でスキャルピング取引を行う手法のために設計されています。 主要通貨ペアと金でテスト済みで、他の取引商品との互換性があります。 トレンドに沿った短期的なポジションオープンのシグナルを提供し、追加の価格変動サポートも提供します。 インジケーターの原理 大きな矢印はトレンドの方向を決定します。 トレンド波の中では、小さな矢印の形でスキャルピングシグナルを生成するアルゴリズムが機能します。 赤い矢印は強気方向、青い矢印は弱気方向です。 トレンドの方向には敏感な価格変動ラインが描かれ、小さな矢印のシグナルと連動します。 シグナルは次のように機能します。適切なタイミングでラインが現れるとエントリーシグナルが形成され、ラインが開いている間はポジションが保持され、完了すると取引が終了します。 推奨される動作時間枠はM1~H4です。 矢印は現在のローソク足に形成され、次のローソク足が開いている場合は、前のローソク足の矢印は再描画されません。 入力パラメータ Trend Wave Period - トレ
Meridian Pro
Ottaviano De Cicco
5 (1)
Meridian Pro:MT5用プロフェッショナル・マルチタイムフレーム・トレンドマトリックス 概要 Meridian Pro は Merkava Labs が開発したマルチタイムフレーム・トレンドマトリックスで、方向性の状態、強度、モメンタムの状況、マトリックスの合意をひとつのコンパクトなパネルに集約します。ひとつのアダプティブエンジンがM1からW1まで一貫して適用されます。シンボルごとの調整は不要。インジケーターの積み重ねも不要。すべてのアセットとすべてのタイムフレームをカバーするひとつの構造化された読み取りです。 発売キャンペーン — Meridian Proを USD 99 (導入価格)で入手。通常価格:USD 149 。 1. Meridian Proが他と異なる理由 ひとつのエンジン、バラバラなインジケーターのダッシュボードではない 多くのMTFダッシュボードは、タイムフレームごとに生のインジケーター値を繰り返すだけです。Meridian Proはマトリックス全体でひとつのアダプティブ・トレンドエンジンを使用するため、パネルの各行が同じ構造化フレームワークから導出されます
Gannスクエアインジケーターは、W.D. Gannによって執筆された「市場予測のための数学的な式」の記事に基づく強力な市場分析ツールです。このツールは、解析に数学的な概念を応用し、Gann理論に基づいています。それは、144、90、52のスクエアや9のスクエアなど、Gannの関連テクニックの要素を取り入れています。さらに、の方法を組み込んでおり、9のスクエアとその関連性についてのチャネルやスターパターンに焦点を当てています。 ユーザーマニュアルと使用方法: このインジケーターを使用する前に、ユーザーマニュアルを読んで疑問点を解決するためにお問い合わせいただくことをお勧めします。ユーザーマニュアルの完全版は、当社のウェブサイトで入手できます。 MT5の完全版は購入できますし、MT4の無料版も試すことができます。両方のバージョンへのリンクを提供していますので、ご利用ください。 主な機能と機能: Gannスクエアインジケーターは、市場分析のための完全なツールセットを提供し、幾何学的な概念とGann理論に基づいて的確な判断を行う手助けをします。以下に主な機能を示します。 9のスクエアの分析:
Cvd Divergence
Thalles Nascimento De Carvalho
CVD Divergence ― オーダーフローとダイバージェンスのプロフェッショナル分析 CVD Divergence は、価格と Cumulative Delta Volume(CVD)との間に発生する信頼性の高いダイバージェンスを検出するために開発されたテクニカル指標です。実際の注文フローが価格の動きを確認していない局面を正確に捉え、反転、勢いの減衰、そして機関投資家による操作の可能性を示します。 このインジケーターは、アグレッシブボリュームの読み取りと価格構造の分析を組み合わせ、明確で客観的かつ先行性のあるシグナルを提供します。 インジケーターの機能 CVD Divergence は、累積デルタボリュームを用いて注文フローの方向と価格の方向を比較します。両者が大きく乖離した際、チャート上にマーカーを表示し、ダイバージェンスの方向を視覚的に示します。 検出できる内容: 強気ダイバージェンス(価格が下落しているが CVD が上昇している場合) 弱気ダイバージェンス(価格が上昇しているが CVD が下降している場合) 買い手・売り手の勢いの枯渇 機関投資家の不均衡によるフェイクムーブ
FX Volume MT5
Daniel Stein
4.79 (24)
FX Volume:ブローカー視点で捉える本物の市場センチメント クイック概要 トレード手法をさらに高めたいとお考えですか? FX Volume は、リテールトレーダーやブローカーのポジション状況をリアルタイムで提供します。これは、COTのような遅延レポートよりもはるかに早く知ることができます。安定した利益を目指す方も、さらなる優位性を求める方も、 FX Volume は大きな不均衡を見極め、ブレイクアウトを確認し、リスク管理を洗練させるのに役立ちます。今すぐ始めて、実際の出来高データがどのように意思決定を変革するかを体感してください! 1. FX Volume がトレーダーにとって非常に有益な理由 高精度の早期警戒シグナル • 各通貨ペアを売買しているトレーダー数を、他者よりも早く、ほぼリアルタイムで把握できます。 • FX Volume は、複数のリテールブローカーから得られる本物の出来高データを収集し、分かりやすい形式で提供する 唯一 のツールです。 強力なリスク管理 • ロングやショートの大きな偏り(インバランス)を特定し、潜在的なトレンド転換を見逃しません。ストップ
Introducing Indicator for PainX and GainX Indices Traders on Weltrade Get ready to experience the power of trading with our indicator, specifically designed for Weltrade   broker's PainX and GainX Indices.  Advanced Strategies for Unbeatable Insights Our indicator employs sophisticated strategies to analyze market trends, pinpointing optimal entry and exit points.  Optimized for Maximum Performance To ensure optimal results, our indicator is carefully calibrated for 5-minute timeframe charts on
Presenting one-of-a-kind Gann Indicator for XAUUSD IQ Gold Gann Levels is a non-repainting, precision tool designed exclusively for XAUUSD/Gold intraday trading. It uses W.D. Gann’s square root method to plot real-time support and resistance levels, helping traders spot high-probability entries with confidence and clarity. William Delbert Gann (W.D. Gann) was an exceptional market analyst whose trading technique was based on a complex blend of mathematics, geometry, astrology, and ancient calcul
このダッシュボードは、選択されたシンボルの最新の利用可能なハーモニックパターンを表示するので、時間を節約し、より効率的に /   MT4バージョン 。 無料インジケーター:   Basic Harmonic Pattern インジケーター列 Symbol : 選択したシンボルが表示されます。 Trend :   強気または弱気 Pattern : パターンの種類(ガートレー、バタフライ、バット、カニ、サメ、サイファー、ABCD) Entry : エントリー価格 SL: ストップロス価格 TP1: 1回目の利食い価格 TP2: 2回目の利食い価格 TP3:   3回目の利食い価格 Current price :   現在値 Age (in bars):    最後に描画されたパターンの年齢 主な入力項目 Symbols:   "28 Major Currency Pairs "または "Selected Symbols "から選択。 Selected Symbols:   カンマで区切られた監視したいシンボル("EURUSD,GBPUSD,XAUUSD")。ブローカーがペアに接
RelicusRoad Pro: 定量的市場オペレーティングシステム 【期間限定】無制限アクセス 70% OFF - 2,000人超のトレーダーと共に なぜ多くのトレーダーは「完璧な」インジケーターを使っても失敗するのでしょうか? それは、文脈を無視して 単一の概念 だけでトレードしているからです。文脈のないシグナルは単なるギャンブルです。勝ち続けるには、 根拠の重なり(コンフルエンス) が必要です。 RelicusRoad Proは単なる矢印インジケーターではありません。完全な 定量的市場エコシステム です。独自のボラティリティモデリングを用いて、価格が推移する「適正価値の道(Fair Value Road)」をマッピングし、ノイズと真の構造的ブレイクを判別します。 推測はやめましょう。機関投資家レベルの「ロード・ロジック」でトレードを。 コアエンジン:「Road」アルゴリズム システムの中心となる Road Algo は、市場環境にリアルタイムで適応するダイナミックなボラティリティチャネルです。 安全ライン(平衡点) と、価格が数学的に反転しやすい 拡張レベル を投影します。 Si
まず第一に、この取引ツールはノンリペイント、ノンリドロー、ノンラグの指標であり、プロの取引に理想的ですことを強調する価値があります。 オンラインコース、ユーザーマニュアル、デモ。 スマートプライスアクションコンセプトインジケーターは、新米から経験豊富なトレーダーまで、非常 に強力なツールです。Inner Circle Trader AnalysisやSmart Money Concepts Trading Strategiesなど、20以上の有用な指標を1つに組み合わせています。このインジケーターはスマートマネーコンセプトに焦点を当て、大手機関の取引方法を提供し、彼らの動きを予測するのに役立ちます。 特に、流動性分析に優れており、機関がどのように取引しているかを理解しやすくしています。市場のトレンドを予測し、価格の動きを慎重に分析するのに優れています。機関の戦略とトレードを合わせることで、市場の動向についてより正確な予測ができます。このインジケーターは多目的であり、市場構造を分析し、重要な注文ブロックを特定し、さまざまなパターンを認識するのに優れています。 このインジケーター
作者のその他のプロダクト
Working with the Smart Analiz indicator is very simple - you just react to the arrows that the indicator reflects, that is, the arrow is a command for action. The indicator signals are accurate enough and you can trade using this information! The indicator builds a very high-quality channel in which it generates entry signals! Which is the ideal strategy for a trader as the trader is always hesitant when choosing a strategy to work with. That is, this indicator will allow you to solve the dilemm
The Beautiful indicator shows potential market reversal points. The intelligent algorithm of the indicator detects the trend well, filters out market noise and generates input signals and exit levels. Uses just one parameter for settings. Simple, visual and efficient trend detection. The indicator does not redraw and does not lag. You can set up message alerts as sound or email. Works on all currency pairs and on all timeframes. Ready-made trading system.
The Arrows Forecasters indicator is simple, visual and effective trend detection. The intelligent algorithm of the indicator determines the trend with a good probability. Uses just one parameter for settings. The indicator shows the points of potential market reversal. Ready-made trading system. The indicator does not redraw and does not lag. Works on all currency pairs and on all timeframes. You should remember that using a combination of forecasting tools, it is advisable to choose 2-3 indic
Balanced Costing - shows signals - can be used with an optimal risk factor. The indicator can be used both for pipsing on small periods and for long-term trading. The Balanced Costing trend indicator uses reliable algorithms in its calculations. Shows favorable moments for entering the market with arrows, that is, using the indicator is quite simple. Works on all currency pairs and on all timeframes. Of course, the approach to trading should be complex and in order to make a decision, you shou
The Signal Point Channel indicator predicts the most likely short-term price movement based on complex mathematical calculations. One of the biggest challenges traders face is finding a trading system that's right for them. This indicator is designed to detect trends in price movement and allows you to quickly determine not only the direction of the trend, but also to understand the levels of interaction between buyers and sellers. It has no settings and therefore can be perceived as it signals.
The Transition Trend indicator shows the points of potential market reversal. The indicator's smart algorithm detects the trend, filters out market noise and generates entry signals and exit levels. Simple, visual and efficient trend detection. Uses just one parameter for settings. The indicator does not redraw and does not lag. You can set up message alerts as sound or email. Works on all currency pairs and all timeframes. Ready-made trading system.
World Trend
Tatiana Savkevych
5 (1)
World Trend is a hybrid trend indicator, as it is based on the signals of elementary indicators and a special algorithm for analysis. The indicator shows favorable moments for entering the market. The intelligent algorithm of the indicator determines the trend, filters out market noise and generates entry signals. You can use the indicator as the main one to determine the trend. The indicator can work both for entry points and as a filter. Uses two options for settings. The indicator uses colo
The Generic Trend indicator is a trend type indicator. It smooths out price fluctuations when generating a signal by averaging the data and the signal only at certain moments! In those moments when you need to make a decision to enter a position and give the trader a direction. The indicator gives the trader the opportunity to visually determine which trend will be present at a particular time interval. This indicator was created to quickly determine the situation in the market, reflect the st
The Trend Privacy indicator is easy to set up and works on all pairs and all time frames. Identifies the mainstream and helps analyze the market at a selected time frame It is extremely important for any trader to correctly determine the direction and strength of the trend movement. Unfortunately, there is no single correct solution to this problem. Many traders trade on different time frames. For this reason, the received signals are perceived subjectively. Trend indicators provide an opportu
Chaos Trend is an arrow indicator for identifying potential entry points. I like it, first of all, because it has a simple mechanism of work, adaptation to all time periods and trading tactics. More reliably, the Forex Chaos Trend indicator is a real trading strategy with which you can achieve the desired results. As soon as the Chaos Trend indicator is installed, the main indicators for the price of the traded pair will immediately begin to be recalculated, based on the postulates of technica
Channel Smooth - Forex channel indicator is a very useful and relevant tool for any trader, thanks to which you can efficiently and competently perform plotting on the chart, including automatically, without wasting time on independent calculations and eliminating the risk of incorrect point selection. Channels are needed to trade channel strategies that involve working within a certain price range. The key difference between the Channel Smooth indicator and other channel indicators (for examp
Trend Improved - Arrow trend indicator, without lagging and redrawing, is used by traders in trending strategies in trading on financial markets (Forex, CFDs, binary options). Key parameter MinAngle - The parameter is set in pips. For each instrument, select individually, start from scratch. If the parameter is too large then there will be no signals. The tool, at the very least, deserves attention for its signal accuracy and intuitiveness. Increasing the Period parameters decreases the numbe
Forex Roulette - Trend Following Strategy! The most reliable indicator is used for the trend - the moving average. Only for the global trend, then the strategy itself is implemented. On screenshots, testing from $ 10,000, but the bot works without problems with $ 100. The first graph is optimization, the second is forecast. You can repeat yourself on another period, observing the principle indicated below. How the bot works. Optimization for the m15 period, after which works for 3 months. Very
Projection Trend - a Forex arrow indicator without redrawing does not change its signals when the market situation changes, does not adjust to the chart. The signals given by him are unambiguous. Traders build a trading system that provides good signals 80-90% of the time. The indicator showing the points of entry and exit from the market with arrows is able to bring results not only in the Forex market, but also when working with binary options. You can buy it and install it in MetaTrader you
Calc Trend is a Forex trend indicator based on the familiar RSI, but there is one "but"! We display RSI indicator signals on a price function chart using a mathematical approach. As you know, the overbought and oversold zones that the standard RSI fixes are often broken by the price and the price goes the other way. This makes the standard indicator inapplicable for real work in its pure form. Also, for sure, each user has noticed that at any part of the history, it is possible to change the R
Calc Trend Ex is a forex trending bot based on the Calc Trend indicator. A bot created on the basis of this Calc Trend indicator and working on the principle - if there is an indicator signal, then the bot has closed an opposite deal and opened a new deal in the specified direction, it can be downloaded and used for work. The bot is as simple as possible! The bot fully reflects the work of the indicator. Moreover, the bot can be optimized (by optimizing the parameters of the indicator itself)
First Derivative RSI is a forex indicator based on all familiar RSI, based on the first derivative of the price function. The indicator combines the functionality of an oscillator and a trend indicator. At the bottom of the chart, a part of the indicator similar to the RSI will be displayed, but only calculated as the first derivative of the price. On the chart itself, trend signals will be displayed by arrows, they are filtered by the algorithm and always alternate buy / sell. It also shows th
Trend First Derivative RSI is a Forex indicator based on all familiar RSI, based on the first derivative of the price function. On the chart itself, trend signals will be displayed by arrows, they are filtered by the algorithm and always alternate buy / sell. It also shows the number of profitable pips that the indicator can give at the specified interval (LimitCalcHistory). The indicator has a parameter (Spread), which deducts a part of the profit per spread for each signal. To control the pe
Trend First Derivative RSI is a Forex trending bot based on the First Derivative RSI indicator. In the screenshots you can see tests that show the bot can work for 1,3,6 years, the timeframe is one hour. These are demo tests that show that it is realistic to go through significant sections of history with a different indicator and simple rules. Below in the text you will see a description of the rules of work. For real work, optimization is proposed for 3-12 months and work up to 1-2 months. O
Second Derivative RSI is a forex indicator based on all familiar RSI, based on the second derivative of the price function. Just a note on the use of the indicator. The indicator requires selection of settings not only for each currency pair but also for each timeframe. If there is no setting, then as a last resort, the indicator may not show signals! In order to pick up the settings, just use a bot that will help you do it. The indicator combines the functionality of an oscillator and a tren
Trend Second Derivative RSI is a forex indicator based on the usual RSI, based on the second derivative of the price function. On the chart itself, trend signals will be displayed by arrows, they are filtered by the algorithm and always alternate buy / sell. It also shows the number of profitable pips that the indicator can give at the specified interval (LimitCalcHistory). The indicator has a parameter (Spread), which deducts a part of the profit per spread for each signal. Immediately notice
Trend Second Derivative RSI Ex is a forex trending bot based on the Trend Second Derivative RSI indicator. Principle of operation. A bot created on the basis of this Trend Second Derivative RSI indicator and working on the principle - if there is an indicator signal, then the bot has closed the opposite deal and opened a new deal in the specified direction. It is also possible to work only for buy or sell, in which case the bot will simply close the deal without opening it in the opposite dire
Intel Trend is a forex trend indicator based on all the usual SAR, using differential calculus to generate a signal not directly from the price but from the derivative of the function. Also, when using the SAR indicator, the first point often changes, which is why the default parameter ShiftBar = 1. To skip the first baoa and read information directly from the second bar. If you set ShiftBar = 0, there will be perfect signals, but they are false. real signals for each timeframe and for each cur
Intel Trend Ex is a forex trending bot based on the Intel Trend indicator. Principle of operation. A bot created on the basis of this Intel Trend indicator and working on the principle - if there is an indicator signal, then the bot has closed an opposite deal and opened a new deal in the specified direction. It is also possible to work only for buy or sell, in which case the bot will simply close the deal without opening it in the opposite direction. The bot is also equipped with an adaptive
The Nuremberg tool presents a channel-like algorithm. The best arrow algorithms use channels without redrawing. Its settings indicate the parameters of the length and width of the channel. The indicator was created in such a way that you can fix the reaction to the channel breakout and display it in the form of an arrow. Arrow indicator Nuremberg on Forex indicates points of entry into transactions without redrawing. It generates fairly frequent and accurate signals. When an upward arrow appea
Unchained is intended for scalping trading. It is used to trade on five and fifteen-minute timeframes. But it works on H1 and higher too. According to the traders themselves, the best arrow indicator is the one that does not redraw, i.e. does not imply changes in indicators. When an upward arrow appears on the chart, the trader opens a buy order. If a downward arrow appears during trading, the buy order is closed. After analyzing the situation in this case, you can open a sell position. It is
Clustering Trend is always in operation - after the first position, provided that the position is not closed with stops. You can test the bot on any part of the history, the bot is configured to pass the entire history, but if you need to increase productivity in a specific area, you can optimize the bot for more productive work, but in a shorter part of the history. The bot works without trailing stops, breakevens or anything like that. The principle of operation is that there is a signal, th
Toroid - The indicator reflects information in a visual form, it can be used both for pipsing on small periods and for long-term trading. It generates fairly frequent and accurate signals. The indicator can be used as the main one for determining the trend. The indicator can work both for entry points and as a filter. Uses two parameters for settings. The smart indicator algorithm detects the trend, filters out market noise and generates input signals. It is based on the signals of elementary in
Platoon is an indicator designed to be able to detect a bottom or top similar to the Fractals indicator, but of course a different algorithm is used. In other words, you should not enter into a buy deal if the fractal is below. And you should not enter into a sell deal if the fractal is higher. The indicator only denotes fractals on the chart without performing any additional calculations, therefore, theoretically, any trader can find these patterns by himself. But what is a fractal, how exact
Provided
Tatiana Savkevych
Provided is a trend trading Expert Advisor based on the simplest indicator strategy of following the market towards global price movements. The robot can effectively trade on almost any trading asset or currency pair, but subject to proper optimization. It is recommended to use the robot on the hourly chart of the Euro / Dollar currency pair. List of all settings: Magic - Magic number. StartVolume - Sets the lot size for entering the market. OnRisk - Activates Money Management. PercentRisk - A
フィルタ:
レビューなし
レビューに返信