Max Min Trend MT5
- インディケータ
- バージョン: 1.0
- アクティベーション: 5

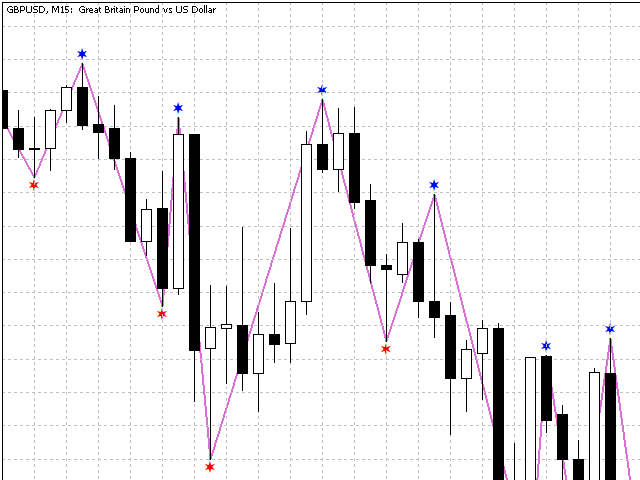
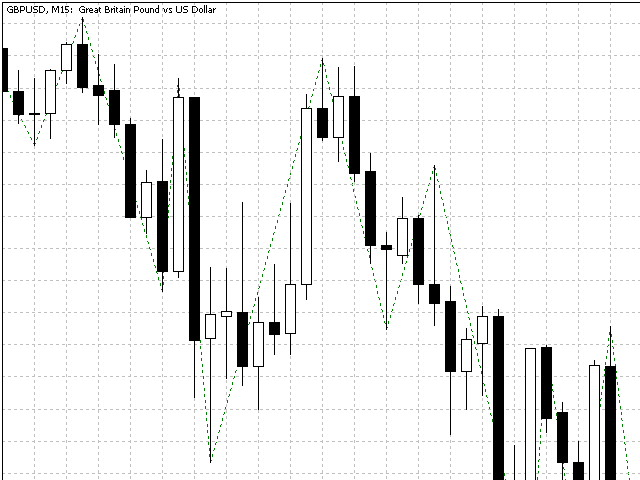
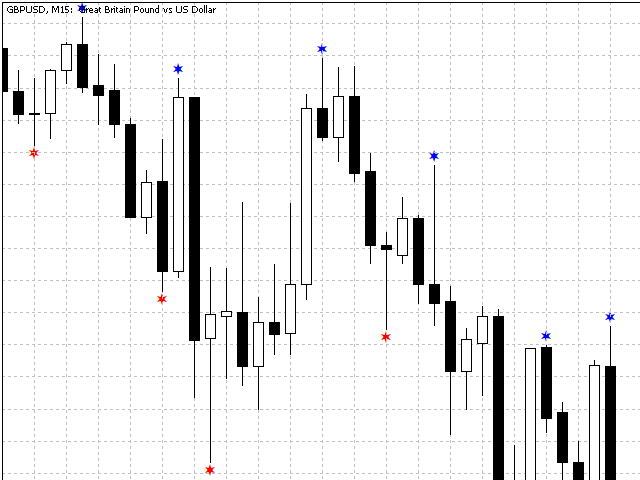
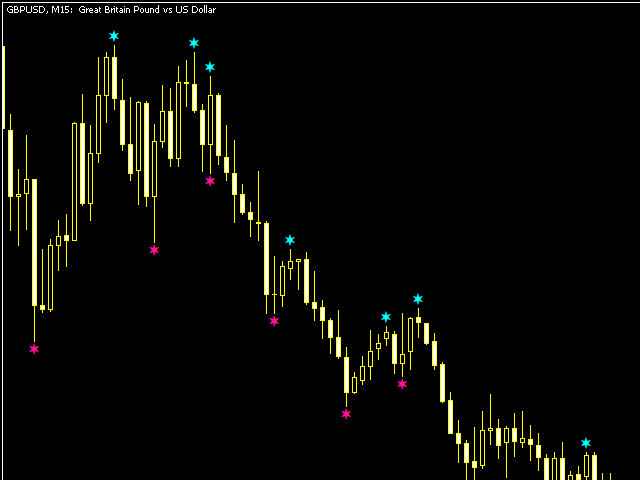
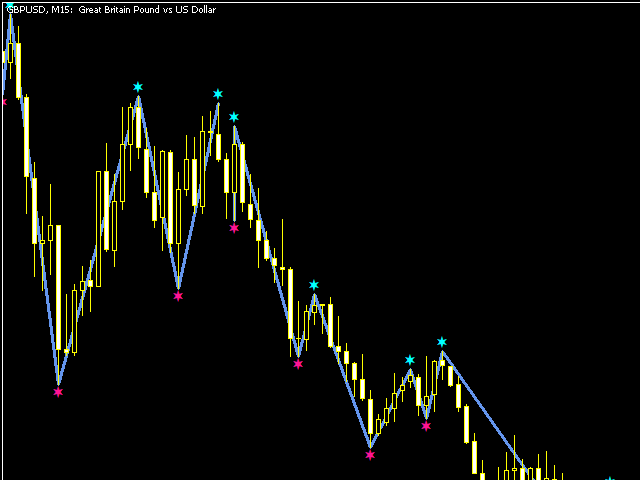
The MaxMinTrend indicator displays the highs and lows of the price on the chart. This indicator was created to simplify the determination of trend directions, as well as to support open positions, by transferring Stoploss to the current highs and lows of the price, thereby making a large profit. This indicator is not redrawn.
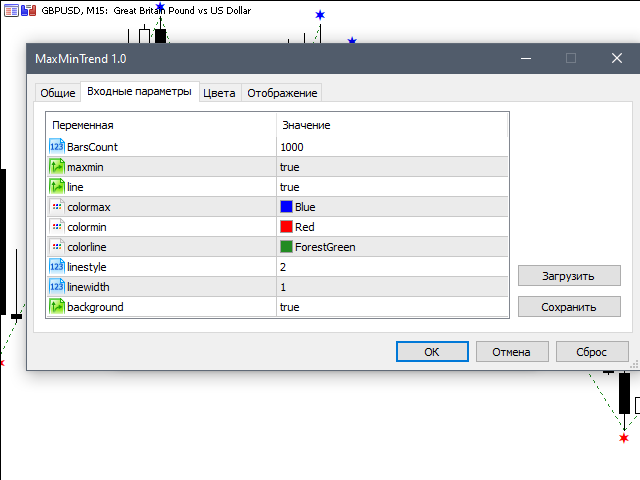
Input parameters:
BarsCount - 1000 - Number of bars to draw the indicator
maxmin - true - Enabled display of Highs and Lows
line - true - Enabled display of the connecting line
colormax - maximum color
colormin - the color of the minimum
colorline - line color
linestule - line style
background - true - display in the background