Breakout Wall

5


GIVE A LOOK TO MY

OTHER PRODUCTS !

100 % PER MONTH PROFIT----MY NEW SIGNAL HERE -------> https://www.mql5.com/en/signals/2162238?source=Site+Signals+My#

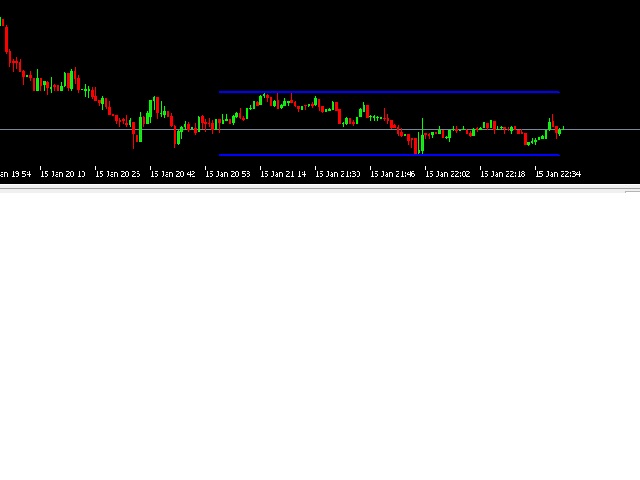
Breakout Wall is a very cool indicator.

It paints a resistance and a support in the chart given by a " " number of candles ( you can choose the parameter ),and give you an alert when a candle closes below a support or above a resistance.Very important tool if you trade daily candles for example.....

Just close your pc and don't stress in front of the charts!You can attach the indicator in every timeframe or pair you want.


Please,feel free to contact me for everything you need!

Happy Trading :)

レビュー 2
Maans Petter Erixon
332
Maans Petter Erixon 2021.02.12 14:33 
 

Good indicator and good support from the seller. I also love the sellers other indicator "Broken Trendline Alert" - very useful!

おすすめのプロダクト
Hello Traders I have created this indicator to Catch SPIKES on Crash1000, Crash500 and Crash300. Follow the below mention instruction for better Result 1. When Red arrow pop up on the Chart, Take a Sell entry 2. Stay in trade until price break below from entry 3. Do not hold trades after all trades went in Blue 4. Keep adding position until spike cross below from intial entry See Example for more assistance
Sigma Indicator is used by Sigma Expert advisor for plotting the zones but now its available for members to apply their stratagies on Sigma supply and demand levels. Instructions:  1- Donot Change time frames instead run several pairs with different time frames with sigma indicator 2- For exness : Search for smaller zone = True For other brokers keep it False 3- Maximum zone size = 0 4- Minimum zone size = 0  5 - Back candles = 300
TRI Visualizer Enhanced - 熱力学的市場分析の革命 概要 TRI(Thermal Range Indicator)Visualizer Enhanced は、従来のテクニカル分析を超越した、物理学の熱力学理論を応用した革新的なマーケット分析インジケーターです。市場の価格変動を「熱力学的エネルギー」として捉え、これまで見落とされていた市場の微細な変化を高精度で検出します。 革新的な仕組み 1. デュアル計算エンジン クラシックTRIモード 基本公式: |終値-始値| + (高値-安値) ローソク足の実体とヒゲを統合した純粋なボラティリティ測定 シンプルで直感的、あらゆる市場環境で安定動作 熱力学的TRIモード(独自開発) 価格加速度 :2次微分による価格変化の勢いを測定 出来高変化率 :相対的な出来高の変化を動的に評価 ポジションエネルギー :正規化された価格変動エネルギーを計算 熱力学的係数 :物理学の熱力学法則を市場分析に応用 2. 高度な平滑化システム SMA(単純移動平均) :基本的なノイズ除去 EMA(指数移動平均) :最新データ重視の平滑化
Wapv Price and volume
Eduardo Da Costa Custodio Santos
MT5のWAPV価格と出来高インジケーターは、(Wyckoff Academy Wave Market)および(Wyckoff Academy Price and Volume)ツールセットの一部です。 MT5のWAPV価格および出来高インジケーターは、チャート上の出来高の動きを直感的な方法で簡単に視覚化できるように作成されました。 それを使用すると、ピークボリュームの瞬間と市場が専門家の関心を持たない瞬間を観察することができます 「スマートマネー」の動きではなく、慣性によって市場が動いている瞬間を特定します。 ユーザーが変更できる4色で構成されています。 赤=オファーの増加 緑=需要の増加 灰色のキャンドル=需要と供給の減少 青=スマートマネー演技 上方向への動きは強さを示します。 下向きの動き弱さを示します。 価格の方向に関係なく、最強のボリュームが上がる必要があります。 R.Wyckoffの理論に基づいて作成されたインジケーター
MetaCOT 2 is a set of indicators and specialized utilities for the analysis of the U.S. Commodity Futures Trading Commission reports. Thanks to the reports issued by the Commission, it is possible to analyze the size and direction of the positions of the major market participants, which brings the long-term price prediction accuracy to a new higher-quality level, inaccessible to most traders. These indicators, related to the fundamental analysis, can also be used as an effective long-term filter
H4 Candles And OpenLine Sessions MT5 is a professional indicator for MetaTrader 5 that visualizes your trading sessions and key 4-hour candle ranges with clear, customizable boxes and stylish opening price lines. Highlight Asia , London , and New York market sessions plus up to 6 custom H4 candle ranges — each with fully adjustable colors, line styles, thickness, opacity, and labels. The powerful OpenLine feature marks the exact opening price for each session or H4 range, helping you instantly s
The volume profile indicator of the market + a smart oscillator. It works on almost all instruments-currency pairs, stocks, futures, cryptocurrency, on real volumes and on tick ones. You can set both the automatic definition of the profile range, for example, for a week or a month, etc., and set the range manually by moving the boundaries (two vertical lines red and blue). It is shown as a histogram. The width of the histogram at this level means, conditionally, the number of transactions condu
Improved version of the free HMA Trend indicator (for MetaTrader 4) with statistical analysis. HMA Trend is a trend indicator based on the Hull Moving Average (HMA) with two periods. HMA with a slow period identifies the trend, while HMA with a fast period determines the short-term movements and signals in the trend direction. The main differences from the free version: Ability to predict the probability of a trend reversal using analysis of history data. Plotting statistical charts for analyzi
Overview Supply & Demand (MTF) v1.00 is a MetaTrader 5 indicator that automatically identifies and draws key supply and demand zones from up to three timeframes on your current chart. Supply zones mark areas where selling pressure was strong; demand zones mark areas where buying pressure was strong. Features Multi-timeframe detection Scan the current chart plus two higher timeframes for zones. Candle-strength filter Require a configurable number of strong candles to confirm each zone. Adjust
FREE
Indicator Title: Supply and Demand Zones Short Description: This indicator for MetaTrader 5 automatically identifies and draws supply and demand zones on the price chart, providing key visual information for trading decisions. Based on the analysis of price action and candle structure, the indicator highlights areas where the price is likely to react. Detailed Description: The Supply and Demand Zones indicator analyzes price history to identify specific candlestick patterns that suggest the pres
The indicator, Big Candle Detect , is based on ATR and Volume to detect candlesticks of buying and selling strength, which is represented through an oscillator indicator. With this indicator you will be able to identify the lateral market, providing better entries according to your strategy. Big Candle Detect highlights candles with brighter colors when the condition is found, making it easier to identify, in addition to being fully compatible for automation in your EA. SETTINGS ATR Period
Unlock profitable buy setups with the DC Dynamic Scalping Indicator for Crash , purpose-built for consistent scalping and small account growth. This expertly crafted, non-repainting indicator detects optimal buy signals on Crash indices , ensuring you're in sync with the trend thanks to the built-in Dynamic Trend Filter . A clean blue background template is also included for seamless charting and visual clarity. Key Features: Trend-Based Signal Logic – The Dynamic Trend Filter ensures all b
Introduction = ユニバーサル トレンドライン ブレイクアウト MT5 = この MT5 インジケーターは、Meta Trader 5 用のプロフェッショナルなトレンドラインブレイクアウト戦略です。 市場構造を分析し、トレンドラインを自動検出し、確認されたブレイクアウトで BUY SELL シグナルを表示します。 主観的な判断を減らし、構造的な分析を支援します。 Why use this Tool - 手動トレンドラインの不一致を解消 - 構造に基づく BUY SELL シグナル - 終値確認による偽ブレイク回避 - トレンドとレンジの明確化 - 規律ある分析をサポート Key Features of this tool + 自動トレンドライン検出 + ブレイクアウト後の BUY SELL シグナル + クローズ足確認ロジック + 方向フィルター + リテスト確認オプション + 視覚的に分かりやすい表示 + 非再描画ロジック + 多市場対応 How use this Tool - Meta Trader 5 に適用 - 自動検出を有効化 - 確認された BUY SE
DYJ BoS インジケーターは、次のような市場構造の変化の主な要素を自動的に識別してマークします。 構造のブレイクアウト (BoS): 価格が大きく変動し、構造の前のポイントを突破したときに発生します。 彼は上昇トレンドと下降トレンドの可能性のあるライン(UP と DN、つまり連続した新高値と新安値)をマークし、価格がこれらのラインを突破すると、赤(弱気)と緑(強気)の矢印でマークします。 BoS は通常、価格が以前の価格変動によって確立されたスイング安値または高値を決定的に突破したときに発生します。価格がスイング高値を上回ったりスイング安値を下回ったりすると、単に以前に形成された市場構造から抜け出すだけなので、「ブレイクアウト」構造と呼ばれます。これは多くの場合、市場センチメントとトレンドの方向の変化を示し、既存のトレンドの継続または新しいトレンドの始まりを示唆します。 ポジションのクローズの精度を高めるために、通常はストップロスとテイクプロフィットを設定しないことが推奨されます。最終ポジションは通常、同じ方向の次のブレイクスルー ポイント、または反対方向のブレイクスルー
Weis Wave Scouterは、MetaTrader 5向けに開発された革新的なインジケーターであり、WyckoffメソッドとVSA(Volume Spread Analysis)の確立された原則を組み合わせています。精度と深みを求めるトレーダー向けに設計され、累積ボリューム波の分析を通じて市場を戦略的に読み取り、トレンドの反転ポイントや継続ポイントを特定する支援を行います。 Weis Wave Scouterは、クラシック、ナイトビジョン、オーシャンブリーズといったカスタマイズ可能なカラーテーマで、上昇波と下降波を色分けしたヒストグラムで明瞭に表示します。主な機能には、ボリュームピークの検出、低アクティビティゾーン(DeadZone)の識別、およびボリュームベースの波の反転に関するカスタマイズ可能なアラートが含まれます。また、エフォート対リザルト分析、因果関係、需給バランスといったWyckoffおよびVSA理論の基本概念をサポートしています。Brick Size、Volume Scale Factor、Pivot Lookbackといったパラメータで柔軟に調整でき、あらゆるスタ
Introduction The Wave Trend Oscillator Indicator for MT5 is one of the well known indicators in the market, helping traders find strong entry points into the market. Like any other MetaTrader 5 indicator , it can produce both good and bad signals, but the number of accurate buy/sell signals is significantly higher than the weak ones. This makes it a powerful tool for improving your forex trading strategy , whether you are a beginner or an advanced trader. How does this indicator work? This indic
Volume Delta Candles: A Comprehensive Tool for In-Depth Trading Analysis Unlock a seamless way to interpret trading experience within each candle. With Volume Delta Candles, there's no need for additional volume indicators—everything you need is built in. This advanced tool utilizes lower timeframes or live market data to present the percentage of buying versus selling volume within each candle as an intuitive color-coded bar. Before diving in, ensure you’re familiar with Volume and Volume Delta
Visual Titan Force Indicator
AL MOOSAWI ABDULLAH JAFFER BAQER
Unleash Market Volatility with the Titan Force Indicator! Are you ready to dominate the market by capitalizing on volatility? The Titan Force Indicator is your ultimate trading tool, designed for traders who thrive during periods of heightened market activity. Not Optimized for You – Yet! This indicator is a canvas for your creativity. It's been crafted to let you optimize it according to your unique trading strategies and preferences. Your skills, your edge! How Does the Titan Force Indicator
Heikin Ashi candlesticks are a powerful tool for traders, offering a clear and smooth visualization of market trends. Unlike traditional candlesticks, they filter out market noise, providing a cleaner view of the market's direction and strength, which helps traders make more informed decisions. The Hull Heikin Ashi Smoothed indicator from Minions Labs takes this a step further by integrating the Hull Moving Average for enhanced smoothing and precision. This indicator not only simplifies trend id
Eabotpro Signals v3.0 A professional MetaTrader 5 indicator designed to deliver high-precision trading signals with real-time notifications, trade management tools, and a clean interface. "Recommended Base time frame is 4H Fibo From input . and trade time frame 1 mint , and 5 mint " Key Features: High-Accuracy Signals : Optimized for precision and consistency across different market conditions. Smart Trade Panel : Displays entry price, targets, stop levels, performance stats, and profit trackin
MetaCOT 2 is a set of indicators and specialized utilities for the analysis of the U.S. Commodity Futures Trading Commission reports. Thanks to the reports issued by the Commission, it is possible to analyze the size and direction of the positions of the major market participants, which brings the long-term price prediction accuracy to a new higher-quality level, inaccessible to most traders. These indicators, related to the fundamental analysis, can also be used as an effective long-term filter
Was: $249  Now: $99   Market Profile defines a number of day types that can help the trader to determine market behaviour. A key feature is the Value Area, representing the range of price action where 70% of trading took place. Understanding the Value Area can give traders valuable insight into market direction and establish the higher odds trade. It is an excellent addition to any system you may be using. Inspired by Jim Dalton’s book “Mind Over Markets”, this indicator is designed to suit the
The Market Structure Analyzer is a powerful tool designed for traders who follow market structure and smart money concepts. This comprehensive indicator provides a suite of features to assist in identifying key market levels, potential entry points, and areas of liquidity. Here's what it offers: 1. Swing High/Low Detection : Accurately identifies and marks swing highs and lows, providing a clear view of market structure. 2. Dynamic Supply and Demand Zones: Draws precise supply and demand zone
Provided Trend is a complex signal formation indicator. As a result of the work of internal algorithms, you can see only three types of signals on your chart. The first is a buy signal, the second is a sell signal, and the third is a market exit signal. Options: CalcFlatSlow - The first parameter that controls the main function of splitting the price chart into waves. CalcFlatFast - The second parameter that controls the main function of splitting the price chart into waves. CalcFlatAvg - Para
Wolfe Wavesは、すべての金融市場に存在する自然に発生する取引パターンであり、均衡価格への戦いを表しています。これらのパターンは、短期および長期の時間枠で発生する可能性があり、現在の最も信頼性の高い予測反転パターンの1つであり、通常は強い長期の価格変動に先行します。 [ インストールガイド | 更新ガイド | トラブルシューティング | よくある質問 | すべての製品 ] クリアな取引シグナル 驚くほど簡単に取引できます カスタマイズ可能な色とサイズ パフォーマンス統計を実装します 適切なストップロスおよび利益レベルを表示します 電子メール/音声/視覚アラートを実装します インジケーターはパターンとブレイクアウト矢印を同時に描画し、インジケーターが展開するときにパターンが再描画されないようにします。ただし、エントリのブレイクアウトが何度も発生し、インジケータが再描画される場合、あまり頻繁にではなく控えめに再描画される可能性があります。インジケータは非バックペインティングです。 オオカミの定義 ウルフ波には、次の特性が必要です。 ( 例を見るにはここをクリック ) ウェーブ
Antabod StochasticMt5
Rev Anthony Olusegun Aboderin
How Antabod Stochastic Works Antabod Stochastic is a cutting-edge technical indicator designed to analyze market momentum and identify overbought and oversold conditions with unparalleled precision. Here's a breakdown of how it works and what makes it a game-changer for traders: ________________________________________ 1. Core Concept At its heart, Antabod Stochastic is based on the stochastic oscillator principle, which measures the position of a current price relative to its range over a spec
1. What is this         Rising volatility and falling volatility are not the same, whether it is academic research or actual testing has shown this point.         The original ATR indicator is calculated by putting up and down fluctuations together. This indicator is to calculate separately the upward volatility and the downward volatility, which can better help you study the market. 2. Indicator description          There are two modes for the calculation of this indicator, as shown in the fo
「上位足のトレンド方向を確認したいけど、いちいちチャートの時間足を切り替えるの、面倒だな~」 そんなあなたのために、この商品が存在します!! Trend Map - 商品概要 各時間足(あるいは各フラクタル構造)において、トレンド方向を記録して常にチャート上に表示しておけるツールです。時間足を変更してもパネルの表示はそのままなので、こまめに時間足を変更しながらチャートを見る方にオススメです。トレードする際に素早くトレンド方向を確認できるので、ノンストレスでトレードを行うことが可能になります。また、各時間足(フラクタル構造)での高安値を認識するためのラインをワンボタンで生成・削除することができます。自動売買の機能はないため、トレード補助のツールとしてお使いください。 - 機能説明 ①パネルユニット パネルUI全体のうち、縦一列分を指します。最大10個まで表示可能です。パネルユニットごとにテーマカラーを設定できます。 ②説明ラベル パネルユニットの一番上のラベルです。時間足の表示など好きなテキストを設定できます。また、設定から表示をOFFにすることもできます。 ③矢印
Daily Trend Lines Pro
Danton Dos Santos Sardinha Junior
Technical Description Daily Trend Lines Pro is an advanced indicator developed in MQL5, designed to provide accurate insights into the market’s daily movements. Based on the moving average calculated from the first candle of each day, the indicator plots a daily trend line that resets at the start of each new day, ensuring visual clarity and clearly delineating trading sessions. Main Features: Dynamic and Accurate Calculation: The daily line is derived from the moving average value computed fr
FREE
# ** Multi-Timeframe Fibonacci Levels Pro** ** Transform Your Trading with Institutional-Grade Fibonacci Analysis ** Multi-Timeframe Fibonacci Levels Pro is a revolutionary MetaTrader 5 indicator designed for day traders and scalpers. It automatically calculates and displays Fibonacci retracement levels from multiple higher timeframes directly on your 1-5 minute charts, giving you complete market structure visibility without switching between timeframes. --- ## ** Key Features** *
このプロダクトを購入した人は以下も購入しています
このインジケーターを購入すると、プロ仕様のトレードマネージャーを無料で差し上げます。 まず第一に、このトレーディングシステムがノンリペイント、ノンリドロー、ノンラグのインジケーターであることを強調する価値がある。これにより、手動取引とロボット取引の両方に理想的なものになっています。 オンラインコース、マニュアル、プリセットのダウンロード。 「スマートトレンドトレーディングシステム MT5」は、新規および経験豊富なトレーダー向けにカスタマイズされた包括的なトレーディングソリューションです。10以上のプレミアムインジケーターを組み合わせ、7つ以上の堅実なトレーディング戦略を備えており、多様な市場状況に対応する多目的な選択肢となっています。 トレンドフォロー戦略:トレンドを効果的に乗り越えるための正確なエントリーとストップロス管理を提供します。 リバーサル戦略:潜在的なトレンドの反転を特定し、トレーダーがレンジ相場を活用できるようにします。 スキャルピング戦略:高速で正確なデイトレードおよび短期取引のために設計されています。 安定性:すべてのインジケーターはノンリペイント、ノンリドロー、ノ
Power Candles – あらゆる市場に対応した強度ベースのエントリーシグナル Power Candles は、Stein Investments が長年培ってきた強度分析を価格チャート上に直接反映します。価格だけに反応するのではなく、各ローソク足は実際の市場の強さに基づいて色分けされ、モメンタムの蓄積、強度の加速、明確なトレンド転換を瞬時に把握できます。 すべての市場に共通する単一ロジック Power Candles は すべての取引シンボル で自動的に動作します。現在のシンボルが Forex か非 Forex 市場かを自動判別し、内部で適切な強度モデルを適用します。 Forex および Gold :FX Power のデルタ値を使用(絶対値レンジ最大 100) 指数、暗号資産、CFD :IX Power の強度値を使用(絶対値レンジ最大 50) 必要な強度計算は Power Candles に直接組み込まれています。ローソク足のカラーリングやシグナルロジックに、追加のインジケーターは不要です。 価格ノイズではなく「強度状態」 各ローソク足は、以下の 9 つの明確に定義された強
このインジケーターを購入された方には、以下の特典を 無料 で提供しています: 各トレードを自動で管理し、ストップロスとテイクプロフィットを設定し、戦略ルールに基づいてポジションを決済する補助ツール 「Bomber Utility」 様々な銘柄に合わせたインジケーターの設定ファイル(セットファイル) 「最小リスク」、「バランスリスク」、「待機戦略」 の3つのモードで使用できる Bomber Utility 用の設定ファイル このトレーディング戦略をすぐに導入・設定・開始できる ステップバイステップのビデオマニュアル ご注意: 上記の特典を受け取るには、MQL5のプライベートメッセージシステムを通じて販売者にご連絡ください。 オリジナルのカスタムインジケーター 「Divergence Bomber(ダイバージェンス・ボンバー)」 をご紹介します。これは、MACDのダイバージェンス(乖離)戦略に基づいた 「オールインワン」型のトレーディングシステム です。 このテクニカルインジケーターの主な目的は、価格とMACDインジケーターの間に発生するダイバージェンスを検出 し、将来の価格の動きを示す
Entry In The Zone and SMC Multi Timeframe は、Smart Money Concepts(SMC)に基づいて開発された リアルタイム市場分析ツール です。 本システムは、トレーダーがマーケットストラクチャーを体系的に分析し、市場全体の方向性をより明確に把握できるよう設計されています。 システムは複数の時間軸にわたり、 反転ポイント(Reversal Points)・主要ゾーン(Key Zones)・マーケットストラクチャー を自動的に解析します。さらに、 POI(Point of Interest)・ノーリペイントシグナル・Auto Fibonacci Levels を表示し、プルバックや反転ポイントを高精度で検出します。 リアルタイムシグナルとアラートにより、価格が主要ゾーンに到達したときや、ゾーン内で反転シグナルが発生した際に、重要な機会を逃すことはありません。 また、本システムは インジケーター と シグナルシステム の両方の機能を兼ね備えた 2-in-1ツール であり、ゾーン分析とリアルタイムエントリーシグナルを一体化しています。 さらに
ARICoin is a powerful trading companion designed to generate high-probability entry signals with dynamic TP/SL/DP levels based on volatility. Built-in performance tracking shows win/loss stats, PP1/PP2 hits, and success rates all updated live. Key Features: Buy/Sell signals with adaptive volatility bands Real-time TP/SL/DP levels based on ATR Built-in MA Filter with optional ATR/StdDev volatility Performance stats panel (Success, Profit/Loss, PP1/PP2) Alerts via popup, sound, push, or email Cust
まず第一に、この取引インジケーターは再描画されず、再描画されず、遅延しないことを強調する価値があります。これにより、手動取引とロボット取引の両方に理想的なものになります。 ユーザーマニュアル:設定、入力、戦略。 アトミックアナリストは、価格の強さとモメンタムを利用して市場でより良いエッジを見つけるためのPA価格アクションインジケーターです。ノイズや誤ったシグナルを除去し、取引ポテンシャルを高めるための高度なフィルターを備えています。複雑なインジケーターの複数のレイヤーを使用して、アトミックアナリストはチャートをスキャンし、複雑な数学的計算をシンプルなシグナルと色に変換します。これにより、どのような初心者トレーダーでも理解して使用し、一貫した取引の決定を行うことができます。 「アトミックアナリスト」は、新規および経験豊富なトレーダー向けにカスタマイズされた包括的な取引ソリューションです。プレミアムインジケーターとトップノッチの機能を1つの取引戦略に組み合わせ、すべてのタイプのトレーダーにとって汎用性のある選択肢にします。 デイリートレーディングとスキャルピング戦略:高速で正確なデイ
AriX
Temirlan Kdyrkhan
1 (4)
AriX Indicator for MT5 A powerful trend-following and signal-evaluation tool AriX is a custom MT5 indicator that combines Moving Averages and ATR-based risk/reward logic to generate clear buy/sell signals. It visualizes dynamic SL/TP levels, evaluates past trade outcomes, and displays win/loss statistics in a clean on-chart panel. Key features include: Buy/Sell signals based on MA crossovers ATR-based SL/TP1/TP2/TP3 levels with visual lines and labels Signal outcome tracking with real-time stat
Azimuth Pro
Ottaviano De Cicco
5 (1)
発売プロモーション Azimuth Proは先着100名様限定で 299ドル でご提供します。最終価格は 499ドル となります。 リテールとインスティテューショナルのエントリーの違いはインジケーターではなく、ロケーションにあります。 多くのトレーダーは、モメンタムを追いかけたり、遅行シグナルに反応して、任意の価格レベルでエントリーします。機関投資家は、需給が実際にシフトする構造的なレベルに価格が到達するのを待ちます。 Azimuth Proはこれらのレベルを自動的にマッピングします:スイングアンカーVWAP、マルチタイムフレーム構造ライン、高確率ロケーションにのみ出現するABCパターン。 Azimuth Proは、構造分析とインテリジェントな自動化の両方を求めるプロフェッショナルトレーダー向けに構築されています。 Azimuthが外科的精度で市場構造をマッピングする一方、Azimuth Proはインテリジェンスレイヤーを追加します:トレーディングスタイルの自動検出、スマート設定された移動平均線、20年のデータでバックテストされた最適化パラメータ。その結果、お使いの銘柄と
ARIScalp is a powerful trading companion designed to generate high-probability entry signals with dynamic TP/SL/DP levels based on volatility. Built-in performance tracking shows win/loss stats, PP1/PP2 hits, and success rates all updated live. Key Features: Buy/Sell signals with adaptive volatility bands Real-time TP/SL/DP levels based on ATR Built-in MA Filter with optional ATR/StdDev volatility Performance stats panel (Success, Profit/Loss, PP1/PP2) Alerts via popup, sound, push, or email Cus
Gold Sniper Scalper Proは、MetaTrader 5向けのプロフェッショナルなindicatorで、トレーダーがエントリーポイントを特定し、リスクを効果的に管理するために設計されています。 このindicatorは、シグナル検出システム、Entry/SL/TPの自動管理、ボリューム分析、リアルタイムパフォーマンス統計を含む包括的な分析ツールセットを提供します。 システムを理解するためのユーザーガイド   |   他の言語のユーザーガイド 主な機能 シグナル検出システム このindicatorは、price actionと市場構造の分析に基づいて潜在的なエントリーポイントを自動検出します。トレード機会を検出すると: - BUY(青)またはSELL(赤)の矢印がchart上に表示されます - ローソク足が色付けされ、シグナルゾーンが識別されます - Entry/SL/TPレベルが自動計算されます シグナルは価格がEntryレベルに触れた時のみ発動し、市場に確認されていないシグナルをフィルタリングします。 インテリジェントなEntry/SL/TP管理 - Ent
FX Power: 通貨の強弱を分析して、より賢い取引を実現 概要 FX Power は主要通貨と金の実際の強弱をあらゆる市場状況で理解するための必須ツールです。強い通貨を買い、弱い通貨を売ることで、 FX Power は取引の意思決定を簡素化し、高い確率の取引機会を見出します。トレンドを追従する場合でも、極端なデルタ値を使用して反転を予測する場合でも、このツールはあなたの取引スタイルに完全に適応します。ただ取引するだけではなく、 FX Power で賢く取引をしましょう。 1. なぜ FX Power がトレーダーにとって非常に有益なのか 通貨と金のリアルタイム強弱分析 • FX Power は主要通貨と金の相対的な強弱を計算し、マーケットダイナミクスに関する明確な洞察を提供します。 • どの資産がリードしているか、または後れを取っているかを監視して、取引するペアを賢く選びましょう。 マルチタイムフレームの包括的なビュー • 短期、中期、長期のタイムフレームで通貨と金の強弱を追跡し、マーケットトレンドに基づいて取引戦略を調整できます。 • スキャルピングからスイングトレード
Smart Stop Indicator – チャート上で実現するインテリジェントなストップロス精度 概要 Smart Stop Indicator は、ストップロスを勘や感情ではなく、明確で体系的に設定したいトレーダーのために設計されています。本ツールは、クラシックなプライスアクション(高値更新・安値切り下げ)と最新のブレイクアウト認識ロジックを組み合わせ、次に来るべき論理的なストップレベルを正確に特定します。トレンド相場、レンジ、急速なブレイクアウト局面のいずれであっても、最適な SL ゾーンとその状態(“new”、“broken”、“valid”)をチャート上に直接表示します。さらに今回、SL 距離の %ADR 表示も新たに追加されています。 主な特徴 マーケット構造に基づく自動ストップ配置 • 市場構造とリアルタイムの値動きに基づき、意味のあるストップロスレベルを自動検出します。 スマートなブレイクアウト感知 • 急激な方向転換やブレイクアウトにも柔軟に対応し、早すぎるストップ調整を避けます。 SL %ADR の表示 • ストップロスまでの距離を ADR(Averag
Game Changerは、あらゆる金融商品で使用できる革新的なトレンドインジケーターです。メタトレーダーを強力なトレンドアナライザーへと変貌させます。このインジケーターは再描画や遅延がありません。あらゆる時間枠で動作し、トレンドの特定、反転の可能性のシグナル、トレーリングストップ機能、そして迅速な市場反応のためのリアルタイムアラートを提供します。経験豊富なプロ、あるいは優位性を求める初心者の方でも、このツールは自信と規律を持ち、トレンドの根底にあるダイナミクスを明確に理解した上で取引を行うための力となります。 購入後すぐにご連絡いただくと、個人ボーナスを進呈いたします!強力なサポートとトレンドスキャナーインジケーターの無料コピーもご用意しておりますので、お気軽にプライベートメッセージでご連絡くださ. 私のEAやスペシャルセットはTelegramでは販売しておりません。Mql5のみで販売しており、セットファイルはこちらのブログでのみ公開し ております 。詐欺師にはご注意ください。他の方からセットを購入しないでください。 設定 トレンド変化時のアラートを有効にする - True/Fals
トレンド スクリーナー インジケーターでトレンド取引の力を解き放ちます。ファジー ロジックと複数通貨システムを活用した究極のトレンド取引ソリューションです。 ファジー ロジックを活用した革新的なトレンド インジケーターである Trend Screener を使用して、トレンド取引を向上させます。 これは、13 を超えるプレミアム ツールと機能、および 3 つの取引戦略を組み合わせた強力なトレンド追跡インジケーターであり、Metatrader をトレンド アナライザーにする多用途の選択肢となります。 期間限定オファー : トレンド スクリーナー インジケーターは、わずか 100 ドルで生涯ご利用いただけます。 (元の価格 50$ ) (オファー延長) Trend Screener の 100% 非再描画精度の揺るぎない精度を体験して、取引の決定が過去の価格変動の影響を受けないようにしてください。 マルチタイムフレームおよびマルチ通貨機能の多用途性を解放し、比類のない自信を持って外国為替、商品、暗号通貨、インデックスの世界を取引できるようにします。 Trend Screener の包括的な
FX Levels: あらゆる市場における非常に高精度なサポート&レジスタンス 概要 通貨ペア、株式指数、個別銘柄やコモディティなど、どのような市場でも信頼できるサポートとレジスタンスを特定したいですか? FX Levels は伝統的な “Lighthouse” メソッドと先進的な動的アプローチを融合し、ほぼ汎用的な精度を実現します。ブローカーの実務経験を活かし、自動化されたデイリー更新とリアルタイム更新を組み合わせることで、 FX Levels は反転ポイントを見つけ、利益目標を設定し、自信をもってトレードを管理するための手助けをします。今すぐ試してみて、サポート/レジスタンス分析の正確性がどれほどトレードを向上させるかを実感してください! 1. FX Levels がトレーダーにとって非常に有用な理由 非常に正確なサポート&レジスタンスゾーン • FX Levels は異なるブローカー環境でもほぼ同一のゾーンを生成するよう設計されており、データフィードの差異や時刻設定のずれによる不一致を解消します。 • つまり、どのブローカーを利用していても一貫したレベルが得られるため、戦
- Real price is 80$ - 45% Discount (It is 45$ now) Contact me for extra bonus   indicator, instruction or any questions! - Lifetime update free - Non-repaint - Related product: Gann Gold EA - I just sell my products in Elif Kaya Profile, any other websites are stolen old versions, So no any new updates or support. Advantages of  M1 Scalper Pro  Profitability: M1 Scalper Pro is highly profitable with a strict exit strategy. Frequent Opportunities: M1 Scalper Pro  takes advantage of numerous smal
Trend Ai indicatorは、トレンドの識別と実用的なエントリポイントと反転アラートを組み合わせることで、トレーダーの市場分析を強化する優れたツールです。 この指標は、ユーザーが自信と正確さで外国為替市場の複雑さをナビゲートすることを可能にします トレンドAiインジケーターは、主要なシグナル以外にも、プルバックやリトレースメント中に発生するセカンダリエントリポイントを識別し、トレーダーが確立されたトレンド内の価格修正を活用できるようにします。 重要な利点: *MT4およびMT5の仕事 *明確な買いまたは売りシグナル *再描画しません ·すべての資産で動作します 私はeaやセットをtelegram it詐欺で販売しないように注意してください。 すべての設定はここでブログで無料です。  重要! 指示とボーナスを得るために購入後すぐに私に連絡してください! 私の他のプロダクトと同様、実質操作の監視はここに見つけることができます: https://www.mql5.com/en/users/mechanic/seller&nbsp ; 設定および入力: すべての
IX Power MT5
Daniel Stein
4.92 (12)
IX Power: 指数、商品、暗号資産、外国為替市場の洞察を発見 概要 IX Power は、指数、商品、暗号資産、外国為替市場の強弱を分析するための多用途ツールです。 FX Power が全ての利用可能な通貨ペアデータを活用して外為ペアで最高の精度を提供する一方、 IX Power は基礎資産の市場データにのみ焦点を当てています。この特性により、 IX Power は非外為市場に最適であり、単純な外為分析にも信頼性の高いツールです。どのチャートでもスムーズに機能し、取引判断を向上させるための明確で実行可能な洞察を提供します。 1. IX Power がトレーダーにとって価値がある理由 複数市場での強弱分析 • IX Power は指数、商品、暗号資産、外為シンボルの強弱を計算し、それぞれの市場に合わせた洞察を提供します。 • US30、WTI、ゴールド、ビットコイン、または通貨ペアなどの資産を監視して取引機会を発見できます。 幅広い市場に適応 • 外為取引では、 FX Power が関連する全ての通貨ペアを分析することで比類のない精度を提供します。 • IX Power
Berma Bands
Muhammad Elbermawi
5 (7)
Berma Bands (BBs) インジケーターは、市場のトレンドを特定して活用したいトレーダーにとって貴重なツールです。価格と BBs の関係を分析することで、トレーダーは市場がトレンド段階にあるか、レンジ段階にあるかを判断できます。 詳細については、[ Berma Home Blog ] をご覧ください。 バーマ バンドは、上部バーマ バンド、中部バーマ バンド、下部バーマ バンドの 3 つの異なる線で構成されています。これらの線は価格の周りにプロットされ、全体的な傾向に対する価格の動きを視覚的に表します。これらのバンド間の距離から、ボラティリティや潜在的な傾向の反転についての洞察を得ることができます。 バーマ バンドの線がそれぞれ離れると、市場が横ばいまたはレンジ相場の期間に入っていることを示すことがよくあります。これは、明確な方向性の偏りがないことを示しています。トレーダーは、これらの期間中にトレンドを特定するのが難しいと感じる可能性があり、より明確なトレンドが出現するまで待つ場合があります。 バーマ バンドの線が 1 本の線に収束すると、強いトレンド環境の兆候となること
Quantum TrendPulse を ご紹介します。これは、   SuperTrend   、   RSI   、および Stochastic のパワーを 1 つの包括的なインジケーターに組み合わせて、取引の可能性を最大限に引き出す究極の取引ツールです。精度と効率を求めるトレーダー向けに設計されたこのインジケーターは、市場のトレンド、勢いの変化、最適なエントリー ポイントとエグジット ポイントを自信を持って特定するのに役立ちます。 主な特徴: SuperTrend 統合: 現在の市場動向に簡単に追従し、収益性の波に乗ることができます。 RSI精度: 買われすぎと売られすぎのレベルを検出し、市場の反転のタイミングに最適で、SuperTrendのフィルターとして使用されます。 確率的精度: 確率的振動を活用して、変動の激しい市場で隠れたチャンスを見つけます。SuperTrend のフィルターとして使用されます。 マルチタイムフレーム分析:   M5 から H1 または H4 まで、さまざまなタイムフレームで市場を常に把握します。 カスタマイズ可能なアラート: カスタム取引条件が満たされ
優れたテクニカルインジケーター「Grabber」をご紹介します。これは、すぐに使える「オールインワン」トレーディング戦略として機能します。 ひとつのコードに、市場のテクニカル分析ツール、取引シグナル(矢印)、アラート機能、プッシュ通知が強力に統合されています。 このインジケーターを購入された方には、以下の特典を無料で提供します: Grabberユーティリティ:オープンポジションを自動で管理するツール ステップバイステップのビデオマニュアル:インジケーターのインストール、設定、取引方法を解説 カスタムセットファイル:インジケーターをすばやく自動設定し、最大限の成果を出すための設定ファイル 他の戦略はもう忘れてください!Grabberだけが、あなたを新たなトレードの高みへと導いてくれるのです。 Grabber戦略の主な特徴: 推奨タイムフレーム:M5〜H4 対応通貨ペア・資産:どれでも使用可能ですが、私が実際に検証した以下を推奨します(GBPUSD、GBPCAD、GBPCHF、AUDCAD、AUDUSD、AUDSGD、AUDCHF、NZDUSD、NZDCAD、EURCAD、EURUSD、E
サポート線と抵抗線のプロットにうんざりしていませんか? サポートレジスタンス は、非常に興味深いひねりを加えてチャート内のサポートとレジスタンスラインを自動検出およびプロットするマルチタイムフレームインジケーターです。価格レベルは時間とともにテストされ、その重要性が高まるにつれて、ラインは太くなり、暗くなります。 [ インストールガイド | 更新ガイド | トラブルシューティング | よくある質問 | すべての製品 ] 一晩でテクニカル分析を強化 チャートを閲覧せずに重要な価格レベルを検出 一目ですべての価格レベルの相対的な強さを認識する すべての取引で最大30時間のプロットラインを節約 インジケーターは、すべての価格レベルの年齢を表示します インジケーターは再描画されていません 過去および現在の価格レベルは近接によって崩壊し、現在の市場行動に合わせて調整されます。動作は、必ずしもピークではない場所に線が引かれます。 価格レベルは、時間とともに拒否されるにつれて、より暗く、より広くなります ノイズを避けるために、重要でない価格レベルは定期的にクリアされます カスタマイズ可能な時間枠の
TrendLine PRO MT5
Evgenii Aksenov
4.67 (33)
The Trend Line PRO indicator is an independent trading strategy. It shows the trend change, the entry point to the transaction, as well as automatically calculates three levels of Take Profit and Stop Loss protection. Trend Line PRO is perfect for all Meta Trader symbols: currencies, metals, cryptocurrencies, stocks and indices. The indicator is used in trading on real accounts, which confirms the reliability of the strategy. Robots using   Trend Line PRO   and real Signals can be found here: 
ARIPoint
Temirlan Kdyrkhan
1 (1)
ARIPoint is a powerful trading companion designed to generate high-probability entry signals with dynamic TP/SL/DP levels based on volatility. Built-in performance tracking shows win/loss stats, PP1/PP2 hits, and success rates all updated live. Key Features: Buy/Sell signals with adaptive volatility bands Real-time TP/SL/DP levels based on ATR Built-in MA Filter with optional ATR/StdDev volatility Performance stats panel (Success, Profit/Loss, PP1/PP2) Alerts via popup, sound, push, or email Cu
これまでに、 素晴らしいバックテスト結果、 驚くべき数値を持つ ライブ口座のパフォーマンス証明 、そして あらゆる場所での統計情報 がある取引インジケーターを購入し、しかし使用後に 口座を破綻させてしまった ことは何度ありますか? シグナル単独を信用すべきではありません。そもそもなぜそれが表示されたのかを知る必要があります。そして、それこそがRelicusRoad Proの得意とすることです! ユーザーマニュアル + 戦略 + トレーニングビデオ + VIPアクセス付きプライベートグループ + モバイル版利用可能 市場の見方を変える新しい方法 RelicusRoadは、FX、先物、仮想通貨、株式、指数に対応する、 世界で最も強力で最高の取引インジケーター であり、トレーダーが口座を 成長させる ために必要なすべての情報とツールを提供します。 初心者 から 上級者 まで、 すべてのトレーダー が成功できるよう、 テクニカル分析 と 取引計画 を提供します。 これは、将来の市場を 予測する のに十分な情報を提供する 主要な取引インジケーター です。私たちは、チャート上で意味をなさない複
Gartley Hunter Multi - An indicator for searching for harmonic patterns simultaneously on dozens of trading instruments and on all possible timeframes. Manual (Be sure to read before purchasing) | Version for MT4 Advantages 1. Patterns: Gartley, Butterfly, Shark, Crab. Bat, Alternate Bat, Deep Crab, Cypher 2. Simultaneous search for patterns on dozens of trading instruments and on all possible timeframes 3. Search for patterns of all possible sizes. From the smallest to the largest 4. All fou
Weis Wave with Alert MT5
Trade The Volume Waves Single Member P.C.
4.94 (17)
Rental/Lifetime Package Options and Privileges  Rent Monthly Six Months   Yearly/Lifetime Weis Wave with Speed with Alert+Speed Index x x x Manual  x x x Quick Set up Video x x x Blog x x x Lifetime Updates x x x Setup and Training Material x x Discord Access Channel "The SI traders"          x Rectangle Break Alert Tool      x How to trade with it:    http://www.tradethevolumewaves.com   ** If you purchase please contact me to setup your  : Training Room and  complete manual access.  Wei
SuperScalp Pro — 高度なマルチフィルター対応スキャルピングインジケーターシステム SuperScalp Pro は、クラシックな Supertrend と複数のインテリジェントな確認フィルターを組み合わせた高度なスキャルピング用インジケーターシステムです。M1〜H4 のすべての時間足で効率的に機能し、特に XAUUSD、BTCUSD、および主要なFX通貨ペアに適しています。単体のシステムとして、また既存の取引戦略へ柔軟に統合して使用できます。 本インジケーターは 11 以上のフィルターを統合しており、短期・長期の EMA、トレンド判定に用いる 3 本の EMA、EMA スロープ(EMA slope)、RSI、ADX、出来高、VWAP、ボリンジャーバンドのブレイクアウト、MACD ダイバージェンスフィルターなどを含みます。スマートキャンドルフィルターはローソク足の終値を確認して弱いシグナルを排除し、3 本の EMA と MACD ダイバージェンスを組み合わせたトレンド認識メカニズムにより勝率の高いシグナルの選別を支援します。 SuperScalp Pro は ATR に基
WARNING: This indicator is distributed EXCLUSIVELY on MQL5.com MT4 version:   https://www.mql5.com/it/market/product/160363 MT5 version:   https://www.mql5.com/it/market/product/160410 ============================================================================================= MAX RIBBON ver 1.00 The indicator that shows you the TREND clearly and unambiguously! ============================================================================================= DESCRIPTION MAX RIBBON is an advanced tre
次世代の自動化された需要と供給のゾーン。どのチャートでも機能する新しい革新的なアルゴリズム。すべてのゾーンは、市場の価格行動に従って動的に作成されています。 2種類のアラート --> 1) 価格がゾーンに達したとき 2) 新しいゾーンが形成されたとき もう 1 つの役に立たない指標はありません。実績のある完全な取引戦略を手に入れることができます。     新機能:     価格が需給ゾーンに達したときにアラートを出す     新しい需給ゾーンが作成されたときにアラートを発します     プッシュ通知アラート     ピップ単位のゾーン幅ラベル     MTF のもう 1 つのタイムフレーム。したがって、現在より 2 時間足高いのではなく、現在より 3 時間足し上に見えるようになります。     アラート/ゾーン/MTF 機能を有効/無効にするボタン あなたが得る利点:     取引から感情を取り除きます。     取引エントリをオブジェクト化します。     確率の高いセットアップで利益を上げましょう。     描画ゾーンから時間を節約します。
作者のその他のプロダクト
100 % PER MONTH PROFIT---- MY NEW SIGNAL HERE ------->   https://www.mql5.com/en/signals/2162238?source=Site+Signals+My# THANKS FOR TRUST IN OUR PRODUCT AND SUPPORT US ! Martina Advisor 2021 is a 100 % Automatic System . Based on severals indicators on different timeframes and a SECRET TRENDING INDICATOR BUILT IN SYSTEM CHARACTERISTICS: TAKE PROFIT AND STOP LOSS FOR EVERY POSITION SIMPLE SETTINGS PLUG AND PLAY  RECOVERING SYSTEM FOR EVERY LOSS STARTING ALSO FROM 560 USD CENTS PASSED STRES
GIVE A LOOK TO MY OTHER PRODUCTS ! 100 % PER MONTH PROFIT---- MY NEW SIGNAL HERE ------->   https://www.mql5.com/en/signals/2162238?source=Site+Signals+My# BROKEN TRENDLINE ALERT IS A SIMPLE TOOL INDICATOR. JUST DRAW IN YOUR CHART A DYNAMIC OR STATIC TRENDLINE,AND THE INDICATOR WILL SEND YOU ALERT WHENEVER THE PRICE CROSSES BELOW OR ABOVE YOUR DRAWN TRENDLINE. IT WORKS IN ANY TIMEFRAME AND ANY CHART YOU WANT.JUST GOT A VPS AND DON'T STRESS IN FRONT OF YOUR COMPUTER. FOR ANY KIND OF QUESTION ,
GIVE A LOOK TO MY OTHER PRODUCTS ! 100 % PER MONTH PROFIT---- MY NEW SIGNAL HERE ------->   https://www.mql5.com/en/signals/2162238?source=Site+Signals+My#                       MACD Cross Alert is a tool indicator that notificate directly to your phone whenever the signal line crosses the base line. For more accurate signals,crosses are filtered like this : Buy Signal : SIGNAL LINE CROSSES ABOVE BASE LINE AND BOTH ARE ABOVE THE 0 VALUE Sell Signal : SIGNAL LINE CROSSES BELOW BASE LINE AN
GIVE A LOOK TO MY OTHER PRODUCTS ! 100 % PER MONTH PROFIT---- MY NEW SIGNAL HERE ------->   https://www.mql5.com/en/signals/2162238?source=Site+Signals+My# Double MA Cross Alert,is a cool indicator that notificate you directly on your telephone or email when 2 Moving average ( you choose the parameters ) crosses. This is very important when you want to know a change of trend and you can't stay in front of your pc! The indicator give you the alert just when the next bar opens ,so give you a more
GIVE A LOOK TO MY OTHER PRODUCTS ! There are patterns that are more affidable then others.One of the most important is the  engulfing pattern .It is very helpful to understand if there is a change of trend. This indicator find for you affidable engulfing patterns and send you an alert when a pattern is completely formed . To make this alert indicator more reliable,there is a parameter that you can change relative to the engulfing bar ( so the lost one closed before signal ). In fact you can cho
GIVE A LOOK TO MY OTHER PRODUCTS !                                                          100 % PER MONTH PROFIT---- MY NEW SIGNAL HERE ------->   https://www.mql5.com/en/signals/2162238?source=Site+Signals+My# Morning and evening star are 2 famous and reliable candlestick patterns, very helpful to understand an imminent change of trend. This indicator finds for you this patterns on your chart and send you an alert just when a pattern is 100 % formed. To make this indicator more reliable,you
GIVE A LOOK TO MY OTHER PRODUCTS ! 100 % PER MONTH PROFIT---- MY NEW SIGNAL HERE ------->   https://www.mql5.com/en/signals/2162238?source=Site+Signals+My# The Parabolic SAR (PSAR) helps trader identifying direction of the stock movement and also provides them with the entry and exit. This indicator on the chart appears as a series of dots either above or below the price bars. When the Dots are below the price bar is then the price movement is considered to be bullish and when the Dots are abo
100 % PER MONTH PROFIT---- MY NEW SIGNAL HERE ------->   https://www.mql5.com/en/signals/2162238?source=Site+Signals+My# ENGULFING PATTER EA IS AN EXPERT ADVISOR THAT OPENS POSITION BASED ON THE " ENGULFING CANDLESTICK PATTERN "  FREE INDICATOR HERE  ------>>>>   https://www.mql5.com/en/market/product/62135?source=Site+Profile+Seller PLEASE KINDLY NOTE THAT THIS EA IS NOT OPTIMIZED AND WITH STANDARD SET IS NOT PROFITABLE.SO PLEASE OPTIMIZE THIS ROBOT BEFORE GOING LIVE . THE ROBOT OPENS POSITION
100 % PER MONTH PROFIT---- MY NEW SIGNAL HERE ------->   https://www.mql5.com/en/signals/2162238?source=Site+Signals+My# What Is the Average True Range (ATR)? The average true range (ATR) is a technical analysis indicator, introduced by market technician J. Welles Wilder Jr. in his book   New Concepts in Technical Trading Systems,   that   measures market volatility   by decomposing the entire range of an asset price for that period. The true range indicator is taken as the greatest of the foll
100 % PER MONTH PROFIT---- MY NEW SIGNAL HERE ------->   https://www.mql5.com/en/signals/2162238?source=Site+Signals+My# The Commodity Channel Index (CCI) measures the current price level relative to an average price level over a given period of time. CCI is relatively high when prices are far above their average. CCI is relatively low when prices are far below their average. Using this method, CCI can be used to identify overbought and oversold levels. You can set the period of CCI. The indi
100 % PER MONTH PROFIT---- MY NEW SIGNAL HERE ------->   https://www.mql5.com/en/signals/2162238?source=Site+Signals+My# GENERAL BREAKOUT EXPERT ADVISOR The EA is 100 % automatic.Suitable for FTMO. Works on breakout levels with SL and TP for every position and a system of trailing for bad positions.SL & TP are put in strategic level points automatically by an innovative algo system. It's possible to use a fixed lot for the first position,or a automatic lot.( If you have doubs,just send me a me
GIVE A LOOK TO MY OTHER PRODUCTS ! 100 % PER MONTH PROFIT---- MY NEW SIGNAL HERE ------->   https://www.mql5.com/en/signals/2162238?source=Site+Signals+My# Smoothed MA cross alert,is a cool indicator that notificate you directly on your telephone or email when 2 Smoothed Moving average ( you choose the parameters ) crosses. This is very important when you want to know a change of trend and you can't stay in front of your pc! The indicator give you the alert just when the next bar opens ,so give
フィルタ:
80053930
624
80053930 2021.04.14 21:16 
 

ユーザーは評価に対して何もコメントを残しませんでした

Maans Petter Erixon
332
Maans Petter Erixon 2021.02.12 14:33 
 

Good indicator and good support from the seller. I also love the sellers other indicator "Broken Trendline Alert" - very useful!

レビューに返信