Bar 4 Colors
- インディケータ
- バージョン: 1.20
- アップデート済み: 7 6月 2021
- アクティベーション: 5

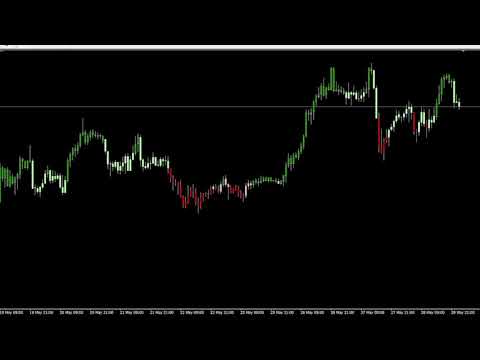
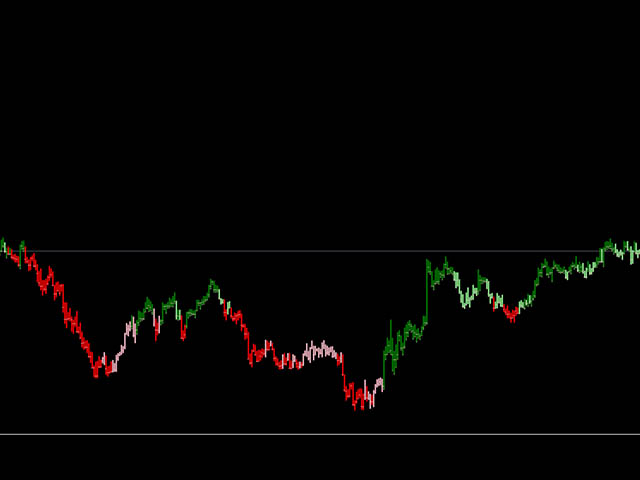
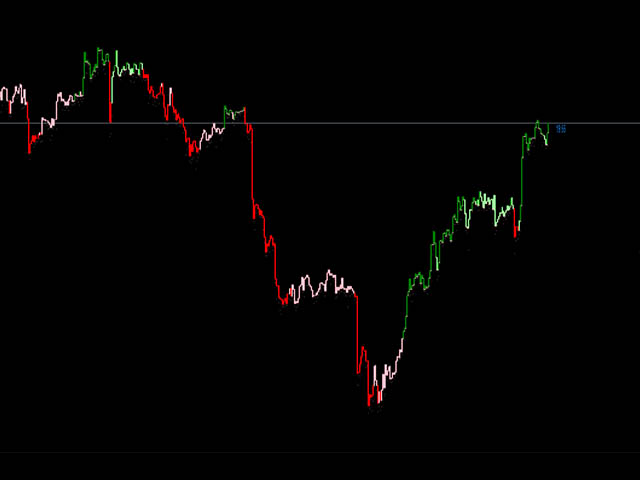
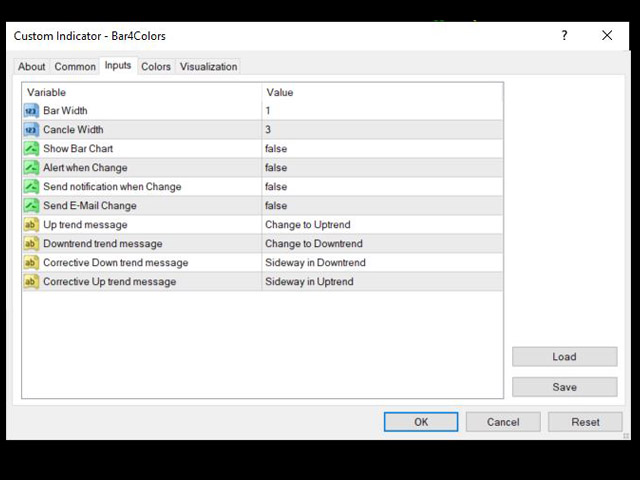
This indicator will create bars in 4 deference colors.
The Green Bar is Up Trend.
The Red Bar is Down Trend.
Lite Green Bar is No Trend (corrective or sideway) but still in Up Trend.
Pink Bar is No Trend (corrective or sideway) but still in Down Trend.
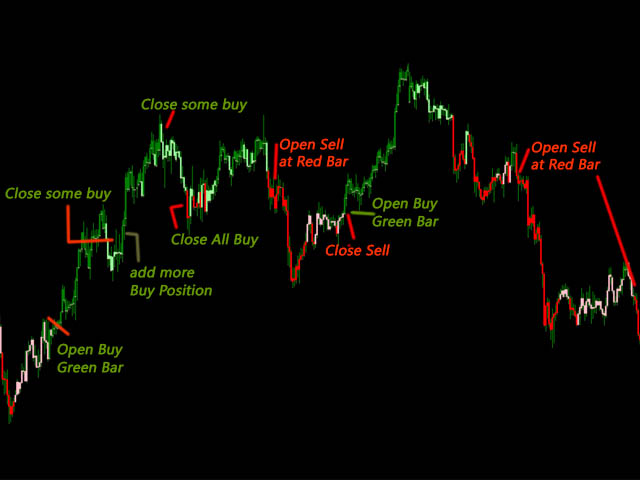
You can just looking at the Bar's Color and Trade in Green Bar for Long Position and Red Bar for Short Position.
You can change all the colors in your way.
1. Alert function : Will popup Alert Windows and play sound when the Bar was changed.
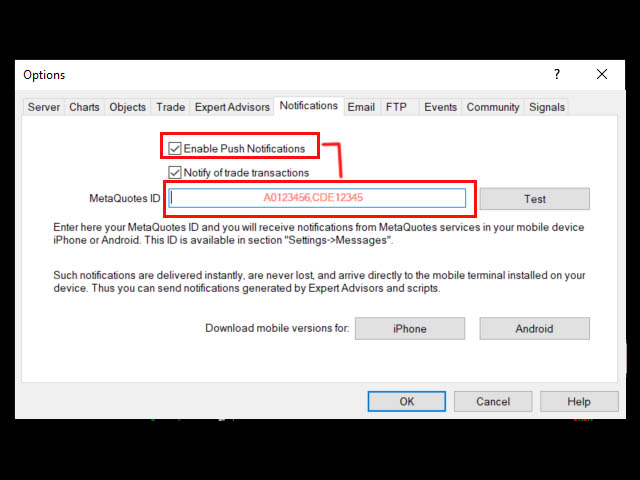
2. Push Notifications : Sends push notifications to the mobile terminals, MetaQuotes IDs needed and must specified in the "Notifications" tab. (see the screen short)
3. Send E-mail : Send an E-mail Notification to the specific E-mail Account. User can setting the email at menu [Tools] -> [Options] inside Email tab.