• 概要
  • レビュー
  • コメント
  • 最新情報

MTF atr Signals

Hello

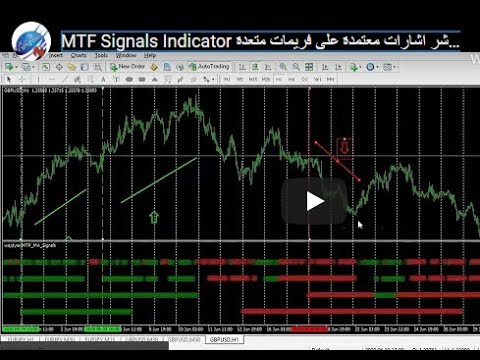
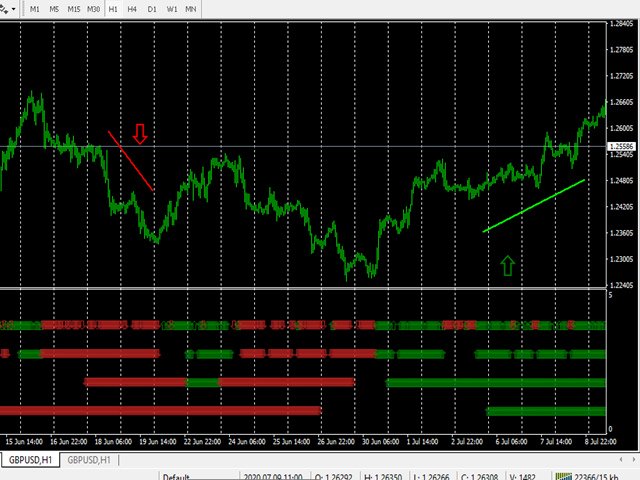
This Indicator will draw Green (Up) and Red (Down) small arrows from Multi TimeFrames based in ( Average True Range ) to help you to take decision to buy or sell or waiting

If there 4 green arrows in same vertical line that's mean (Up) and If there 4 Red arrows in same vertical line that's mean (Down) 

and the options contain (Alert and Mobile , Mail Notifications).

Please watch our video for more details

https://youtu.be/MVzDbFYPw1M

and these is EA for it

https://www.mql5.com/en/market/product/53352 

Good luck

--------------------------------------------------------------

السلام عليكم

هذا المؤشر يرسم سهامًا صغيرة خضراء (أعلى) وحمراء (أسفل) اعتماداً على اكثر من فريم استناداً على

(  Average True Range  )

لمساعدتك على اتخاذ قرار الشراء أو البيع أو الانتظار

إذا كان هناك 4 أسهم خضراء في نفس الخط الرأسي فهذا يعني (أعلى)

و

إذا كان هناك 4 أسهم حمراء في نفس الخط الرأسي فهذا يعني (لأسفل)

وهناك خيارات تنبيه و موبايل وايميل اذا اردت

يرجى مشاهدة الفيديو لمزيد من التفاصيل

https://youtu.be/MVzDbFYPw1M

وهذا الاكسبيرت الخاص به

https://www.mql5.com/en/market/product/53352


بالتوفيق ان شاء الله

おすすめのプロダクト
Hello This Indicator will draw Green (Up) and Red (Down) small arrows from Multi TimeFrames based in (     Williams Percent Range    ) to help you to take decision to buy or sell or waiting If there 4 green arrows in same vertical line that's mean (Up) and If there 4 Red arrows in same vertical line that's mean (Down)  and the options contain (Alert and Mobile , Mail Notifications). Please watch our video for more details https://youtu.be/MVzDbFYPw1M and these is EA for it https://www.mql5.com/e
Iterative Moving Average – IMA.   IMA is obtained by correcting the usual   MA.   The correction consists in addition   to MA averaged difference between the time series (X) and its MA, i.e.   IMA(X)=MA(X) + MA ( Х -MA(X)). Correction is done in several iterations (and, exactly, 2 iterations in this indicator) and with a change in the averaging period.               As a result, the time-series points begin to cluster around (on all sides) of the getting   IMA and with a smaller de
Donchian channels are a tool in technical analysis used to determine the relative volatility of a market and the potential for price breakouts. Can help identify potential breakouts and reversals in price, which are the moments when traders are called on to make strategic decisions. These strategies can help you capitalize on price trends while having pre-defined entry and exit points to secure gains or limit losses. Using the Donchian channel can thus be part of a disciplined approach to manag
FREE
This indicator displays the signals of a highly effective oscillator -  Laguerre Osc 2 AM   - on the price chart. The presented indicator uses the Laguerre filter to build an oscillator. The indicator has the possibility of double additional smoothing, which can be useful for small values ​​of the Gamma parameter. The indicator gives three types of signals: Exit of the oscillator from the overbought / oversold zone; The oscillator crossing the middle of the value between the overbought/oversold
The indicator detects and displays Shark harmonic pattern (see the screenshot). The pattern is plotted by the extreme values of the ZigZag indicator (included in the resources, no need to install). After detecting the pattern, the indicator notifies of that by a pop-up window, a mobile notification and an email. The indicator highlights the process of the pattern formation and not just the complete pattern. In the former case, it is displayed in the contour triangles. After the pattern is comple
The Standard Deviation (StdDev) indicator drawn using a tick chart. After launching it, wait for enough ticks to come. Parameters: Period - period of averaging. Method - method of averaging. calculated bar - number of bars for the indicator calculation.
Description A colored universal multicurrency/multi-symbol indicator ZigZag to be drawn in a separate window below the main financial instrument. The indicator may be used with any broker, irrespective of the name of the financial instrument since it is necessary to manually enter the name as an input parameter. If you enter a non-existent or incorrect name of a financial instrument, you will receive an error message that this financial instrument is unknown (does not exist).  The indicator can
Analyze up to 3 additional charts of other timeframes , without switching the main chart. My   #1 Utility : includes 65+ functions  |   Contact me  if you have any questions The indicator opens in a  separate window: The window   can be moved   to any place on the chart (using the   [<M>]   button). The window can also be minimized to save space ( [ <^>]  button) In the window that appears, you can configure: The period   of the 1st chart (left); The period   of the 2nd chart (center); The peri
This indicator is the undisputed leader among the indicators. And for this statement there is a good reason. The indicator builds a very high quality channel in which it generates signals to enter! What is the ideal strategy for the trader, since the trader always hesitates when choosing a strategy for the job. That is, this indicator will allow you to solve the dilemma of choosing a job by trend or to the channel, since it combines these two basic concepts. Working with the indicator is very
Door   この指標は、市場の価格のダイナミクスの傾向を反映しています。価格ダイナミクスには、上向きの動き、下向きの動き、横向きの価格の動きという3つの主要な傾向があります。インディケータは、価格変動の一般的な方向を判断するのに役立ちます。簡単に言えば、市場のトレンドを視覚化することができます。インディケータを使用すると、常にトレンドの方向にトレードすることができます。また、インジケーターを使用して、チャネルまたはサポートと抵抗のレベルを識別することができます。 M15チャート期間のインジケーターを使用することをお勧めします。 インジケーター設定: bar_limit-インジケーターを表示するバーの数。= 0の場合、使用可能なすべてのバーに表示されます。
Super Pair Strong Indicator is a highly popular momentum and trend indicator that utilizes multiple currencies to determine trends. It is a one-chart indicator that combines the algorithms of the MACD and Currency Strength Meter. With its one-click feature, users can view 28 major and minor pairs on their dashboard, and by clicking on a specific pair, the chart will automatically change to the user's preferred chart. In addition to its user-friendly interface, Super Pair Strong Indicator offers
This is a breakout indicator using Linear Regression (LR) and Standard Deviation (SD) adaptive channels. It finds a best fitting of linear regression and standard deviation channels on consecutive bars, then monitors prices on breaking out the channel, and if so - generates a signal. The best fitting is performed by picking up the channels length which provides less difference between LR and SD channels width. On every bar the channels may have different - adaptive - length. Indicator displays p
Divergence Range Divergence Range is a very simple and yet effective indicator that calculate the price divergence range from a standard moving average indicator. The indicator has two groups of line, three lines, upper1, upper2, upper3 above a standard moving average and three lines below, lower1, lower2, lower3, which shows the divergence range for the price movement from the standard moving average. The two out most line virtually covers more than 95% of the price movement from the standard m
A ratio between 0 and 1 with the higher values representing a more efficient or trending market,  It is used in the calculation of Perry J. Kaufman Adaptive Moving Average (KAMA), dividing the price change over a period by the absolute sum of the price movements that occurred to achieve that change. The Fractal Efficiency or also known as Efficiency Ratio was first published by Perry J. Kaufman in his book ‘Smarter Trading‘. This is mostly considered a filter for volatile markets none the less
FREE
The indicator detects and displays 3 Drives harmonic pattern (see the screenshot). The pattern is plotted by the extreme values of the ZigZag indicator (included in the resources, no need to install). After detecting the pattern, the indicator notifies of that by a pop-up window, a mobile notification and an email. The indicator highlights the process of the pattern formation and not just the complete pattern. In the former case, it is displayed in the contour triangles. After the pattern is com
The triple oscillator indicator " ThreeAngleR " is a common indicator for three calculators of the angular deviation of the price chart of a trading instrument. INPUT PARAMETER: Input1 = " AnglerSPeriod "; - DRAWs1 =128 - Number of bars to display the indicator in the chart history; - PeriodIND =14 - calculation period of the indicator in the number of bars; Input2 = " JAngleR "; - DRAWs2 =128 - Number of bars to display the indicator in the chart history; - Period_IND =14 - calculation perio
VR Cub
Vladimir Pastushak
VR Cub は、質の高いエントリーポイントを獲得するためのインジケーターです。このインジケーターは、数学的計算を容易にし、ポジションへのエントリーポイントの検索を簡素化するために開発されました。このインジケーターが作成されたトレーディング戦略は、長年にわたってその有効性が証明されてきました。取引戦略のシンプルさはその大きな利点であり、初心者のトレーダーでもうまく取引することができます。 VR Cub はポジション開始ポイントとテイクプロフィットとストップロスのターゲットレベルを計算し、効率と使いやすさを大幅に向上させます。取引の簡単なルールを理解するには、以下の戦略を使用した取引のスクリーンショットを見てください。 設定、設定ファイル、デモ版、説明書、問題解決方法は、以下から入手できます。 [ブログ] レビューを読んだり書いたりすることができます。 [リンク] のバージョン [MetaTrader 5] エントリーポイントの計算ルール ポジションをオープンする エントリーポイントを計算するには、VR Cub ツールを最後の高値から最後の安値までストレッチする必要があります。
RJT Comets
Rafael Jimenez Tocino
1 (1)
Follow the trail of the comet to know the development of the trend. This indicator helps you to determine the evolution of the price depending on how these astronomical objects are shown in the chart. When the comet seems to stop, it opens its tails considerably and warns us of a possible change in trend. On the contrary, when it seems to get speed (looks thin because lines of tail are grouped) demonstrates safety and continuity in trend. The head or comet nucleus will show red or green accordin
FREE
この指標は、中央値プロパティと移動平均プロパティの組み合わせに基づくシーケンシャルハイブリッドフィルターです。 中央値を使用すると、異常値と価格系列の値のランダムなインパルスを除外できます。同時に、メディアンフィルタは価格変動のトレンドに影響を与えず、それを変更しません。 メディアンフィルタは非線形なので、単純移動平均を使用した平均化を使用してその値を平滑化します。このアプローチにより、トレンドだけでなく、価格変動の周期的な要素もより正確に特定できます。さらに、それは価格の変化に対するインディケータの感度を高め、そしてプライスシリーズとインディケータの読みの間の遅れを減らします。これにより、指標は新しいトレンドの始まりと FL パラメーターを使用して、フィルタ古いトレンドの終わりについてかなり正確に警告することができます。 ーの深さと感度を調整できます。許容値は0から63です。同時に、 2 * FL + 1 バーを使用して指標値を計算します。したがって、FLの値が大きいほど、価格チャートの傾向が強く表示されます。
This    Nice Trade Point     indicator is designed for signal trading. This indicator generates trend signals. It uses many algorithms and indicators to generate this signal. It tries to generate a signal from the points with the highest trend potential. This indicator is a complete trading product. This indicator does not need any additional indicators. The indicator certainly does not repaint. The point at which the signal is given does not change.     Features and Suggestions Time
The principle of constructing indicator lines and their meaning .               The Signal Channel   indicator uses a robust filtering method based on two moving medians applicable to the High and Low prices, i.e. the lines <High> and <Low>, where <..> is the sign of linear averaging, which are shifted by certain values ​​in an uptrend and by opposite values ​​in a downtrend, which allows you to get a narrow channel, approximately outlining each bar. Sharp kinks of the lines of such a channel a
Delta AG Free
Yurij Kozhevnikov
5 (2)
The difference between the arithmetic and geometric means at the specified range. Since the greater is the difference between the values, the greater the resulting figure is, actually the indicator shows volatility fluctuations. The arithmetic mean of a certain number of values ​​is the sum of the values ​​divided by their number. The geometric mean is the root of the power of the number of values ​​extracted from the product of these values. If all values ​​are equal, the arithmetic mean and th
FREE
Simplify Your Trading with the MACD Dashboard Are you tired of juggling multiple MetaTrader charts to monitor MACD across different timeframes and symbols? The MACD Dashboard is the solution you've been waiting for. This innovative MetaTrader indicator provides a centralized view of MACD signals on multiple charts, making it easier than ever to identify trading opportunities and manage your risk. Key Features: Multi-Timeframe Monitoring: Track MACD signals on multiple timeframes simultaneou
A quick indicator with simple settings that does not take up much space in the working window and is displayed as simply as possible. The indicator analyzes the ratio of maximum and minimum prices for selected periods. Visually, the indicator is similar to its first version (Chainsaw AM), but a completely different principle is used for calculation. The indicator allows you to clearly determine the medium/short-term trend and support/resistance levels at points where the trend direction changes.
通貨強度マルチメーターインジケーターは、以下の各通貨の強度、方向、ランクを示します。 AUD CAD CHF EUR GBP JPY NZD USD さらに、次の各通貨ペアの強さ、方向、ランクも表示されます。 AUDCAD AUDCHF AUDJPY AUDNZD AUDUSD CADCHF CADJPY CHFJPY EURAUD EURCAD EURCHF EURGBP EURJPY EURNZD EURUSD GBPAUD GBPCAD GBPCHF GBPJPY GBPNZD GBPUSD NZDCAD NZDCHF NZDJPY NZDUSD USDCAD USDCHF USDJPY インジケーターは、任意のチャートおよび任意の時間枠で機能します。各通貨と通貨ペアの強さ、方向、ランクデータは、インジケーターバッファーを通じてアクセスできます。チャートにインジケーターをドロップしてすべての情報を表示するか、インジケーターを設定して、それが表示されている特定のチャートの通貨と通貨ペアのみを表示することができます。 データは、通貨と通貨ペアの横棒グラフとして表示されます。また
Hello This Indicator will draw Green (Up) and Red (Down) small arrows from Multi TimeFrames based in ( Ichimoku ) to help you to take decision to buy or sell or waiting If there 4 green arrows in same vertical line that's mean (Up) and If there 4 Red arrows in same vertical line that's mean (Down)  and the options contain (Alert and Mobile , Mail Notifications). Please watch our video for more details https://youtu.be/MVzDbFYPw1M and these is EA for it https://www.mql5.com/en/market/product/533
MT4 用 Forex インジケーター MA 加速、リペイントなし。 MA 加速 - スキャルピング インジケーターで、「MA スピード」インジケーターの補助ツールとして設計されています。 このインジケーターの計算は、物理学の方程式に基づいています。移動平均線の加速を示します。 MA 加速を使用すると、標準戦略でもアップグレードする機会がたくさんあります。SMA、EMA、LWMA に使用できます。 インジケーターの設定は非常に簡単です。 MA 加速インジケーターは、MA スピード インジケーターが値を変更する速度を示します。 MA 加速インジケーターの値が < 0 の場合: MA スピードは弱気方向に増加しています。MA 加速インジケーターの値が > 0 の場合: MA スピードは強気方向に増加しています。 MA 加速インジケーターは、MA スピード インジケーターと共に、メイン トレンドの方向のスキャルピング戦略で使用することをお勧めします。MA スピード インジケーターの値が < 0 の場合: トレンドが下降します。MA スピード インジケーターの値が > 0
The Display ADX System indicator for the MetaTrader 4 trading platform ( see description (in Russian) ) is compactly sized for a chart window, while displaying ADX indicator results for all time frames in a single window. Parameters for each time frame are set separately. Font size, corner and color can be set according to your preferences. By default, colors of time frame names are as follows: no trend - white, bullish trend - green, bearish trend - red. If the ADX is rising on the last three b
This indicator displays the signals based on the values of the classic WPR indicator. The WPR indicator can be used for determining the overbought or oversold areas on the chart. Reaching these levels means that the market can soon turn around, but it does not give signal, as in a strong trend the market can stay in the overbought or oversold state for quite a long time. As with most oscillators, the signals are generated when leaving these areas. This indicator allows to display three types of
FREE
Signals and Alerts for AMA (Adaptive Moving Average) indicator based on these MQL5 posts:   Adaptive Moving Average (AMA)   and   Signals of the Indicator Adaptive Moving Average . Note : this tool is based on the code of AMA indicator developed by MetaQuotes Software Corp. Features The signals are triggered at   closing   of last bar/opening of a new bar; Any kind of alerts can be enabled: Dialog Box, Email message, SMS notifications for smartphones and tablets, and Sound alerts; Customizable
FREE
このプロダクトを購入した人は以下も購入しています
Gann Made Easy は、ミスター・ギャンの理論を使用した取引の最良の原則に基づいた、プロフェッショナルで使いやすい外国為替取引システムです。 W・D・ガン。このインジケーターは、ストップロスとテイクプロフィットレベルを含む正確な買いと売りのシグナルを提供します。 PUSH通知を利用して外出先でも取引可能です。 購入後はご連絡ください!私の取引のヒントと素晴らしいボーナスインジケーターを無料で共有します! おそらく、ギャンの取引手法についてはすでに何度も聞いたことがあるでしょう。通常、ギャンの理論は初心者のトレーダーだけでなく、すでにある程度の取引経験がある人にとっても非常に複雑なものです。なぜなら、ギャンの取引手法は理論的にはそれほど簡単に適用できるものではないからです。私はその知識を磨き、最良の原則を私の外国為替インジケーターに組み込むために数年を費やしました。 このインジケーターは非常に簡単に適用できます。必要なのは、それをチャートに添付し、簡単な取引推奨事項に従うだけです。このインジケーターは常に市場分析の仕事を行い、取引の機会を探します。適切なエントリーポイントを検出
最初のパルスレベルを反転 (RFI)     指示する     ロシア     -        utilizar con   el indicador の ESP 推奨事項 -   TPSpro トレンド プロフェッショナル版 -   MT5のバージョン 最も重要なことは、将来においても最も重要なことです。 機能のプリンシパル: ゾーンのほとんどは、ベンダーとコンプラドールによってアクティブ化されます。 状況を直感的に把握できるよう、初期の衝動を修正します。 LOGIC AI: MUESTRA zonas (círculos) parabuscar puntos de entrada cuando se activa una plantilla 視覚的に優れた視覚効果があり、最も重要な機能がすべて揃っていることに注意してください。 優れたニベレス/ゾーンの視覚化 (modo MTF) 世界で最も人気のある場所/ゾーンです。これを使用するのに最適な方法です (   TPSproTREND PRO   )。 アルゴリズム プロフェッショナル セパラド パソ ア パソ パラ オペラ それは
まず第一に、この取引インジケーターは再描画されず、再描画されず、遅延しないことを強調する価値があります。これにより、手動取引とロボット取引の両方に理想的なものになります。 ユーザーマニュアル:設定、入力、戦略。 アトミックアナリストは、価格の強さとモメンタムを利用して市場でより良いエッジを見つけるためのPA価格アクションインジケーターです。ノイズや誤ったシグナルを除去し、取引ポテンシャルを高めるための高度なフィルターを備えています。複雑なインジケーターの複数のレイヤーを使用して、アトミックアナリストはチャートをスキャンし、複雑な数学的計算をシンプルなシグナルと色に変換します。これにより、どのような初心者トレーダーでも理解して使用し、一貫した取引の決定を行うことができます。 「アトミックアナリスト」は、新規および経験豊富なトレーダー向けにカスタマイズされた包括的な取引ソリューションです。プレミアムインジケーターとトップノッチの機能を1つの取引戦略に組み合わせ、すべてのタイプのトレーダーにとって汎用性のある選択肢にします。 デイリートレーディングとスキャルピング戦略:高
Gold Stuff
Vasiliy Strukov
4.89 (238)
Gold Stuff は、金専用に設計されたトレンド指標であり、あらゆる金融商品にも使用できます。 インジケーターは再描画せず、遅れません。 推奨時間枠 H1. それインディケータでフルオートExpert Advisor EA Gold Stuffが動作します。 あなたは私のプロフィールでそれを見つけることができます. 設定と個人的なボーナスを得るために、購入後すぐに私に連絡してください! トレンド スキャナーの強力なサポートを利用して、無料のインジケーターを入手し、プライバシーを守ります。あーみー!   設定 矢印を描く - オンオフ。 チャートに矢印を描く。 アラート - 可聴アラートのオンオフ。 メール通知 - オンオフ。 電子メール通知。 プチ通知 - オンオフ。 プッシュ通知。 次に、色域を調整します。 Gold Stuff は、金専用に設計されたトレンド指標であり、あらゆる金融商品にも使用できます。 インジケーターは再描画せず、遅れません。 推奨時間枠 H1. それインディケータでフルオートExpert Advisor EA Gold Stuff
Trend Punch
Mohamed Hassan
4.95 (19)
This indicator is unstoppable when combined with our other indicator called  Support & Resistance . After purchase, send us a message and you will get it   for  FREE as a BONUS! Introducing Trend Punch , the revolutionary forex trend indicator that will transform the way you trade! Trend Punch is uniquely designed to provide precise buy and sell arrows during strong market trends, making your trading decisions clearer and more confident. Whether you're trading major currency pairs or exotic sym
An exclusive indicator that utilizes an innovative algorithm to swiftly and accurately determine the market trend. The indicator automatically calculates opening, closing, and profit levels, providing detailed trading statistics. With these features, you can choose the most appropriate trading instrument for the current market conditions. Additionally, you can easily integrate your own arrow indicators into Scalper Inside Pro to quickly evaluate their statistics and profitability. Scalper Inside
TPSpro TREND PRO は 、市場を自動的に分析し、トレンドとその各変化に関する情報を提供し、再描画せずに取引に参加するためのシグナルを提供するトレンド指標です。 インディケータは各ローソク足を使用し、個別に分析します。さまざまなインパルス(アップまたはダウンインパルス)を指します。通貨、仮想通貨、金属、株、指数の取引への正確なエントリーポイント! バージョンMT5                   インジケーターの完全な説明   インジケーター -   RFI LEVELS と併用することをお勧めします。 主な機能: レンダリングなしで正確な入力信号! シグナルが表示された場合、それは関連性を維持します。これは、シグナルを提供してからそれを変更する可能性があり、入金時の資金の損失につながる可能性があるリドローインジケーターとの重要な違いです。より高い確率と精度で市場に参入できるようになりました。矢印が表示された後、ターゲットに達する (利益確定) か反転シグナルが表示されるまで、ローソク足を色付けする機能もあります。 STOP LOSS / TAKE PROFIT
mql5と Telegramの モーニング・ブリーフィングで、詳細とスクリーンショットを含む毎日のマーケット・アップデートをご覧 ください! FX Power MT4 NGは 、長年の人気を誇る通貨強度計FX Powerの次世代モデルです。 この次世代ストレングスメーターは何を提供するのでしょうか?初代FXパワーの魅力すべて プラス GOLD/XAUの強さ分析 より正確な計算結果 個別に設定可能な分析期間 カスタマイズ可能な計算上限値により、さらに優れたパフォーマンスを実現 もっと見たい人のための特別なマルチインスタンス設定 すべてのチャートでお好みの色を無限に設定可能 数え切れないほどの通知オプションにより、重要なことを見逃すことはありません。 Windows 11とmacOSのスタイルで角を丸くした新しいデザイン 魔法のように動くインジケーターパネル FXパワーの主な機能 すべての主要通貨の強さの完全な履歴 すべての時間枠における通貨の強さの履歴 すべてのブローカーとチャートで同一の計算結果 100%信頼できるリアルタイム計算 -> リペイントなし ドロップダウン・リストから
現在20%OFF! 初心者やエキスパートトレーダーのためのベストソリューション! このダッシュボードソフトウェアは、28の通貨ペアで動作しています。それは私達の主要な指標(高度な通貨の強さ28と高度な通貨インパルス)の2に基づいています。それは全体の外国為替市場の大きい概観を与えます。それは、すべての(9)時間枠で28の外国為替ペアのための高度な通貨の強さの値、通貨の動きの速度と信号を示しています。チャート上で1つのインディケータを使用して市場全体を観察し、トレンドやスキャルピングの機会をピンポイントで見つけることができたら、あなたのトレードがどのように改善されるか想像してみてください。 このインディケータには、強い通貨と弱い通貨の識別、潜在的な取引の識別と確認がより簡単になるような機能が搭載されています。このインディケータは、通貨の強さや弱さが増加しているか減少しているか、また、すべての時間枠でどのように機能しているかをグラフィカルに表示します。 新機能として、現在の市場環境の変化に適応するダイナミックなマーケットフィボナッチレベルが追加され、すでに当社のAdvan
Trend Screener
STE S.S.COMPANY
4.8 (87)
トレンドインジケーター、1つのツールに組み込まれたすべての重要なトレンド機能を備えたトレンドトレーディングとフィルタリングのための画期的なユニークなソリューション! これは、すべてのシンボル/商品(外国為替、商品、暗号通貨、インデックス、株式)で使用できる100%再描画されていないマルチタイムフレームおよびマルチ通貨インジケーターです。 期間限定オファー: サポートおよびレジスタンス スクリーナー インジケーターは、たった 50 ドルで永久的にご利用いただけます。(元の価格 250 ドル) (オファー延長) トレンドスクリーナーは、チャート内のドットで矢印トレンドシグナルを提供するインジケーターに続く効率的なインジケーターです。 トレンド分析インジケーターで使用できる機能: 1.トレンドスキャナー。 2.最大利益分析を備えたトレンドライン。 3.トレンド通貨強度メーター。 4.アラート付きのトレンド反転ドット。 5.アラート付きの強いトレンドドット。 6.トレンド矢印 毎日の分析例、毎日のシグナルパフォーマンス...など、トレンドスクリーナーインジケーターを使用して、ここで見つけること
FX Volume
Daniel Stein
4.58 (33)
mql5と Telegramの モーニング・ブリーフィングで、詳細とスクリーンショットを含む毎日のマーケット・アップデートをご覧 ください! FX Volumeは、ブローカーの視点から市場のセンチメントをリアルに洞察する、最初で唯一の出来高インジケーターです。 ブローカーのような機関投資家が外国為替市場でどのようなポジションをとっているか、COTレポートよりもはるかに速く、素晴らしい洞察を提供します。 この情報をチャート上で直接見ることは、あなたの取引にとって真のゲームチェンジャーであり、画期的なソリューションです。 以下のようなユニークなマーケットデータ洞察から利益を得てください。 比率は 、通貨のロングポジションとショートポジションの比率をパーセントで表示します。 比率の変化は 、選択した期間内のロング比率とその変化率を表示します。 Volumes Totalは 、通貨の取引量(ロングとショート)の合計をロット単位で表示します。 Volumes Long :全通貨のロングポジションの取引量を表示します。 Volumes(ショート )は、全通貨のショートポジションの取引量を表示
- Real price is 80$ - 40% Discount ( It is 49$ now ) Contact me for instruction, add group and any questions! Related EA Product: Bitcoin Expert Introduction The breakout and retest strategy is traded support and resistance levels. it involves price breaking through a previous level.  The break and retest strategy is designed to help traders do two main things, the first is to avoid false breakouts. Many false breakouts start with a candlestick that breaks out of a level but ends with an immedi
現在31%オフ! 初心者やエキスパートトレーダーに最適なソリューション! このインジケータは、独自の機能と秘密の数式を組み込んだ、ユニークで高品質かつ手頃な価格のトレーディングツールです。たった1枚のチャートで28の通貨ペアのアラートを表示します。新しいトレンドやスキャルピングチャンスの引き金となるポイントを正確に把握することができるので、あなたのトレードがどのように改善されるか想像してみてください! 新しい基本的なアルゴリズムに基づいて構築されているため、潜在的な取引の特定と確認がより簡単になります。これは、通貨の強さや弱さが加速しているかどうかをグラフィカルに表示し、その加速のスピードを測定するためです。加速すると物事は明らかに速く進みますが、これはFX市場でも同じです。つまり、反対方向に加速している通貨をペアにすれば、利益を生む可能性のある取引を特定することができるのです。 通貨の勢いを示す縦の線と矢印は、あなたの取引の指針となるでしょう。 ダイナミックマーケットフィボナッチ23レベルはアラートトリガーとして使用され、市場の動きに適応します。もしインパルスが黄色
Enigmera
Ivan Stefanov
5 (3)
エニグメラ:市場の中核 https://www.enigmera.com はじめに このインディケータと取引システムは、金融市場に対する驚くべきアプローチです。ENIGMERAは、フラクタルサイクルを使用して、サポートとレジスタンスレベルを正確に計算します。本格的な蓄積局面を示し、方向性と目標を示します。 トレンド中でも調整中でも機能するシステムです。 どのように作動するのか? ENIGMERAは、支持線・抵抗線、目標線、乖離線の3つのラインで構成されています。このシステムは、過去のデータを現在と未来に外挿する典型的な市場指標とは異なり、現在の完全な画像を提供します。支持線上にある場合、それは本当の支持を意味し、抵抗線上にある場合、それは本当の抵抗を意味する。ある水準が破られた場合、それはトレンドの変化を意味する。再描画はしない。 市場は常に進化しているため、ENIGMERAはその評価ツールを適応させ、定期的に戦略を修正しています。  これにより、すべてのシナリオが徹底的に評価されることが保証されます。この市場指標の独自性は、その能力を見れば明らかです。  ENIGM
トレンドカッターは、M1 や M5 などの下位時間枠を含むあらゆる時間枠で使用できるトレンド指標です。このインジケーターは日中取引を好むトレーダーにとって理想的であり、長期取引を好むトレーダーにも役立ちます。このインジケーターは、取引システムの基礎として、またはスタンドアロンの取引ソリューションとして使用できます。 このインジケーターは、PUSH 通知を含むあらゆるタイプのアラートを提供します。 インジケーターの使い方はとても簡単です。信号に従えばいいだけです。また、このインジケーターのすべてのユーザーに、このメソッドをできるだけ効率的に使用するのに役立つ追加のインジケーターも無料で提供します。 取引のヒントと素晴らしいボーナスを入手するには、購入後にご連絡ください。
PRO Renko Systemは、特別にRENKOチャートを取引するために設計された高精度の取引システムです。 これは、様々な取引商品に適用することができる普遍的なシステムです。 システムは効果的に正確な逆転信号へのアクセスを与えるいわゆる市場の騒音を中和する。 表示器は非常に使いやすく、信号の生成に責任がある1つの変数だけがあります。 あなたは簡単にお好みの任意の取引ツールとレンコバーのサイズにツールを適応させることができます。 私はいつもあなたが私のソフトウェアで収益性の高い取引を支援するために余分なサポートを提供する準備ができています! 私はあなたに幸せで収益性の高い取引をしたいです! ご購入後にご連絡ください! 私はあなたに私のレンコチャートジェネレータを送信します。 私はまた、私の個人的な推奨事項やシステムの他のモジュールを無料で共有します!
現在26%オフ 初心者やエキスパートトレーダーに最適なソリューション! このインジケーターは、独自の機能と新しい計算式を取り入れた、ユニークで高品質、かつ手頃な価格のトレーディングツールです。たった1枚のチャートで28の為替ペアの通貨強度を読み取ることができます。新しいトレンドやスキャルピングチャンスの引き金となるポイントを正確に特定することができるので、あなたのトレードがどのように改善されるか想像してみてください。 ユーザーマニュアルはこちら  https://www.mql5.com/en/blogs/post/697384 これが最初の1本、オリジナルだ! 価値のないクローンを買わないでください。 特別な サブウィンドウの矢印で強い通貨の勢いを表示 GAPがあなたのトレードを導く! 基準通貨や気配値が売られすぎ・買われすぎのゾーン(外相フィボナッチレベル)にあるとき、個別チャートのメインウィンドウに警告表示。 通貨がレンジの外側から反落した場合、プルバック/リバーサルのアラート。 クロスパターンの特別なアラート 複数の時間枠を選択可能で、トレンドを素早く
ブレーカートレーダーになり、価格が反転すると市場構造からの利益が変化します。 注文ブロックブレーカーインジケーターは、トレンドまたは価格の動きが枯渇に近づいており、逆転の準備ができていることを識別します。通常、反転または大規模なプルバックが発生しようとしているときに発生する市場構造の変化について警告します。 この指標は、ブレイクアウトと価格の勢いを識別する独自の計算を使用します。使い果たされる可能性のあるポイントの近くで新しい高値が形成されるたびに、インディケーターはその高値の作成を担当する最後の注文ブロックを描きます。次に、移動する価格とともに注文ブロックを追跡します。その後、価格が反対方向にシフトし、その注文ブロックを突破すると、新しい市場構造を作成し、トレンドまたは大きな後退の可能性のある反転の開始を警告します。 注文ブロックは、高値/安値が作成される前の最後の反対色のろうそくであり、価格がこれらの重要な領域を下抜けすると、トレンドの短期的ま​​たは長期的な反転の兆候です。 特徴 重要な枯渇点での市場構造の変化を警告します 価格が使い果たされるレベルに近づくと、
TakePropips Donchian Trend Pro
Eric John Pajarillaga Aldana
4.44 (16)
TakePropips Donchian Trend Pro   (MT4) は、ドンチャン チャネルを使用してトレンドの方向を自動的に検出し、エントリーとエグジットの取引シグナルを提供する強力で効果的なツールです! この多機能インジケーターには、トレンド スキャナー、取引シグナル、統計パネル、スクリーナー、取引セッション、およびアラート履歴ダッシュボードが含まれます。取引シグナルを提供し、チャートを分析する時間を節約するように設計されています! ユーザー マニュアルとインストール ガイドは、ブログ投稿 (   https://www.mql5.com/en/blogs/post/751368   ) からダウンロードできます。 今日は 50% オフ! 98ドルから49ドルに値下げ! このインジケーターは、ストラテジー テスターでテストできます (ビジュアル モードを有効にします)。 詳細については、説明の下にあるビデオ チュートリアルも利用できます。 ご不明な点やサポートが必要な場合は、私に連絡してください。 TakePropips Donchian Trend Pro イン
支持線と抵抗線、そしてローソク足のギャップをチャート上に自動的に表示するため、価格が次に向かう可能性のある場所や反転する可能性のある場所を確認することができます。 このインジケーターは、私のウェブサイト(The Market Structure Trader)で教えているポジショントレード手法の一部として使用するように設計されており、ターゲットとエントリーの可能性のための重要な情報を表示します。 このインジケーターには、2つのコア機能と4つの追加機能があります: コア機能1 - 日足、週足、月足のサポートラインとレジスタンスラインの自動表示 このインジケーターは、直近2日間、最大6週間前、数ヶ月前のサポートレベルとレジスタンスレベルを自動的に引き込みます。これらのレベルの見た目は完全にカスタマイズすることができ、いくつ表示されるかを表示することもできます。これらの重要な水準は、しばしば主要な支持線と抵抗線として機能し、価格が転換して引き戻されたり反転したりする場所です。また、価格が向かうターゲットでもあるため、価格が転換する前に、取引に利用できる潜在的な距離を素早く確認するこ
通貨強さウィザードは、取引を成功させるためのオールインワン ソリューションを提供する非常に強力な指標です。このインジケーターは、複数の時間枠のすべての通貨のデータを使用して、このまたはその外国為替ペアのパワーを計算します。このデータは、使いやすい通貨インデックスと通貨パワーラインの形式で表され、特定の通貨のパワーを確認するために使用できます。 必要なのは、取引したいチャートにインジケーターを接続することだけです。インジケーターは、取引する通貨の実際の強さを示します。このインジケーターは、トレンドに合わせて取引するときに有利に利用できる売買高の圧力の極値も示します。このインジケーターには、フィボナッチに基づく可能なターゲットも表示されます。 このインジケーターは、PUSH 通知を含むあらゆるタイプのアラートを提供します。 購入後ご連絡下さい。私の取引のヒントをあなたと共有し、素晴らしいボーナスインジケーターを無料で提供します! 幸せで有益な取引をお祈りします。
IX Powerは 、FX Powerの無敵の精度をついにFX以外のシンボルにも提供します。 お気に入りの指数、株式、コモディティ、ETF、さらには暗号通貨の短期、中期、長期のトレンドの強さを正確に判断します。 お使いの端末が提供する すべてを分析する ことができます。ぜひお試しいただき、取引 タイミングが大幅に改善 されることをご体験ください。 IXパワーの主な特徴 100%正確で再描画されない計算結果 - ターミナルで利用可能なすべての取引シンボルに対して 予め設定され、さらに個別に設定可能な強度分析期間のドロップダウン選択 Eメール、メッセージ、モバイル通知による無数の通知オプション EAリクエストのためのアクセス可能なバッファ カスタマイズ可能な計算制限により、さらに優れたパフォーマンスを実現 もっと見たい人のための特別なマルチインスタンス設定 すべてのチャートでお好みの色を無限に設定可能 Windows 11とmacOSのスタイルで角を丸くした新しいパネルデザイン サブ・ウィンドウとメイン・チャートの間をシームレスに移動する、魔法のように動く
ADR反転インジケーターは、通常の1日の平均レンジに関連して価格が現在取引されている場所を一目で示します。価格が選択した平均範囲とレベルを超えると、ポップアップ、電子メール、またはプッシュを介して即座にアラートを受け取るため、プルバックと逆転にすばやくジャンプできます。インディケータは、チャート上に1日の平均レンジの極値で水平線を描画し、それらを超える価格の数学的確率が付加されているレベルを超える延長も描画します。詳細については、以下をご覧ください... インジケーターとモニターを補完するADRアラートダッシュボードここでも利用可能なすべてのペア:https:// www.mql5.com/en/market/product/62756 MT5バージョンはこちらからも入手できます:https:// www.mql5.com/en/market/product/64477/ 通常の1日平均レンジ(ADR)内で価格が取引され、これらのレベルを上回っている時間の約60%は、通常、その後の引き戻し(利益確定)の動きを伴う急激な価格の動きの指標です。毎日の範囲の上部または下部からの
Please contact me after purchase to immediately get your PDF strategy + documentation for Trend Pulse !  Introducing Trend Pulse , a unique and robust indicator capable of detecting bullish, bearish, and even ranging trends! Trend Pulse uses a special algorithm to filter out market noise with real precision. If the current symbol is moving sideways, Trend Pulse will send you a ranging signal, letting you know that it's not a good time to enter a trade. This excellent system makes Trend Pulse
RSI / TDIアラートダッシュボードを使用すると、取引するすべての主要ペアでRSIを一度に(ユーザーが選択可能に)監視できます。 次の2つの方法で使用できます。 1.複数の時間枠を選択すると、通常の取引条件を超えて延長された複数の時間枠がある場合にダッシュが表示されます。複数の時間枠にわたって買われ過ぎまたは売られ過ぎのレベルを達成したため、価格が最近激しく押し上げられたため、引き戻しまたは逆転が間もなく行われることを示す優れた指標です。 2. 1つの時間枠(トレードするのが好き)と複数のRSIレベルを使用して、その時間枠でのRSIの延長の強さを示します。これは、価格が一方向に非常に長く押し込まれ、市場が利益を得ることになっている場合に、平均回帰取引を行うための優れた戦略です。スクリーンショットの例では、H4 RSIが25レベルを超えて2ペアで拡張されていることがわかります。これは、通常の価格アクションよりもはるかに遠いため、長く行く良い機会です。 ダッシュボードは、選択した時間枠でろうそくが閉じたときに、選択したレベルでの延長された状態(買われ過ぎと売られ過
Stratos Pali Indicator   is a revolutionary tool designed to enhance your trading strategy by accurately identifying market trends. This sophisticated indicator uses a unique algorithm to generate a complete histogram, which records when the trend is Long or Short. When a trend reversal occurs, an arrow appears, indicating the new direction of the trend. Important Information Revealed Leave a review and contact me via mql5 message to receive My Top 5 set files for Stratos Pali at no cost! D
Gold Channel is a volatility-based indicator, developed with a specific timing algorithm for the XAUUSD pair, which consists of finding possible corrections in the market. This indicator shows two outer lines, an inner line (retracement line) and an arrow sign, where the theory of the channel is to help identify overbought and oversold conditions in the market. The market price will generally fall between the boundaries of the channel. If prices touch or move outside the channel it is a tra
M1 Arrow
Oleg Rodin
4.73 (15)
市場の2つの基本原則に基づく日中戦略。 このアルゴリズムは、追加のフィルターを使用したボリュームと価格の波の分析に基づいています。インディケータのインテリジェントアルゴリズムは、2つの市場要因が1つに結合した場合にのみシグナルを出します。インディケータは、より高い時間枠のデータを使用して、M1チャート上の特定の範囲の波を計算します。そして波を確認するために、インジケーターはボリュームによる分析を使用します。 このインディケータはレディトレーディングシステムです。トレーダーが必要とするのは、信号に従うことだけです。また、インジケーターはあなた自身の取引システムの基礎になることができます。取引はミニッツチャートでのみ行われます。 インジケーターがMTFの原則を使用しているという事実にもかかわらず、インジケーターのアルゴリズムは可能な限り安定しています。 購入後、必ず私に書いてください!私の取引設定と推奨事項をあなたと共有します!
Bomb Bank Signal
Igor Pereira Calil
5 (1)
Bomb Bank シグナル: MetaTrader 4 の信頼度インジケーター Bomb Bank Signal は、金融市場で最も関連性の高いトレンドを特定するように設計された MetaTrader 4 の強力なインジケーターです。動きを正確に予測するツールをお探しなら、Bomb Bank が最適です。 仕組み: このインジケーターは、出来高分析、ローソク足終値、対称トレンドという 3 つの異なる方法を組み合わせて、売買の機会を検出してシグナルを送ります。 Bomb Bank は、買いの機会を特定するときは「爆弾」のようなものであり、売りシグナルを検出するときは「ドクロ」のようなものです。 ボムバンクはなぜ違うのですか? 完全な信頼性: Bomb Bank Signal は信号を削除しません。一度シグナルが発せられると、シグナルは残り続けるので、チャンスを逃すことはありません。 極めて高い精度: Bomb Bank は誤った信号を送信しません。リアルタイムで最新情報を更新し、市場の進化に合わせて調整しながら、以前のシグナルの透明性を維持します。 ライブアップデ
Advanced Supply Demand
Bernhard Schweigert
4.91 (294)
現在33%オフ 初心者にもエキスパートトレーダーにも最適なソリューション このインジケーターは独自の機能と新しい公式を多数内蔵しており、ユニークで高品質かつ手頃な取引ツールです。このアップデートでは、2つの時間枠ゾーンを表示できるようになります。より長いTFだけでなく、チャートTFとより長いTF(ネストゾーンを表示)の両方を表示できます。すべてのSupply Demandトレーダーの皆さんのお気に召すはずです。:) 重要情報の公開 Advanced Supply Demandの可能性を最大化するには、 https://www.mql5.com/ja/blogs/post/720245 にアクセスしてください。   エントリーまたはターゲットの正確なトリガーポイントを正確に特定できれば取引がどのように改善されるか想像してみてください。新しい基盤となるアルゴリズムに基づいて構築されているため、買い手と売り手の間の潜在的な不均衡をさらに簡単に特定できます。これは、最も強い需要と供給のゾーンと、過去のパフォーマンス(古いゾーンを表示)がグラフィカルに表現されるためです。これらの機能は、最適
作者のその他のプロダクト
Hello You can copy orders between terminals for any computer via Internet (MT4 to MT4) or (MT4 to MT5) or (MT5 to MT4) or (MT5 to MT5) it's fast Open orders Modification Stop Loss and Take Profit Close Orders This is EA (Master) put it in Experts folder you must buy  (Copy orders for any computer via Internet Slave) EA too from this link if you want to copy to MT4   https://www.mql5.com/en/market/product/55097 if you want to copy to MT5   https://www.mql5.com/en/market/product/56414 Pleas
Hello This EA (expert advisor) will open orders from Telegram "Auto Open orders from Telegram" (Telegram to MT4). Please watch our video for more details: https://www.youtube.com/watch?v=p06o1xgsD5c download instructions from here https://drive.google.com/file/d/1rwZnvgaWoi3gSkEwsi7s5jeatjJLGTWc/view?usp=sharing Good luck -------------------------------------------------------------- السلام عليكم هذا الاكسبيرت سيفتح صفقات آلية وفورية من تليجرام (Telegram إلى MT4) يرجى مشاهدة الفيديو لمزيد من
Hello You can copy orders between terminals for any computer via Internet (MT4 to MT4) or (MT4 to MT5) or (MT5 to MT4) or (MT5 to MT5) it's fast Open orders Modification Stop Loss and Take Profit Close Orders This is EA (Master) put it in Experts folder you must buy  (Copy orders for any computer via Internet Slave) EA too from this link if you want to copy to MT4   https://www.mql5.com/en/market/product/55097 if you want to copy to MT5   https://www.mql5.com/en/market/product/56414 Pleas
Hello You can copy orders between terminals for any computer via Internet (MT4 to MT4) or (MT4 to MT5) or (MT5 to MT4) or (MT5 to MT5)   it's fast Open orders Modification Stop Loss and Take Profit Close Orders This is EA (slave) put it in Experts folder you must buy  (Copy orders for any computer via Internet Master) EA too from this link if you want to copy from MT4   https://www.mql5.com/en/market/product/55096 if you want to copy from MT5 https://www.mql5.com/en/market/product/56397
This EA will open buy or sell orders depending on any buffer indicator just but Buy buffer and sell buffer there is a lot of settings  in EA like take profit stop loss trailing stop duration time auto lot double lot required profit dollars to close close it reverse  and more you can download demo version and try it back test Good luck -------------------------------------------------------------- السلام عليكم هذا الاكسبيرت سيفتح شراء او بيع اعتمادًا على اي مؤشر بفر الاكسبيرت يحتوي على الكثير
Hello This EA for send Orders Signals when you open or close order and send statics to your channel in Telegram with sum of profit or Loss Pips you can share your orders with your clients in your telegram please watch our video  to see how it is fast. https://www.youtube.com/watch?v=u_7twtYZhyI you must have Telegram channel then make bot and give it Permission and get token (watch this video to know how do it) https://www.youtube.com/watch?v=x1bKWFOjSBE and you must download this files h
Hello this Indicator can Change TimeFrame easily and faster for current chart only or for all charts in same time (very fast) you can change it by press any number from 1 to 9 please watch our video https://www.youtube.com/watch?v=f6jWz_Y7dMs good luck -------------------------------------------------------------- السلام عليكم هذا مؤشر لتغيير الفريم للشارت الحالي او لجميع الشارتات بشكل اسرع وأسهل يمكنك تغيير الفريم بالضغط على اي رقم من 1 الى 9 بحيث يتمت غيير فريم الشارت الحالي فقط او جميع الشار
Hello this Indicator will draw Channels to help you to take decision to buy or sell or waiting you can show one channels or two or tens of channels if you want please watch our video for more details https://www.youtube.com/watch?v=5Cq_l9I3Yr0 good luck -------------------------------------------------------------- السلام عليكم هذا المؤشر يرسم قنوات سعرية لمساعدتك على اتخاذ قرار الشراء أو البيع أو الانتظار يمكنك عرض قناة واحدة أو قناتين أو عشرات القنوات إذا أردت يرجى مشاهدة الفيديو لمزيد من التف
Hello This Indicator will draw Green (Up) and Red (Down) small arrows from Multi TimeFrames based in ( Moving Average) to help you to take decision to buy or sell or waiting If there 4 green arrows in same vertical line that's mean (Up) and If there 4 Red arrows in same vertical line that's mean (Down)  and the options contain (Alert and Mobile , Mail Notifications). Please watch our video for more details https://youtu.be/MVzDbFYPw1M and these is EA for it https://www.mql5.com/en/market/produc
Hello This Indicator will draw Green (Up) and Red (Down) small arrows from Multi TimeFrames based in ( MACD ) to help you to take decision to buy or sell or waiting If there 4 green arrows in same vertical line that's mean (Up) and If there 4 Red arrows in same vertical line that's mean (Down)  and the options contain (Alert , Mobile and Mail Notifications). Please watch our video for more details https://youtu.be/MVzDbFYPw1M and these is EA for it https://www.mql5.com/en/market/product/53352  
Hello This Indicator will draw Green (Up) and Red (Down) small arrows from Multi TimeFrames based in ( RSI ) to help you to take decision to buy or sell or waiting If there 4 green arrows in same vertical line that's mean (Up) and If there 4 Red arrows in same vertical line that's mean (Down)  and the options contain (Alert and Mobile , Mail Notifications). Please watch our video for more details https://youtu.be/MVzDbFYPw1M and these is EA for it https://www.mql5.com/en/market/product/53352  
Hello This Indicator will draw Green (Up) and Red (Down) small arrows from Multi TimeFrames based in ( Ichimoku ) to help you to take decision to buy or sell or waiting If there 4 green arrows in same vertical line that's mean (Up) and If there 4 Red arrows in same vertical line that's mean (Down)  and the options contain (Alert and Mobile , Mail Notifications). Please watch our video for more details https://youtu.be/MVzDbFYPw1M and these is EA for it https://www.mql5.com/en/market/product/533
Hello This EA will open buy or sell orders depending on my (MTF) indicators. you can chooses 3 or 4 "Greens (Up) or Red (Down)" arrows. and a there a multi chooses in EA to make it more profit. you can find my (MTF indicators from this link) https://www.mql5.com/en/users/nebal you can buy any (MTF indicator) then put the indicator and EA on same chart and will open orders Please watch our video for more details about my (MTF indicators) https://youtu.be/MVzDbFYPw1M Good luck --------------------
Hello This Indicator will draw Green (Up) and Red (Down) small arrows from Multi TimeFrames based in ( moving average of oscillator) to help you to take decision to buy or sell or waiting If there 4 green arrows in same vertical line that's mean (Up) and If there 4 Red arrows in same vertical line that's mean (Down)  and the options contain (Alert and Mobile , Mail Notifications). Please watch our video for more details https://youtu.be/MVzDbFYPw1M and these is EA for it https://www.mql5.com/en/
Hello This Indicator will draw Green (Up) and Red (Down) small arrows from Multi TimeFrames based in ( Relative Vigor Index ) to help you to take decision to buy or sell or waiting If there 4 green arrows in same vertical line that's mean (Up) and If there 4 Red arrows in same vertical line that's mean (Down)  and the options contain (Alert and Mobile , Mail Notifications). Please watch our video for more details https://youtu.be/MVzDbFYPw1M and these is EA for it https://www.mql5.com/en/market/
Hello This Indicator will draw Green (Up) and Red (Down) small arrows from Multi TimeFrames based in (   Stochastic oscillator   ) to help you to take decision to buy or sell or waiting If there 4 green arrows in same vertical line that's mean (Up) and If there 4 Red arrows in same vertical line that's mean (Down)  and the options contain (Alert and Mobile , Mail Notifications). Please watch our video for more details https://youtu.be/MVzDbFYPw1M and these is EA for it https://www.mql5.com/en/ma
Hello This Indicator will draw Green (Up) and Red (Down) small arrows from Multi TimeFrames based in (     Williams Percent Range    ) to help you to take decision to buy or sell or waiting If there 4 green arrows in same vertical line that's mean (Up) and If there 4 Red arrows in same vertical line that's mean (Down)  and the options contain (Alert and Mobile , Mail Notifications). Please watch our video for more details https://youtu.be/MVzDbFYPw1M and these is EA for it https://www.mql5.com/e
Hello This Indicator will draw Green (Up) and Red (Down) small arrows from Multi TimeFrames based in (   Money Flow Index  ) to help you to take decision to buy or sell or waiting If there 4 green arrows in same vertical line that's mean (Up) and If there 4 Red arrows in same vertical line that's mean (Down)  and the options contain (Alert and Mobile , Mail Notifications). Please watch our video for more details https://youtu.be/MVzDbFYPw1M and these is EA for it https://www.mql5.com/en/market/p
Hello You can copy orders between terminals for any computer via Internet (MT4 to MT4) or (MT4 to MT5) or (MT5 to MT4) or (MT5 to MT5) it's fast Open orders Modification Stop Loss and Take Profit Close Orders This is EA (slave) put it in Experts folder you must buy  (Copy orders for any computer via Internet Master) EA too from this link if you want to copy from MT4 https://www.mql5.com/en/market/product/55096 if you want to copy from MT5 https://www.mql5.com/en/market/product/56397 Plea
Hello This EA for send any indicator Signals (buffer) to your channel in Telegram with photo for chart also you can share your signals with your clients in your telegram please watch the photos you must have Telegram channel then make bot and give it Permission and get token (watch this video to know how do it) https://www.youtube.com/watch?v=x1bKWFOjSBE and you must download this files https://drive.google.com/file/d/1pYpnWUr4Kb4aIwdoGVD_9zSH1HWX-tt3/view?usp=sharing then unzip files the
This EA will open buy or sell orders depending on any buffer indicator just but Buy buffer and sell buffer there is a lot of settings  in EA like take profit stop loss trailing stop duration time auto lot double lot required profit dollars to close close it reverse  and more you can download demo version and try it back test Good luck -------------------------------------------------------------- السلام عليكم هذا الاكسبيرت سيفتح شراء او بيع اعتمادًا على اي مؤشر بفر الاكسبيرت يحتوي على الكثير
Hello This EA is depending on Guaranty strategy , it open same position by wide pips every time then will close in profit. it can make a continues profit (maybe little but continues)  you can change all settings but don't be impetuous. you can download it and make Back Test before buy it good luck السلام عليكم ورحمة الله وبركاته يعتمد هذا الاكسبيرت على إستراتيجية مضمونة ، فهو يفتح نفس المركز في كل مرة   لكن على فترات متباعدة ثم سيغلق في الربح. يمكن أن تحقق ربحًا مستمرًا (ربما قليلًا ولكنه
Hello This EA is depending on strong points to enter , and you can use same lots or double lots you can download it and make Back Test before buy it I recommended GBPUSD 15 Minutes, but you can run it and try it on all pairs good luck ------------------------------------------------------ السلام عليكم ورحمة الله وبركاته يعتمد هذا الاكسبيرت في الدخول على نقاط قوية ، ويمكنك استخدامه بنفس اللوت او مضاعفات  يمكنك تحميله وعمل باك تيست قبل شرائه بالتوفيق ان شاء الله
Hello This EA is depending on Zig Zag  to find strong   points to enter you can download it and make Back Test before buy it I recommended GBPUSD 1 Hour, but you can run it and try it on all pairs good luck ------------------------------------------------------ السلام عليكم ورحمة الله وبركاته يعتمد هذا الاكسبيرت في الدخول على نقاط قوية باستخدام مؤشر زجزاج ويمكنك تحميله وعمل باك تيست قبل شرائه بالتوفيق ان شاء الله
Hello This EA is using hedge in smart way you can download it and make Back Test before buy it good luck ------------------------------------------------------ Bonjour Cet EA utilise la couverture de manière intelligente vous pouvez le télécharger et faire un Back Test avant de l'acheter bonne chance ------------------------------------------------------ السلام عليكم ورحمة الله وبركاته يعتمد هذا الاكسبيرت على الهيدج بطريقة ذكية  يمكنك تحميله وعمل باك تيست قبل شرائه بالتوفيق ان شاء الله
Hello This Indicator will draw Green (Up) and Red (Down) small arrows from Multi TimeFrames based in ( MACD ) to help you to take decision to buy or sell or waiting If there 4 green arrows in same vertical line that's mean (Up) and If there 4 Red arrows in same vertical line that's mean (Down)  and the options contain (Alert , Mobile and Mail Notifications). Please watch our video for more details https://youtu.be/MVzDbFYPw1M and these is EA for it https://www.mql5.com/en/market/product/59092 G
Hello This Indicator will draw Green (Up) and Red (Down) small arrows from Multi TimeFrames based in ( Ichimoku ) to help you to take decision to buy or sell or waiting If there 4 green arrows in same vertical line that's mean (Up) and If there 4 Red arrows in same vertical line that's mean (Down)  and the options contain (Alert and Mobile , Mail Notifications). Please watch our video for more details https://youtu.be/MVzDbFYPw1M and these is EA for it https://www.mql5.com/en/market/product/590
Hello This EA (expert advisor) will open orders from Telegram "Auto Open orders from Telegram" (Telegram to MT5). Please watch our video for more details: https://www.youtube.com/watch?v=p06o1xgsD5c download instructions from here https://drive.google.com/file/d/1rwZnvgaWoi3gSkEwsi7s5jeatjJLGTWc/view?usp=sharing Good luck -------------------------------------------------------------- السلام عليكم هذا الاكسبيرت سيفتح صفقات آلية وفورية من تليجرام (Telegram إلى MT5) يرجى مشاهدة الفيديو لمزيد من
Hello This EA for send Orders Signals when you open or close order and send statics to your channel in Telegram with sum of profit or Loss Pips you can share your orders with your clients in your telegram please watch our video  to see how it is fast. https://www.youtube.com/watch?v=u_7twtYZhyI you must have Telegram channel then make bot and give it Permission and get token (watch this video to know how do it) https://www.youtube.com/watch?v=x1bKWFOjSBE and you must download this files h
Hello This EA for send any indicator Signals (buffer) to your channel in Telegram with photo for chart also you can share your signals with your clients in your telegram please watch the photos you must have Telegram channel then make bot and give it Permission and get token (watch this video to know how do it) https://www.youtube.com/watch?v=x1bKWFOjSBE and you must download this files https://drive.google.com/file/d/1pYpnWUr4Kb4aIwdoGVD_9zSH1HWX-tt3/view?usp=sharing then unzip files the
フィルタ:
レビューなし
レビューに返信
バージョン 3.0 2021.06.17
Make it better
バージョン 2.0 2020.09.04
You can change Time Frames from Indicator inputs as you like